

Local structure can identify and quantify influential global spreaders in large scale social networks
- PMID: 29970418
- PMCID: PMC6055149
- DOI: 10.1073/pnas.1710547115
Local structure can identify and quantify influential global spreaders in large scale social networks
Abstract
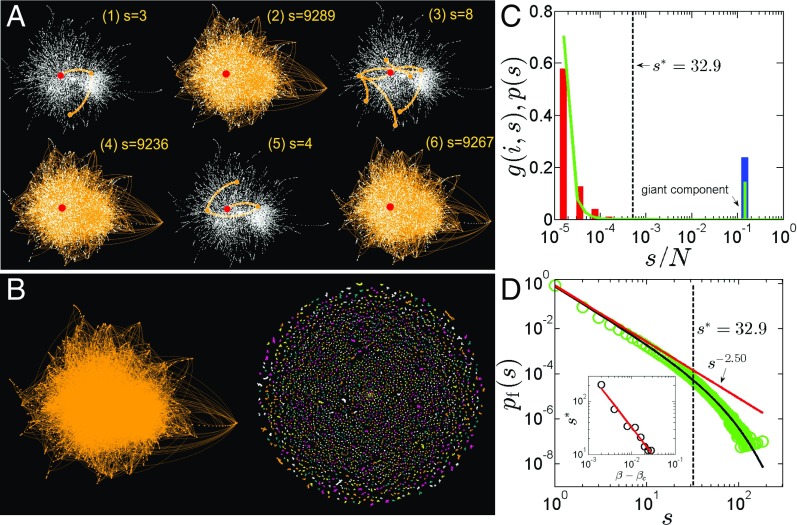
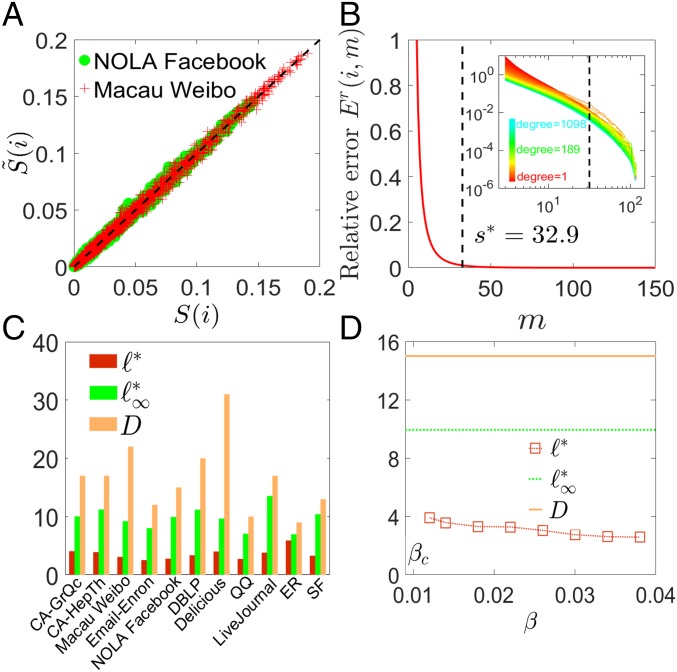
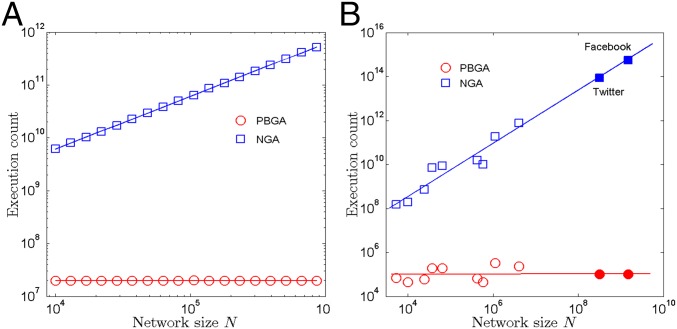
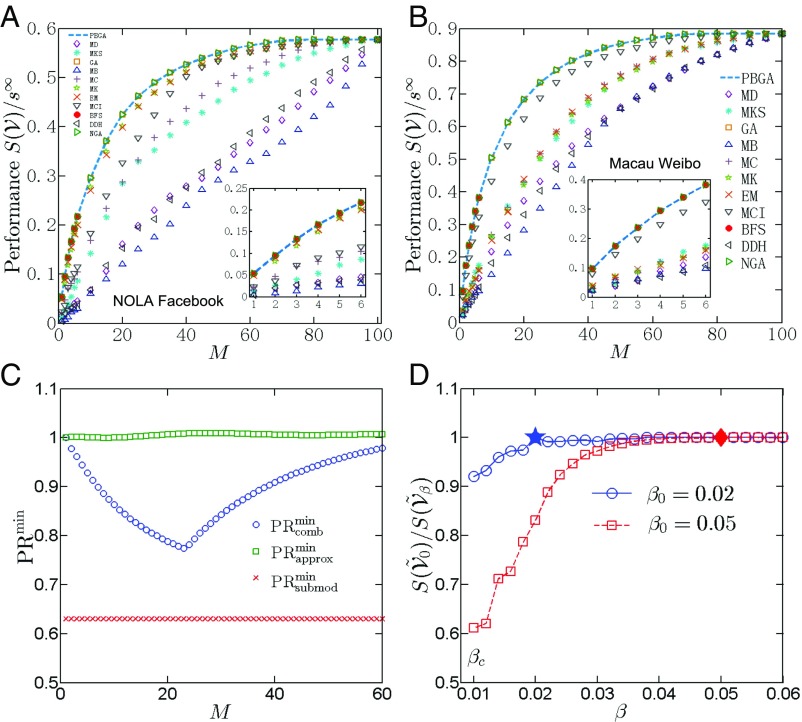
Measuring and optimizing the influence of nodes in big-data online social networks are important for many practical applications, such as the viral marketing and the adoption of new products. As the viral spreading on a social network is a global process, it is commonly believed that measuring the influence of nodes inevitably requires the knowledge of the entire network. Using percolation theory, we show that the spreading process displays a nucleation behavior: Once a piece of information spreads from the seeds to more than a small characteristic number of nodes, it reaches a point of no return and will quickly reach the percolation cluster, regardless of the entire network structure; otherwise the spreading will be contained locally. Thus, we find that, without the knowledge of the entire network, any node's global influence can be accurately measured using this characteristic number, which is independent of the network size. This motivates an efficient algorithm with constant time complexity on the long-standing problem of best seed spreaders selection, with performance remarkably close to the true optimum.
Keywords: complex network; influence; percolation; social media; viral marketing.
Conflict of interest statement
The authors declare no conflict of interest.
Figures
Similar articles
-
Identification of influential spreaders in complex networks using HybridRank algorithm.Sci Rep. 2018 Aug 9;8(1):11932. doi: 10.1038/s41598-018-30310-2. Sci Rep. 2018. PMID: 30093716 Free PMC article.
-
Leveraging percolation theory to single out influential spreaders in networks.Phys Rev E. 2016 Jun;93(6):062314. doi: 10.1103/PhysRevE.93.062314. Epub 2016 Jun 22. Phys Rev E. 2016. PMID: 27415287
-
Identifying and quantifying potential super-spreaders in social networks.Sci Rep. 2019 Oct 15;9(1):14811. doi: 10.1038/s41598-019-51153-5. Sci Rep. 2019. PMID: 31616035 Free PMC article.
-
Best influential spreaders identification using network global structural properties.Sci Rep. 2021 Jan 26;11(1):2254. doi: 10.1038/s41598-021-81614-9. Sci Rep. 2021. PMID: 33500445 Free PMC article.
-
Role-Aware Information Spread in Online Social Networks.Entropy (Basel). 2021 Nov 19;23(11):1542. doi: 10.3390/e23111542. Entropy (Basel). 2021. PMID: 34828240 Free PMC article. Review.
Cited by
-
Influential Nodes Identification in Complex Networks via Information Entropy.Entropy (Basel). 2020 Feb 21;22(2):242. doi: 10.3390/e22020242. Entropy (Basel). 2020. PMID: 33286016 Free PMC article.
-
Systematic comparison between methods for the detection of influential spreaders in complex networks.Sci Rep. 2019 Oct 22;9(1):15095. doi: 10.1038/s41598-019-51209-6. Sci Rep. 2019. PMID: 31641200 Free PMC article.
-
Beyond network centrality: individual-level behavioral traits for predicting information superspreaders in social media.Natl Sci Rev. 2024 Mar 1;11(7):nwae073. doi: 10.1093/nsr/nwae073. eCollection 2024 Jul. Natl Sci Rev. 2024. PMID: 38883306 Free PMC article.
-
Spreading dynamics of information on online social networks.Proc Natl Acad Sci U S A. 2025 Jan 28;122(4):e2410227122. doi: 10.1073/pnas.2410227122. Epub 2025 Jan 23. Proc Natl Acad Sci U S A. 2025. PMID: 39847317 Free PMC article.
-
Detecting and modelling real percolation and phase transitions of information on social media.Nat Hum Behav. 2021 Sep;5(9):1161-1168. doi: 10.1038/s41562-021-01090-z. Epub 2021 Apr 1. Nat Hum Behav. 2021. PMID: 33795858
References
-
- Rust RT, Oliver RW. The death of advertising. J Advert. 1994;23:71–77.
-
- Kitsak M, et al. Identification of influential spreaders in complex networks. Nat Phys. 2010;6:888–893.
-
- Wang P, et al. Understanding the spreading patterns of mobile phone viruses. Science. 2009;324:1071–1076. - PubMed
-
- Morone F, Makse HA. Influence maximization in complex networks through optimal percolation. Nature. 2015;524:65–68. - PubMed
-
- Aral S, Walker D. Identifying influential and susceptible members of social networks. Science. 2012;337:337–341. - PubMed
Publication types
LinkOut - more resources
Full Text Sources
Other Literature Sources
Research Materials
