. 2018 Aug;28(8):1169-1178.
doi: 10.1101/gr.231753.117. Epub 2018 Jul 3.

Massive variation of short tandem repeats with functional consequences across strains of Arabidopsis thaliana

Affiliations

Massive variation of short tandem repeats with functional consequences across strains of Arabidopsis thaliana

Maximilian O Press et al. Genome Res. 2018 Aug.

Abstract

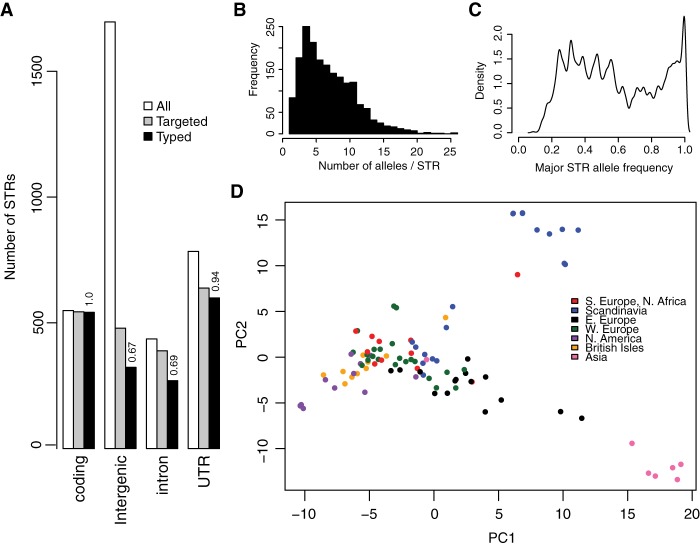
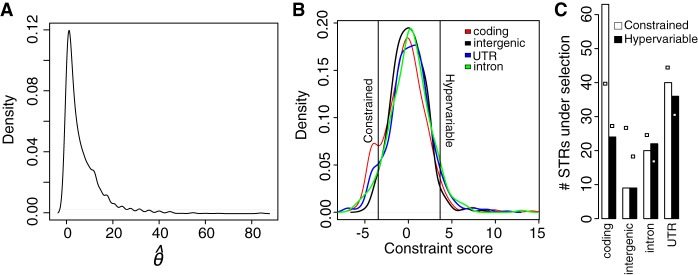
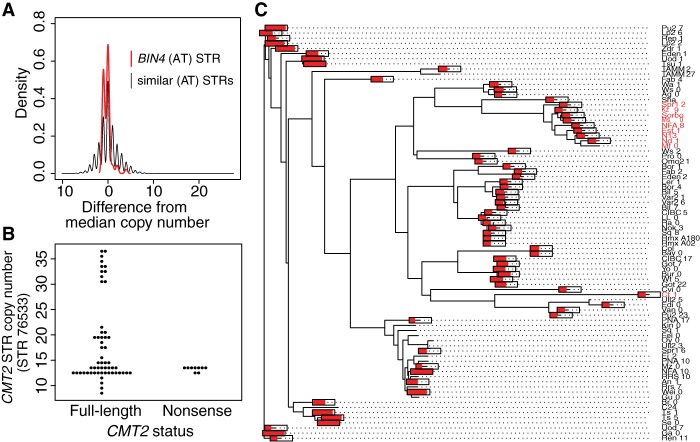
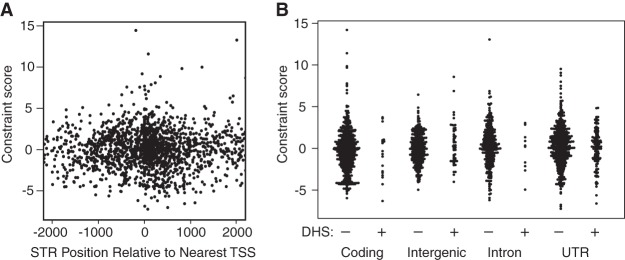
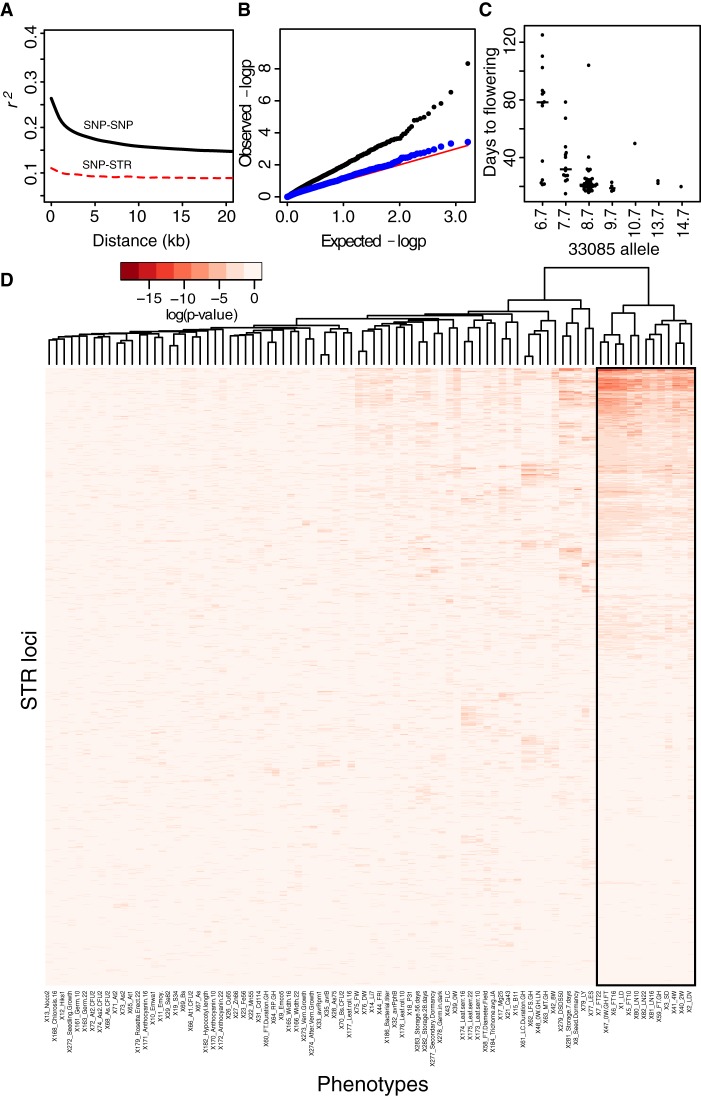
Short tandem repeat (STR) mutations may comprise more than half of the mutations in eukaryotic coding DNA, yet STR variation is rarely examined as a contributor to complex traits. We assessed this contribution across a collection of 96 strains of Arabidopsis thaliana, genotyping 2046 STR loci each, using highly parallel STR sequencing with molecular inversion probes. We found that 95% of examined STRs are polymorphic, with a median of six alleles per STR across these strains. STR expansions (large copy number increases) are found in most strains, several of which have evident functional effects. These include three of six intronic STR expansions we found to be associated with intron retention. Coding STRs were depleted of variation relative to noncoding STRs, and we detected a total of 56 coding STRs (11%) showing low variation consistent with the action of purifying selection. In contrast, some STRs show hypervariable patterns consistent with diversifying selection. Finally, we detected 133 novel STR-phenotype associations under stringent criteria, most of which could not be detected with SNPs alone, and validated some with follow-up experiments. Our results support the conclusion that STRs constitute a large, unascertained reservoir of functionally relevant genomic variation.


Figures

Figure 1.
Figure 1.
STRs in A. thaliana show a complex allele frequency distribution and geographic differentiation. (A) Distribution and ascertainment of STR loci. (All) All STRs matching the definition of STRs for this study, e.g., ≤200 bp length in TAIR10, ≥89% purity in TAIR10, 2–10 bp nucleotide motif. (Targeted) The 2046 STRs targeted for MIP capture. (Typed) STRs successfully genotyped in the Col-0 genome in a MIPSTR assay. Numbers above the bars indicate the proportion of targeted STRs in the relevant category that were successfully genotyped. (B) The distribution of allele counts across all genotyped STRs. (C) The distribution of major allele frequencies (frequency of the most frequent allele at each locus) across genotyped STRs. y-Axis is arbitrary units indicating density of loci showing the relevant frequency signature. (D) Principal component analysis (PCA) reveals substantial geographic structure according to STR variation. PC1 and PC2 correspond, respectively, to 5.2% and 4.0% of total STR allele variance.
Figure 2.
Figure 2.
Inferring and assessing the functional effects of modest STR expansions. (A) The distribution of expansion scores across STRs, where the expansion score is computed as [max(STR length) – median(STR length)]/median STR length. We called any STRs with a score >2 a modest expansion (indicated). (B) Distribution of allele frequencies of the 28 expanded STR alleles. (C,D) Distribution of STR copy number of the intronic STR (motif CAA) in the NTM1 gene and the 3′ UTR STR (motif AT) in the MEE36 gene. (E) RT-PCR demonstrates intron retention in NTM1 mRNA in the Mr-0 strain, which carries the STR expansion, yielding an aberrant 437-bp product. (F) MEE36 transcript abundances measured by qRT-PCR and normalized relative to UBC21 transcript levels. For each strain, two independent biological replicates are shown as points. Transcript levels are expressed relative to Col-0 levels (set to 1). (*) STR genotype corrected by follow-up dideoxy sequencing. Strains and order are the same between E and F.
Figure 3.
Figure 3.
Detecting functionally constrained STRs. (A) The distribution of θ^ (Watterson's estimator, or estimated population mutation rate) (Haasl and Payseur 2010) across all genotyped STR loci. (B) Distribution of “selection scores” across all STRs, separated by locus category. Vertical lines indicate 2.5% and 97.5% quantiles of the distribution of intergenic STRs, which are used as thresholds for putative constraint and hypervariability, respectively. (C) STRs under selection, e.g., constrained or hypervariable STRs, separated by locus category. White boxes indicate the expected numbers for each bar, based on number of STRs in each locus category and number of STRs under different types of selection.
Figure 4.
Figure 4.
Noncoding STRs showing non-neutral variation. (A) BIN4 intron STR is constrained relative to similar STRs. Allele frequency spectra are normalized by subtracting the median copy number (9 for the BIN4 STR). All pure STRs with TA/AT motifs and a median copy number between 7 and 12 are included in the “similar STRs” distribution. (B) Lack of association between near-expansion CMT2 STR alleles and previously described nonsense mutations. (C) Neighbor-joining tree of a 10-kb region of A. thaliana Chromosome 4 encompassing the CMT2 gene across 81 strains with available data, using Kimura's two-parameter distance model in APE (Paradis et al. 2004). Text labels in red indicate an adaptive nonsense mutation early in the first exon of CMT2, as noted previously (Shen et al. 2014). Red bars drawn on tips of the tree indicate the length of the CMT2 intronic STR (as a proportion of its maximum length, 36.5 units) in each of the 81 strains or tips. The bars are omitted for tips with missing STR data.
Figure 5.
Figure 5.
Relationship of STR constraint to putative gene regulatory elements. (A) Constraint score from Figure 3B plotted with respect to nearest TSS. (B) Constraint score from Figure 3B plotted with respect to STR annotations and presence of (putatively regulatory) DNase I hypersensitive sites (DHS).
Figure 6.
Figure 6.
Diverse associations of STRs with quantitative phenotypes. (A) Multiallelic LD (Zaykin et al. 2008) estimates for STR and SNP loci. Lowess lines for each category are plotted. All values of r2 < 0.05 are omitted from lowess calculation for visualization purposes. (B) Quantile–quantile plot of P-values from tests of association between STRs and germination rate after 28 d of storage. (C) An example association between an STR (33085) and a phenotype (flowering time in long days after 4 wk vernalization) in A. thaliana strains. Median of each distribution is indicated by a bar proportional in width to the number of observations. (D) Heatmap showing pairwise associations between STRs and phenotypes, summarized by the P-value from a linear mixed model, fitting STR allele as a fixed effect and kinship as a random effect. Both rows and columns are clustered, although the row dendrogram was omitted for clarity. STRs with genotype information in fewer than 25 strains are not displayed. Flowering time phenotypes are boxed in black.

References

    1. The 1001 Genomes Consortium. 2016. 1,135 genomes reveal the global pattern of polymorphism in Arabidopsis thaliana. Cell 166: 481–491. - PMC - PubMed
    1. Acuna-Hidalgo R, Veltman JA, Hoischen A. 2016. New insights into the generation and role of de novo mutations in health and disease. Genome Biol 17: 241. - PMC - PubMed
    1. Alexandre CM, Urton JR, Jean-Baptiste K, Dorrity MW, Cuperus JC, Sullivan AM, Bemm F, Jolic D, Arsovski AA, Thompson A, et al. 2017. Regulatory DNA in A. thaliana can tolerate high levels of sequence divergence. bioRxiv 10.1101/104323. - DOI
    1. Alonso JM, Stepanova AN, Leisse TJ, Kim CJ, Chen H, Shinn P, Stevenson DK, Zimmerman J, Barajas P, Cheuk R, et al. 2003. Genome-wide insertional mutagenesis of Arabidopsis thaliana. Science 301: 653–657. - PubMed
    1. Antignani V, Klocko AL, Bak G, Chandrasekaran SD, Dunivin T, Nielsen E. 2015. Recruitment of PLANT U-BOX13 and the PI4Kβ1/β2 phosphatidylinositol-4 kinases by the small GTPase RabA4B plays important roles during salicylic acid-mediated plant defense signaling in Arabidopsis. Plant Cell 27: 243–261. - PMC - PubMed

Publication types

LinkOut - more resources