. 2018 Aug 6;215(8):2175-2195.
doi: 10.1084/jem.20171767. Epub 2018 Jul 3.

Inhibition of CRTH2-mediated Th2 activation attenuates pulmonary hypertension in mice

Affiliations
Free PMC article

Inhibition of CRTH2-mediated Th2 activation attenuates pulmonary hypertension in mice

Guilin Chen et al. J Exp Med. .
Free PMC article

Abstract

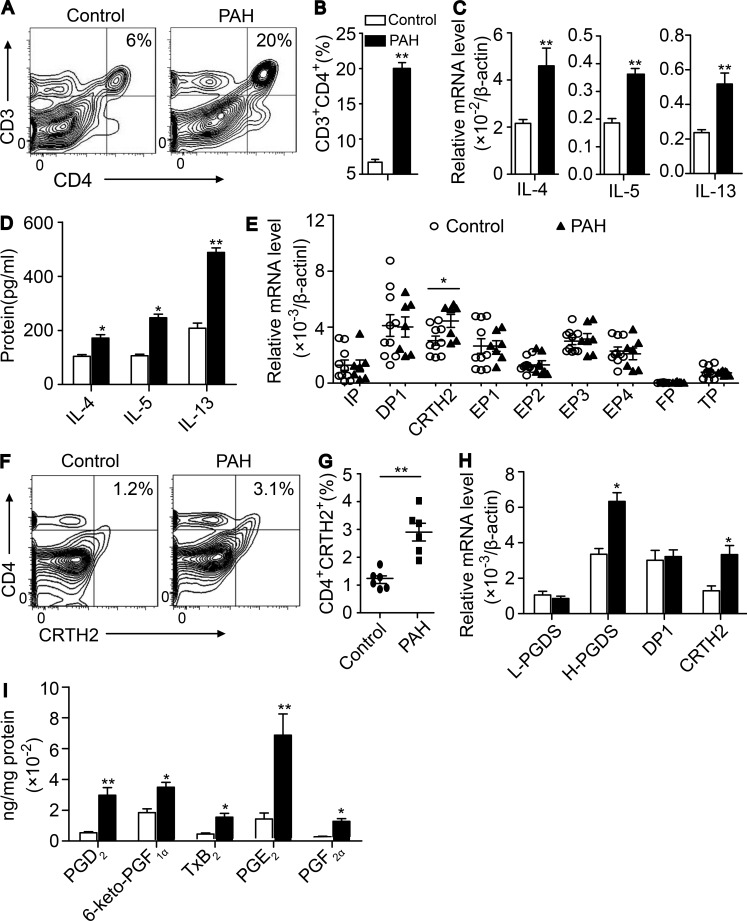
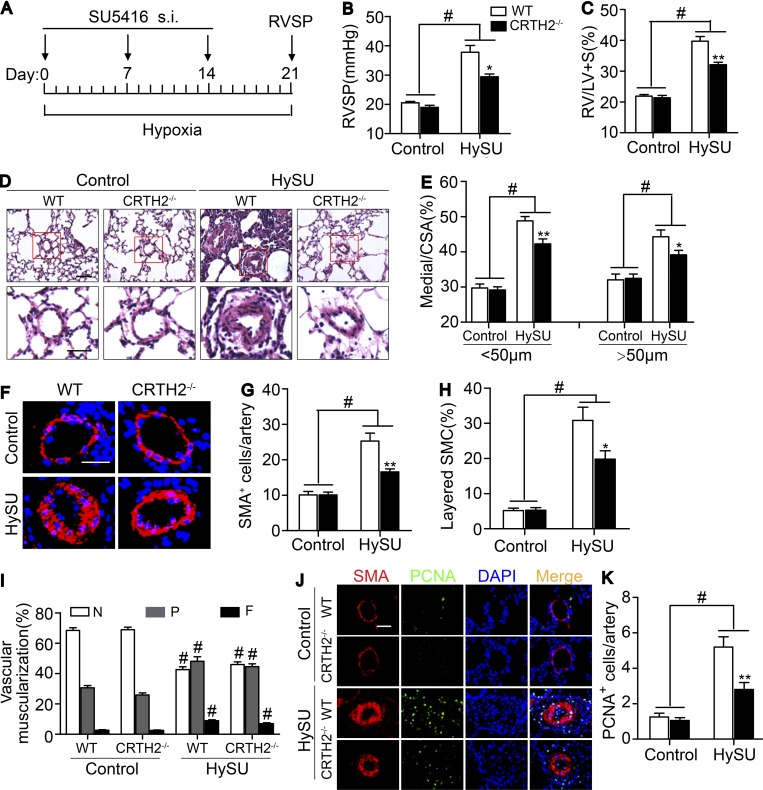
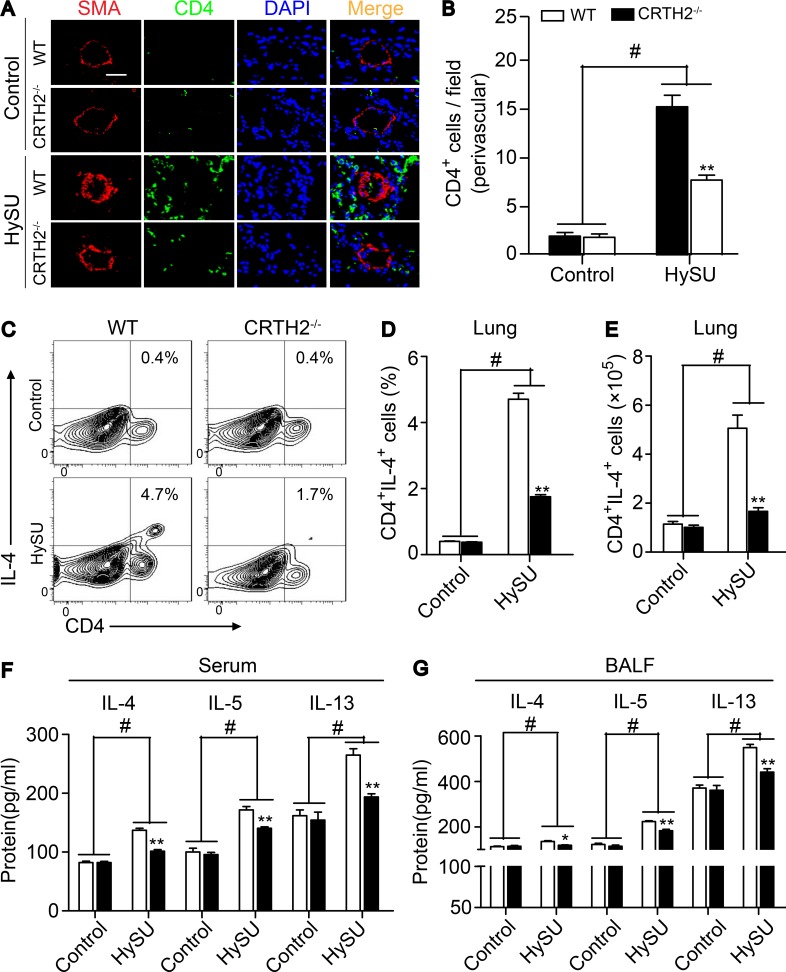
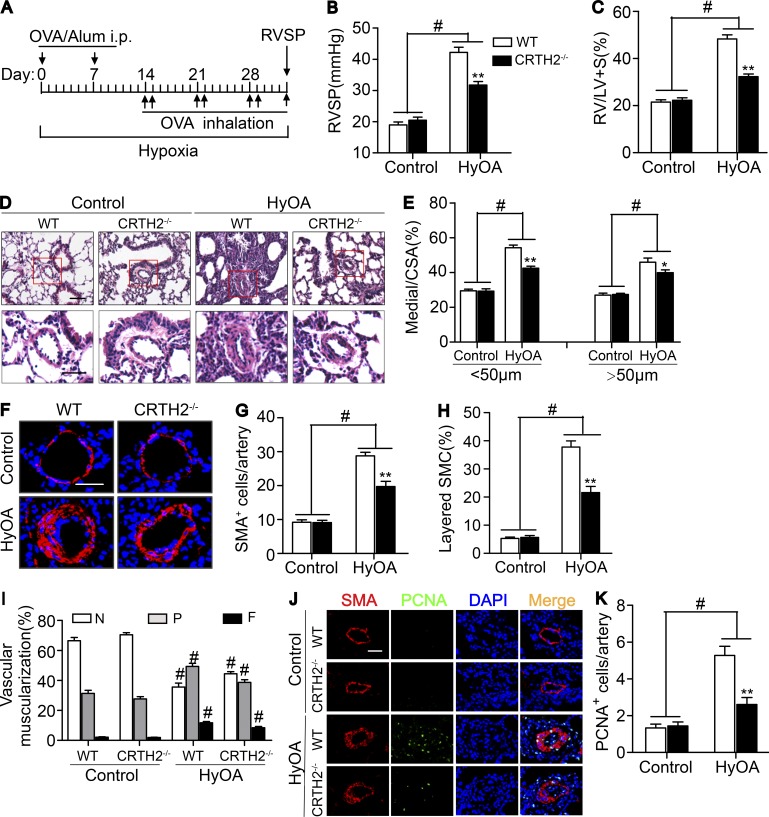
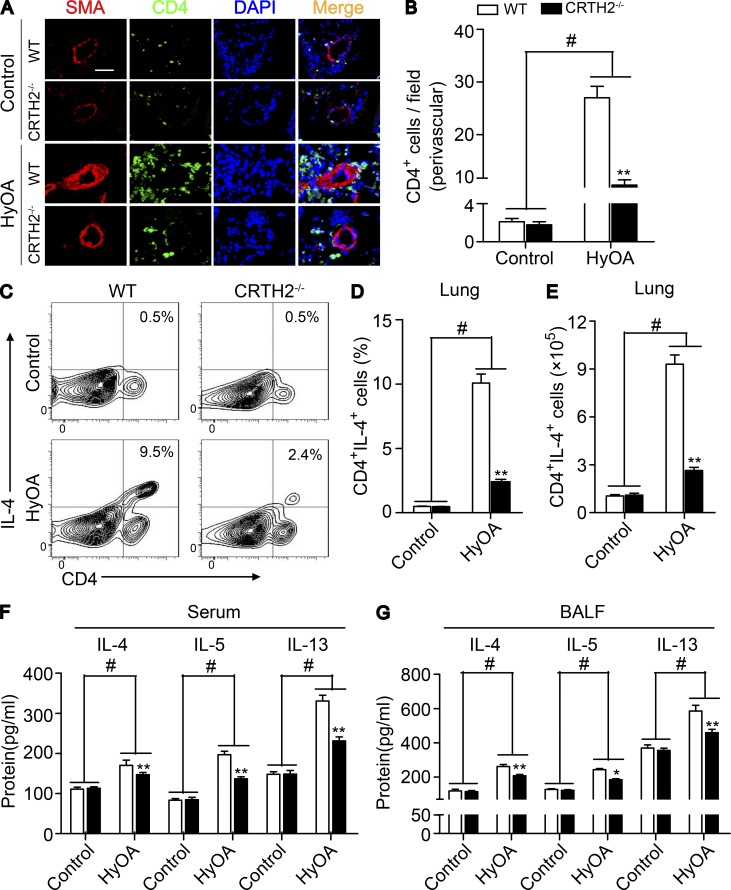
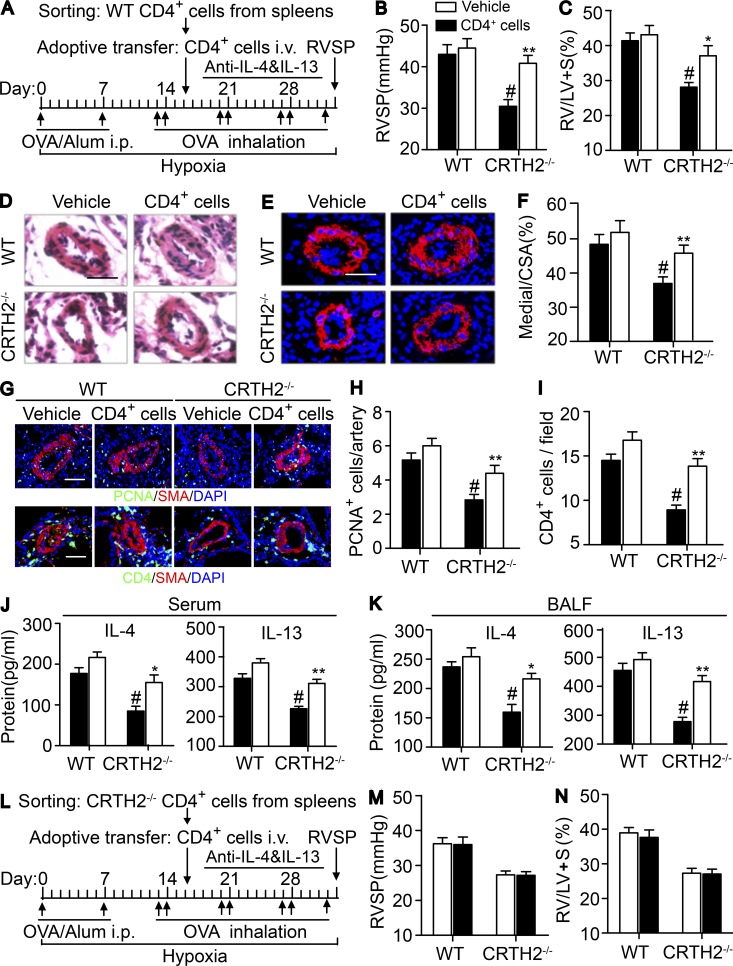
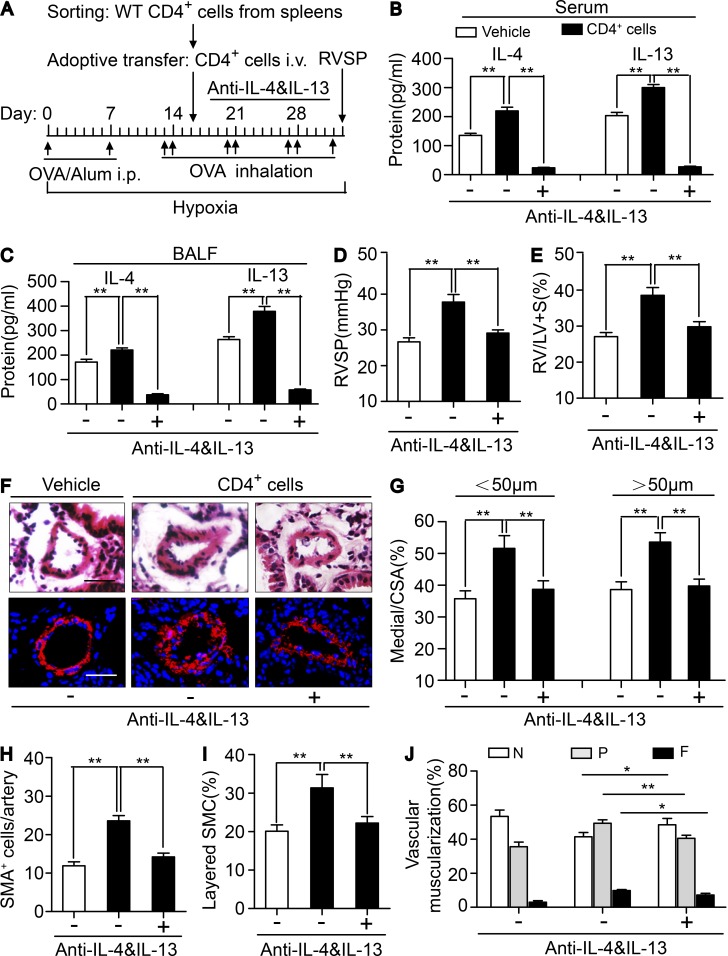
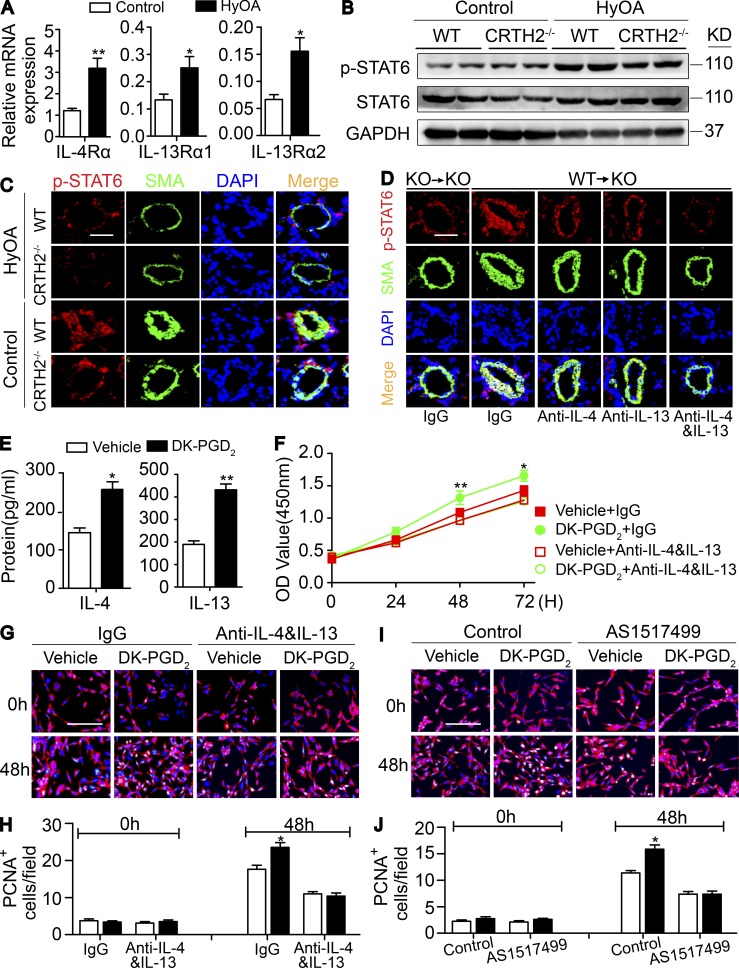
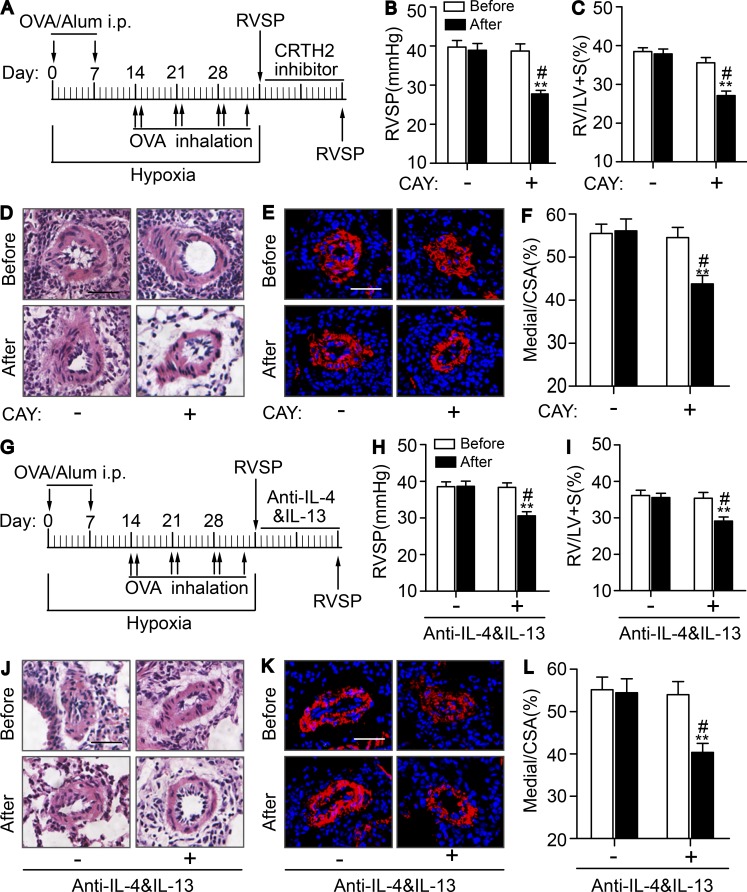
Pulmonary arterial hypertension (PAH) is a life-threatening disease characterized by progressive pulmonary artery (PA) remodeling. T helper 2 cell (Th2) immune response is involved in PA remodeling during PAH progression. Here, we found that CRTH2 (chemoattractant receptor homologous molecule expressed on Th2 cell) expression was up-regulated in circulating CD3+CD4+ T cells in patients with idiopathic PAH and in rodent PAH models. CRTH2 disruption dramatically ameliorated PA remodeling and pulmonary hypertension in different PAH mouse models. CRTH2 deficiency suppressed Th2 activation, including IL-4 and IL-13 secretion. Both CRTH2+/+ bone marrow reconstitution and CRTH2+/+ CD4+ T cell adoptive transfer deteriorated hypoxia + ovalbumin-induced PAH in CRTH2-/- mice, which was reversed by dual neutralization of IL-4 and IL-13. CRTH2 inhibition alleviated established PAH in mice by repressing Th2 activity. In culture, CRTH2 activation in Th2 cells promoted pulmonary arterial smooth muscle cell proliferation through activation of STAT6. These results demonstrate the critical role of CRTH2-mediated Th2 response in PAH pathogenesis and highlight the CRTH2 receptor as a potential therapeutic target for PAH.


Figures

Figure 1.
Figure 1.
Circulating Th2 cells and CRTH2 expression in T cells are increased in patients with idiopathic PAH and mice exposed to hypoxia. (A–D) Activated Th2 response in lung tissues of chronic hypoxia-challenged mice. (A) Flow cytometric analysis of CD3+CD4+ T cells in lung tissues. (B) Quantification of the frequency of CD3+CD4+ T cells in lung tissues. (C) Relative mRNA expression of IL-4, IL-5, and IL-13 in CD4+ T cells in lung tissues. (D) Quantification of IL-4, IL-5, and IL-13 protein levels in BALF by ELISA. In A–D, n = 6–8 mice per group. *, P < 0.05; **, P < 0.01 versus normoxia group. (E) Relative mRNA levels of PG receptors in isolated CD4+ T cells from patients with PAH and healthy subjects. Patients, n = 7; healthy subjects, n = 10. *, P < 0.05 versus healthy subjects. (F) CRTH2 expression in CD4+ T cells from patients with PAH and healthy subjects by flow cytometry. (G) Quantification of the frequency of CD4+CRTH2+ T cells in white blood cells from patients with PAH and healthy subjects. Patients, n = 6; healthy subjects, n = 6. **, P < 0.01 versus healthy subjects. (H) Relative mRNA levels of L-PGDS, H-PGDS, and PGD2 receptors (DP1 and CRTH2) in CD4+ T cells isolated from lung tissues of mice exposed to chronic hypoxia. L-PGDS = lipocalin-type PGD2 synthase; H-PGDS = hematopoietic PGD2 synthase. (I) PG production in the lung tissues of hypoxia-challenged mice analyzed by LC-MS. In H and I, n = 6–8 mice per group. *, P < 0.05; **, P < 0.01 versus normoxia group. All graphs are shown as mean ± SEM. Data are representative of at least two independent experiments. Statistical significance was determined using unpaired Student’s t tests. PGF, prostaglandin F; TxB2, thromboxane B2; PGE2, prostaglandin E2.
Figure 2.
Figure 2.
The absence of CRTH2 attenuates the development of chronic HySU-induced PAH in mice. (A) Protocol for HySU-induced PAH in mice. (B) RVSP in CRTH2−/− and WT mice after HySU treatment. (C) Fulton index (RV/LV + S) in CRTH2−/− and WT mice after HySU 6 treatment. (D) Representative images of H&E staining of lung sections from HySU-treated CRTH2−/− and WT mice. Bar, 20 µm. (E) Quantification of the ratio of pulmonary arterial medial thickness to total vessel size (media/CSA) for the HySU treatment models. (F) α-SMA immunostaining of lung sections from HySU-treated CRTH2−/− and WT mice and controls. Bar, 20 µm. (G) Quantification of the number of SMCs in PAs from mice treated with HySU. (H) Quantification of the percent layered SMCs in PAs. (I) Proportion of nonmuscularized (N), partially muscularized (P), or full muscularized (F) pulmonary arterioles (20–50 µm in diameter) from HySU-treated and control mice. (J) Representative images of PCNA and α-SMA immunostaining of the lung tissues from HySU-challenged WT and CRTH2−/− mice. Bar, 20 µm. (K) Quantification of PCNA-expressing cells in PAs. In A–K, n = 8–10 mice per group. *, P < 0.05; **, P < 0.01 versus WT; and #, P < 0.05 versus control. All graphs are shown as mean ± SEM. Data are representative of at least two independent experiments. Statistical analysis was performed using two-way ANOVA followed by a Bonferroni post hoc test and unpaired Student’s t tests.
Figure 3.
Figure 3.
CRTH2 deletion suppresses Th2 immune responses in the lungs of HySU-treated mice. (A) Representative immunostaining images of CD4 (green) and SMA (red) in the lung sections from HySU-treated WT and CRTH2−/− mice. Bar, 20 µm. (B) Quantification of perivascular CD4+ cells in the lungs as shown in A. (C–E) Representative flow cytometry charts (C) and quantification of the frequency (D) and number (E) of CD4+IL-4+ cells in lung tissues from HySU-challenged WT and CRTH2−/− mice. (F and G) Quantification of IL-4, IL-5, and IL-13 levels in the peripheral blood (F) and BALF (G) by ELISA. In A–G, n = 8–10 mice per group. *, P < 0.05; **, P < 0.01 versus WT; and #, P < 0.05 versus control. Data are shown as mean ± SEM and are representative of at least two independent experiments. Statistical analysis was performed using a two-way ANOVA followed by a Bonferroni post hoc test and unpaired Student’s t test.
Figure 4.
Figure 4.
Disruption of CRTH2 receptor ameliorates the progression of HyOA-induced PAH in mice. (A) Protocol for HyOA-induced PAH in mice. (B and C) Effect of CRTH2 deletion on RVSP (B) and RV/LV + S ratio (C) in WT and CRTH2−/− mice after HyOA treatment. (D) Representative images of H&E staining of lung sections from HyOA-treated CRTH2−/− and WT mice. Bar, 20 µm. (E) Quantification of the ratio of pulmonary arterial medial thickness to total vessel size (media/CSA) for the HyOA treatment models. (F) SMA immunostaining of pulmonary vessels (20–50 µm in diameter). Bar, 20 µm. (G and H) Quantification of the number (G) and percentage (H) of layered SMCs in PAs from HyOA-treated mice. (I) Proportion of nonmuscularized (N), partially muscularized (P), or full (F) muscularized pulmonary arterioles (20–50 µm in diameter) from HyOA-treated mice. (J) Representative images of PCNA (green) and SMA (red) immunostaining of lung tissues from HyOA-treated mice. Bar, 20 µm. (K) Quantification of PCNA+ cells in PAs. In A–K, n = 8–12 mice per group. *, P < 0.05; **, P < 0.01 versus WT; and #, P < 0.05 versus control. All data are expressed as mean ± SEM derived from two independent experiments. P values were calculated using two-way ANOVA followed by a Bonferroni post hoc test or unpaired Student’s t test.
Figure 5.
Figure 5.
CRTH2 knockout reduces Th2 immune responses in the lungs of HyOA-treated mice. (A) Representative immunostaining images of CD4 (green) and SMA (red) in lung sections from HyOA-treated WT and CRTH2−/− mice. Bar, 20 µm. (B) Quantification of perivascular CD4+ cells in lung tissues as shown in A. (C–E) Representative flow cytometry charts (C) and quantification of the frequency (D) and number (E) of CD4+IL-4+ cells in lung tissues from HyOA-treated WT and CRTH2−/−mice. (F and G) Quantification of IL-4, IL-5, and IL-13 levels in peripheral blood (F) and BALF (G) by ELISA. In A–G, n = 8–12 mice per group. *, P < 0.05; **, P < 0.01 versus WT; and #, P < 0.05 versus control. Representative data are shown as mean ± SEM derived from two independent experiments. Statistical significance was determined using two-way ANOVA followed by a Bonferroni post hoc test or unpaired Student’s t tests.
Figure 6.
Figure 6.
Adoptive transfer of CRTH2+/+ CD4+ T cells exaggerates HyOA-induced PAH in CRTH2−/− mice. (A) Schematic representation of the protocol for administration of CRTH2+/+ CD4+ T cells to WT and CRTH2−/− mice. (B and C) Effect of adoptive transfer of CRTH2+/+ CD4+ T cells on RVSP (B) and RV/LV + S ratio (C) of WT and CRTH2−/− mice. (D and E) Representative images of H&E staining (D) and SMA (red) immunostaining (E) of lung sections of HyOA-treated CRTH2−/− mice after CRTH2+/+ CD4+ T cell infusion. Bars, 20 µm. (F) Quantification of the ratio of pulmonary arterial medial thickness to total vessel size (media/CSA). (G) Representative images of PCNA (green, top) and CD4 (green, bottom) immunostaining in lung tissues from HyOA-treated mice after CRTH2+/+CD4+ T cell infusion. Bars, 20 µm. (H) Quantification of PCNA+ cells in PAs. (I) Quantification of perivascular infiltration of CD4+ cells in the lungs in HyOA-treated mice after CRTH2+/+ CD4+ T cell infusion. (J and K) Quantification of secretion levels of IL-4 and IL-13 in the serum (J) and BALF (K) from HyOA-treated mice after CRTH2+/+ CD4+ T cell infusion. In A–K, n = 8–10 mice per group. *, P < 0.05; **, P < 0.01 versus vehicle; and #, P < 0.05 versus WT. (L) The protocol for administration of CRTH2−/− CD4+ T cells to WT and CRTH2−/− mice. (M and N) Effect of adoptive transfer of CRTH2−/− CD4+ T cells on RVSP (M) and RV/LV + S ratio (N) of WT and CRTH2−/− mice; n = 6–8 mice per group. Data are presented as mean ± SEM and are representative of two independent experiments. Statistical significance was determined using two-way ANOVA followed by a Bonferroni post hoc test and unpaired Student’s t tests.
Figure 7.
Figure 7.
Neutralization of IL-4 and IL-13 reversed infusion of CRTH2+/+ CD4+ T cells exaggerated PAH in CRTH2−/− mice. (A) Schematic representation of the protocol for administration of CRTH2+/+ CD4+ T cell–infused CRTH2−/− mice to induce PAH. (B and C) Protein levels of IL-4 and IL-13 in the serum (B) and BALF (C) from HyOA-treated mice after CRTH2+/+ CD4+ T cell infusion with or without dual neutralization of IL-4 and IL-13. (D and E) Effect of neutralization of IL-4 and IL-13 on RVSP (D) and RV/LV + S ratio (E) in CRTH2+/+ CD4+ T cell-infused CRTH2−/− mice. (F) Representative images of H&E staining and SMA (red) immunostaining of PAs of CRTH2+/+ CD4+ T cell–infused mice with or without dual neutralization of IL-4 and IL-13. Bar, 20 µm. (G) Quantification of the ratio of pulmonary arterial medial thickness to total vessel size (media/CSA) for the CRTH2+/+ CD4+ T cell–infused mice with or without dual neutralization of IL-4 and IL-13. (H and I) Quantification of the number (H) and percentages (I) of layered SMCs in PAs from CRTH2+/+ CD4+ T cell–infused mice with or without dual neutralization of IL-4 and IL-13. (J) Proportion of nonmuscularized (N), partially muscularized (P), or full muscularized (F) pulmonary arterioles (20–50 µm in diameter) from CRTH2+/+ CD4+ T cell–infused mice with or without dual neutralization of IL-4 and IL-13. In A–J, n = 8–10 mice per group. *, P < 0.05; **, P < 0.01 as indicated. All graphs are shown as mean ± SEM. Data are representative of at least two independent experiments. Statistical significance was determined using unpaired Student’s t tests.
Figure 8.
Figure 8.
Th2-mediated IL-4 and IL-13 by CRTH2 activation promotes PASMC proliferation through STAT6. (A) Relative mRNA expression of receptors of IL-4 and IL-13 (IL-4Rα, IL-13Rα1, and IL-13Rα2) in PAs from HyOA-treated mice. (B) Western blot analysis of phosphorylation of STAT6 (p-STAT6) in PAs isolated from HyOA-treated WT and CRTH2−/− mice. (C) Representative immunostaining images of SMA (green) and p-STAT6 (red) in lung tissues from HyOA-treated PAH mouse models. Bar, 20 µm. (D) Representative immunostaining images of SMA (green) and p-STAT6 (red) in lung tissues of BM-reconstructed mice with or without dual neutralization of IL-4 and IL-13. Bar, 20 µm. In A–D, n = 6–8 mice per group. *, P < 0.05; **, P < 0.01 as indicated. (E) IL-4 and IL-13 levels in the culture medium of Th2 cells treated with CRTH2 agonist DK-PGD2. n = 4. *, P < 0.05; **, P < 0.01 as indicated. (F) Growth curve of PASMCs cultured with DK-PGD2–treated Th2 cell medium with or without dual neutralization of IL-4 and IL-13. n = 6. *, P < 0.05; **, P < 0.01 as indicated. (G) Representative images of PCNA (green) and SMA (red) immunostaining of PASMCs cultured with DK-PGD2–treated Th2 cell medium with or without dual neutralization of IL-4 and IL-13. Bar, 200 µm. (H) Quantification of PCNA+SMA+ PASMCs as shown in G for five to six independent experiments. (I) Representative images of PCNA (green) and SMA (red) immunostaining of PASMCs cultured with DK-PGD2–treated Th2 cell medium with or without STAT6 inhibitor AS1517499. Bar, 200 µm. (J) Quantification of PCNA+SMA+ PASMCs in I for five to six independent experiments. *, P < 0.05; **, P < 0.01 as indicated. All graphs are shown as mean ± SEM. Data are representative of at least two independent experiments. Statistical significance was determined using two-way ANOVA followed by a Bonferroni post hoc test and unpaired Student’s t tests.
Figure 9.
Figure 9.
Pharmacological inhibition of CRTH2 receptor or dual neutralization of IL-4 and IL-13 attenuates established PAH in mice. (A) Protocol for administration of CRTH2 inhibitor CAY10595 to mice after induced by HyOA. (B and C) Effect of CAY10595 administration on RVSP (B) and RV/LV + S ratio (C) of PAH-established mice. Before, before CAY10595 treatment; After, after CAY10595 treatment; CAY, CAY10595. (D and E) Representative images of H&E staining (D) and SMA (red) immunostaining (E) of lung sections of PAH-established mice treated with CAY10595 or equivalent volume of vehicle. Bars, 20 µm. (F) Quantification of the ratio of pulmonary arterial medial thickness to total vessel size (media/CSA) in PAs from PAH-established mice after CAY10595 treatment. In A–F, n = 8–10 mice per group. *, P < 0.05; **, P < 0.01 versus vehicle (dash); #, P < 0.05 versus before CAY10595 treatment (Before). (G) Protocol for administration of neutralization antibodies of IL-4 and IL-13 to mice after being induced by HyOA. Before, before neutralizing treatment; After, after neutralizing treatment. (H and I) Effect of neutralization of IL-4 and IL-13 on RVSP (H) and RV/LV + S ratio (I) of PAH-established mice. (J and K) Representative images of H&E staining (J) and SMA (red) immunostaining (K) of lung sections of PAH-established mice treated with neutralization antibodies of IL-4 and IL-13 or equivalent volume of vehicle. Bars, 20 µm. (L) Quantification of the ratio of pulmonary arterial medial thickness to total vessel size (media/CSA) in PAs from PAH-established mice after neutralization of IL-4 and IL-13. In G–L, n = 8–10 mice per group. *, P < 0.05; **, P < 0.01 versus vehicle (dash); #, P < 0.05 versus before neutralizing treatment (Before). All graphs are shown as mean ± SEM. Data are representative of at least two independent experiments. Statistical significance was determined using two-way ANOVA followed by a Bonferroni post hoc test and unpaired Student’s t tests.

References

    1. Anwar A., Ruffenach G., Mahajan A., Eghbali M., and Umar S.. 2016. Novel biomarkers for pulmonary arterial hypertension. Respir. Res. 17:88 10.1186/s12931-016-0396-6 - DOI - PMC - PubMed
    1. Barnes P.J. 2018. Targeting cytokines to treat asthma and chronic obstructive pulmonary disease. Nat. Rev. Immunol. <ext-link xmlns:xlink="http://www.w3.org/1999/xlink" ext-link-type="uri" xlink:href="http://www.ncbi.nlm.nih.gov/entrez/query.fcgi?cmd=Retrieve&db=PubMed..."><underline>PubMed</underline></ext-link> 10.1038/s41577-018-0006-6 - DOI - PubMed
    1. Bartelds B., van Loon R.L.E., Mohaupt S., Wijnberg H., Dickinson M.G., Boersma B., Takens J., van Albada M., and Berger R.M.F.. 2012. Mast cell inhibition improves pulmonary vascular remodeling in pulmonary hypertension. Chest. 141:651–660. 10.1378/chest.11-0663 - DOI - PubMed
    1. Benza R.L., Miller D.P., Gomberg-Maitland M., Frantz R.P., Foreman A.J., Coffey C.S., Frost A., Barst R.J., Badesch D.B., Elliott C.G., et al. 2010. Predicting survival in pulmonary arterial hypertension: Insights from the Registry to Evaluate Early and Long-Term Pulmonary Arterial Hypertension Disease Management (REVEAL). Circulation. 122:164–172. 10.1161/CIRCULATIONAHA.109.898122 - DOI - PubMed
    1. Bigna J.J., Nansseu J.R., Um L.N., Noumegni S.R., Simé P.S., Aminde L.N., Koulla-Shiro S., and Noubiap J.J.. 2016. Prevalence and incidence of pulmonary hypertension among HIV-infected people in Africa: A systematic review and meta-analysis. BMJ Open. 6:e011921 10.1136/bmjopen-2016-011921 - DOI - PMC - PubMed

Publication types

MeSH terms