. 2018 Jul 3;11(537):eaar5401.
doi: 10.1126/scisignal.aar5401.

Inhibition of the acetyltransferase NAT10 normalizes progeric and aging cells by rebalancing the Transportin-1 nuclear import pathway

Affiliations

Inhibition of the acetyltransferase NAT10 normalizes progeric and aging cells by rebalancing the Transportin-1 nuclear import pathway

Delphine Larrieu et al. Sci Signal. .

Abstract

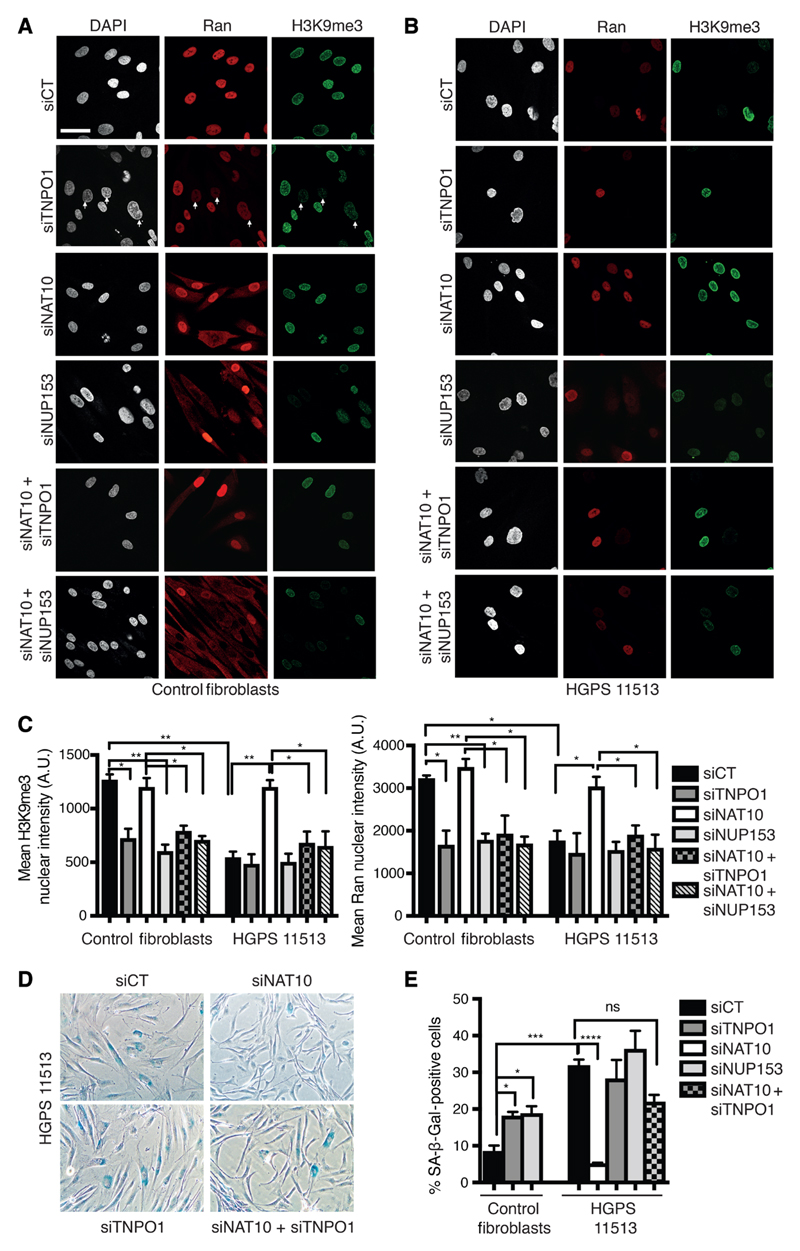
Hutchinson-Gilford progeria syndrome (HGPS) is an incurable premature aging disease. Identifying deregulated biological processes in HGPS might thus help define novel therapeutic strategies. Fibroblasts from HGPS patients display defects in nucleocytoplasmic shuttling of the GTP-bound form of the small GTPase Ran (RanGTP), which leads to abnormal transport of proteins into the nucleus. We report that microtubule stabilization in HGPS cells sequestered the nonclassical nuclear import protein Transportin-1 (TNPO1) in the cytoplasm, thus affecting the nuclear localization of its cargo, including the nuclear pore protein NUP153. Consequently, nuclear Ran, nuclear anchorage of the nucleoporin TPR, and chromatin organization were disrupted, deregulating gene expression and inducing senescence. Inhibiting N-acetyltransferase 10 (NAT10) ameliorated HGPS phenotypes by rebalancing the nuclear to cytoplasmic ratio of TNPO1. This restored nuclear pore complex integrity and nuclear Ran localization, thereby correcting HGPS cellular phenotypes. We observed a similar mechanism in cells from healthy aged individuals. This study identifies a nuclear import pathway affected in aging and underscores the potential for NAT10 inhibition as a possible therapeutic strategy for HGPS and perhaps also for pathologies associated with normal aging.


Conflict of interest statement

Competing interests: D.L. and S.P.J. are named inventors on a patent WO 2015/150824 describing compounds that include remodelin and their use in premature aging syndromes and other laminopathies. S.P.J. is a member of the scientific advisory board of Carrick Therapeutics, and D.L. and S.P.J. have received consulting fees over the past 3 years from Carrick Therapeutics, which is engaged in activities related to the subject matter of this study. All other authors declare that they have no competing interests.

Figures

Fig. 1
Fig. 1. NAT10 inhibition rescues the reduced nucleocytoplasmic transport in progeric and aged cells.
(A) Representative immunofluorescence images showing subcellular localization of Ran in skin fibroblasts from a 20-year-old healthy male (control fibro), aged individuals (AG11240, an 81-year-old female; AG04059, a 96-year-old male; AG05248, an 87-year-old male; AG09602, a 92-year-old female), and an 8-year-old HGPS patient (HGPS 11513). n = 3 independent experiments. (B) Representative Western blot showing the abundance of the indicated proteins in extracts of fibroblasts from young, aged, and HGPS individuals. n = 3 independent experiments. (C) Representative immunofluorescence images showing nuclear Ran and TPR in HGPS cells as compared to control cells. DAPI, 4′,6-diamidino-2-phenylindole. (D) Quantification of TPR nuclear intensity in the indicated cells. n = 3 independent experiments, n > 100 nuclei per experiment for each cell type. *P = 0.016 (Mann-Whitney test). Error bars indicate SEM. A.U., arbitrary units. (E) Representative immunofluorescence images showing localization of NUP153 and TPR in control and HGPS fibroblasts in the absence (untreated) or presence of the NAT10 inhibitor remodelin. (F) Quantification of NUP153 and TPR nuclear intensity from experiments in (E). n = 3 independent experiments, n > 70 nuclei per experiment for each cell type. P values from left to right: *P = 0.0111, ***P = 0.0002, *P = 0.0163, ***P = 0.0007 (Mann-Whitney test). Error bars indicate SEM. (G) PLA showing the interaction of TPR and NUP153 in control and HGPS fibroblasts in the absence (untreated) or presence of the NAT10 inhibitor remodelin. Results of the PLA were quantified as the mean number of dots per nucleus. n = 3 independent experiments, n > 50 nuclei per experiment for each cell type. (H and I) Ran nuclear localization in control and HGPS fibroblasts upon siRNA-mediated depletion of NTF2 (siNTF2) or NAT10 (siNAT10) or upon NAT10 inhibition (remodelin). siCT, control siRNA. n = 3 independent experiments, n > 70 nuclei per experiment for each cell type. P values from left to right: **P = 0.0043; ****P < 0.0001; ns, not significant; ****P < 0.0001; **P = 0.0029 (Mann-Whitney test). Error bars indicate SEM. Scale bars, 50 μm.
Fig. 2
Fig. 2. Disruption of Ran induces chromatin relaxation and senescence.
(A and B) Analysis of chromatin relaxation by MNase assay in U2OS cells upon siRNA-mediated TPR depletion (siTPR) or disruption of Ran nuclear import by NTF2 depletion (siNTF2). Scale bar, 30 μm. Digested chromatin was analyzed on an agarose gel and quantified using ImageJ. The graph is a representative figure of three independent experiments and represents the relative band intensity (y axis) of the digested nucleosomes that migrate further from the well (x axis) because the chromatin is more relaxed and thus more accessible to the MNase enzyme. (C) Representative immunofluorescence images showing H3K9me3 staining in young fibroblasts at P19 (control fibro P19), old fibroblasts at P61 (control fibro P61), and HGPS cells at P19 (HGPS 11513 P19) upon transfection with siCT or siNTF2 to disrupt the RanGTP gradient. Scale bar, 50 μm. (D) Quantification of H3K9me3 nuclear intensity from (C). n = 2 independent experiments, n > 50 nuclei per experiment for each cell type. P values from left to right: *P = 0.0159, *P = 0.014 (Mann-Whitney test). Error bars indicate SEM. (E) Senescence-associated β-galactosidase (SA-β-Gal) staining (blue cells) upon transfection with siCT or siNTF2 siRNA in control (control fibro) and HGPS (HGPS 11513) fibroblasts at the indicated passage number (P). Scale bar, 50 μm. (F) Quantification of blue cells from experiments in (C). n = 3 independent experiments, n > 200 nuclei per experiment for each cell type. P values from left to right: ***P = 0.0003, ***P = 0.0002 (Mann-Whitney test). Error bars indicate SEM.
Fig. 3
Fig. 3. The TNPO1 pathway is defective in HGPS cells and rescued by NAT10 inhibition.
(A) Representative immunofluorescence images showing the subcellular localization of TNPO1 and its cargo hnRNPA1 in control and HGPS fibroblasts in the absence (untreated) or presence of the NAT10 inhibitor remodelin. (B) Higher-magnification images from (A) showing TNPO1 nuclear and cytoplasmic subcellular localization, quantified below as nuclear-to-cytoplasmic ratio (N:C). Nuclei are outlined with white dotted lines. Box plots represent median (line), 10th to 90th percentiles (whiskers), and outliers (dots). n = 3 independent experiments, n > 50 nuclei per experiment for each cell type. P values from left to right: ****P < 0.0001; ***P = 0.0003; ****P < 0.0001; ns, not significant (Mann-Whitney test). Error bars indicate SEM. (C). Representative immunofluorescence images showing TNPO1 subcellular localization in fibroblasts from other HGPS patients (HGPS 11498) and in cells from healthy aged individuals (AG11240 and AG059). n = 3 independent experiments. (D) Western blot showing total TNPO1 and hnRNPA1 abundance in the indicated cells. n = 3 independent experiments. Scale bars, 50 μm.
Fig. 4
Fig. 4. Microtubule reorganization modulates TNPO1 localization and function.
(A) Representative immunofluorescence images from PLAs in control and HGPS fibroblasts using antibodies recognizing TNPO1 and α-tubulin. Each dot represents an interaction between one molecule of TNPO1 and one molecule of α-tubulin. Scale bar, 20 μm. (B) Quantification of the PLA shown in (A), representing both the total number of dots per cell (left panel) and the average number of spots in a defined area of cytoplasm (right panel). n = 3 independent experiments, n > 46 nuclei per experiment for each cell type. P values from left to right: ***P = 0.0005, ***P = 0.0003 (Mann-Whitney test). Error bars represent SEM. (C) Representative immunofluorescence images showing the effect of compounds that destabilize (nocodazole) or stabilize (tubacin) the microtubule network on the nuclear localization of TNPO1 and its cargo hnRNPA1. Scale bar, 50 μm. (D) Quantification of the TNPO1 nuclear-to-cytoplasmic ratio and of hnRNPA1 nuclear intensity. Box plots represent median (line), 10th to 90th percentiles (whiskers), and outliers (dots). n = 3 independent experiments, n > 50 nuclei per experiment for each cell type. Left-graph P values from left to right: **P = 0.0011; ***P = 0.0002; ***P = 0.0002; ns, not significant. Right-graph P values from left to right: ***P = 0.0002; ***P = 0.0001; ***P = 0.0001; **P = 0.0023; ns, not significant (Mann-Whitney test). Error bars represent SEM.
Fig. 5
Fig. 5. TNPO1 is required for cellular normalization mediated by NAT10 inhibition.
(A and B) Representative immunofluorescence images showing Ran and H3K9me3 staining in control (A) or HGPS (B) fibroblasts after transfection with the indicated siRNAs (see fig. S10 for protein knockdown efficiency). n = 3 independent experiments. Scale bar, 50 μm. siTNPO1, siRNA-mediated depletion of TNPO1. (C) Quantification of H3K9me3 and Ran nuclear intensity from the cells in (A) and (B). n = 3 independent experiments, n > 150 cells per experiment for each cell type. P values from left to right: (H3K9me3 in control fibroblasts) *P = 0.0195, **P = 0.0087, *P = 0.0315, *P = 0.0197, **P = 0.0064; (H3K9me3 in HGPS fibroblasts) **P = 0.0097, *P = 0.03, *P = 0.0393; (Ran in control fibroblasts) *P = 0.025, **P = 0.0075, *P = 0.0443, *P = 0.011, *P = 0.015; (Ran in HGPS fibroblasts) *P = 0.0342, *P = 0.0407, *P = 0.0368 (unpaired t test). Error bars indicate SEM. (D) Senescence-associated β-galactosidase staining in HGPS fibroblasts that had been treated with the indicated siRNAs. (E) Quantification of senescence-associated β-galactosidase staining in (D). n = 3 independent experiments, n > 200 cells per experiment for each cell type. P values from left to right: *P = 0.0107; *P = 0.049; ***P = 0.0001; ****P < 0.0001; ns, not significant (unpaired t test). Error bars indicate SEM.
Fig. 6
Fig. 6. Effects of NAT10 inhibition or depletion on gene expression.
(A) Volcano plots from the microarray analysis showing the number of genes with decreased (blue) or increased (red) expression in HGPS fibroblasts compared to control fibroblasts, in control fibroblasts treated with remodelin, and in HGPS fibroblasts treated with remodelin. n = 3 independent experiments. The log10 of the adjusted P value is used such that the more significant a gene’s expression is, the higher it will appear on the y axis. The log2 of the fold change is used such that genes with increased (red) or decreased (blue) expression have equal weighting in the plot. Genes were classified as showing gene expression changes if they showed a change of twofold (up or down) or greater with an adjusted P value less than or equal to 0.05. For both control and HGPS fibroblasts, remodelin was used as a chronic treatment for 8 weeks (middle and right panels). (B) Heat maps of genes with significantly altered expression from (A) showing the effect of remodelin treatment on gene expression in HGPS cells. NT, nontreated. (C) Volcano plots from the microarray analysis showing the number of genes for which expression was decreased (blue) or increased (red) by 1.5-fold or greater under the indicated conditions. siNAT10 and siCT treatment were transient (5 days). n = 3 independent experiments. (D) Heat maps of genes presented with significantly altered expression from (C) showing the effect of NAT10 depletion on gene expression in HGPS cells.
Fig. 7
Fig. 7. NAT10 modulates gene expression through TNPO1.
(A) Representative Western blot analysis showing the efficiency of siNAT10 and siTNPO1. n = 2 independent experiments. (B and C) Venn diagrams generated from the microarray analysis showing the overlap between genes with significantly increased or decreased expression upon NAT10 depletion alone or together with TNPO1 depletion (siNAT10 + siTNPO1) in control (B) and HGPS (C) fibroblasts. (D) Gene ontology analysis showing cellular component (CC) terms enrichment from genes with significantly decreased (blue) or increased (red) expression only upon NAT10 depletion in HGPS cells. (E) Heat maps of siNAT10-specific genes presented in (C) and (D), showing the gene expression changes for genes modified by siNAT10 only (compared to siCT) in HGPS cells (row 1) and their expression in HGPS cells compared to control fibroblasts (row 2). (F) Heat maps of genes with expression significantly modified by TNPO1 depletion in control fibroblasts (row 1) and their expression in HGPS cells compared to control fibroblasts (row 2). TNPO1 is indicated by an asterisk. All analyses were performed using three biological replicates.
Fig. 8
Fig. 8. Model for how NAT10 inhibition rescues HGPS phenotypes.
(1) In control cells, TNPO1 binds to its cargo proteins, such as NUP153, in the cytoplasm. (2) The TNPO1-cargo complex translocates into the nucleus through the nuclear pore. (3) Once in the nucleus and upon RanGTP binding to TNPO1, the NUP153 cargo dissociates from TNPO1 and is incorporated into the NPC and recruits TPR to the NPC. Mature, fully functional NPCs mediate nucleocytoplasmic transport and other roles, such as anchoring chromatin to the nuclear envelope through TPR. (4) In HGPS and aging, increased microtubule network stability sequesters TNPO1 in the cytoplasm. (5) TNPO1 cargos such as NUP153 are not properly imported into the nucleus. The absence of NUP153 results in decreased nuclear Ran abundance and defects in TPR anchorage at NPCs. This leads to chromatin disorganization, global gene expression changes, and premature entry into senescence. (6) By destabilizing the microtubule network, NAT10 inhibition releases TNPO1 from the cytoplasm, enhancing its nuclear translocation together with nuclear import of its cargos such as NUP153 and hnRNPA1. This then substantially normalizes chromatin organization, RanGTP-mediated nucleocytoplasmic transport, and global transcription patterns.

Comment in

References

    1. De Sandre-Giovannoli A, Bernard R, Cau P, Navarro C, Amiel J, Boccaccio I, Lyonnet S, Stewart CL, Munnich A, Le Merrer M, Lévy N. Lamin a truncation in Hutchinson-Gilford progeria. Science. 2003;300:2055. - PubMed
    1. Eriksson M, Brown W Ted, Gordon LB, Glynn MW, Singer J, Scott L, Erdos MR, Robbins CM, Moses TY, Berglund P, Dutra A, et al. Recurrent de novo point mutations in lamin A cause Hutchinson-Gilford progeria syndrome. Nature. 2003;423:293–298. - PMC - PubMed
    1. Goldman RD, Gruenbaum Y, Moir RD, Shumaker DK, Spann TP. Nuclear lamins: Building blocks of nuclear architecture. Genes Dev. 2002;16:533–547. - PubMed
    1. Liu B, Wang J, Chan K Ming, Tjia W Mui, Deng W, Guan X, Huang J, Li K Man, Chau P Yin, Chen DJ, Pei D, et al. Genomic instability in laminopathy-based premature aging. Nat Med. 2005;11:780–785. - PubMed
    1. Scaffidi P, Misteli T. Reversal of the cellular phenotype in the premature aging disease Hutchinson-Gilford progeria syndrome. Nat Med. 2005;11:440–445. - PMC - PubMed

Publication types

MeSH terms

LinkOut - more resources