. 2018 Aug 31;293(35):13696-13706.
doi: 10.1074/jbc.RA118.003907. Epub 2018 Jul 3.

An oxanthroquinone derivative that disrupts RAS plasma membrane localization inhibits cancer cell growth

Affiliations

An oxanthroquinone derivative that disrupts RAS plasma membrane localization inhibits cancer cell growth

Lingxiao Tan et al. J Biol Chem. .

Abstract

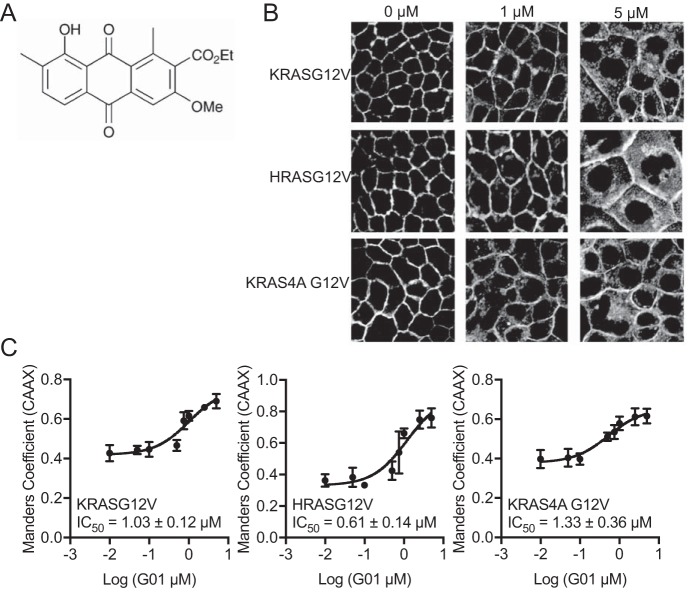
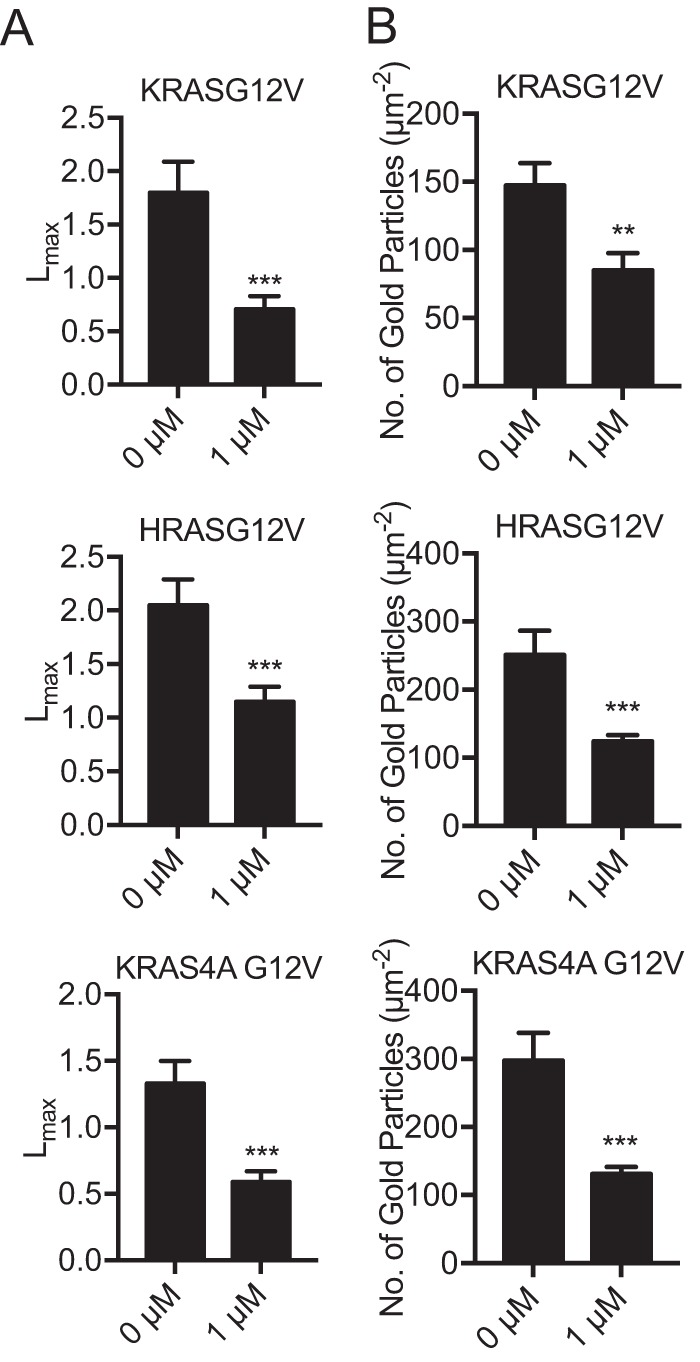
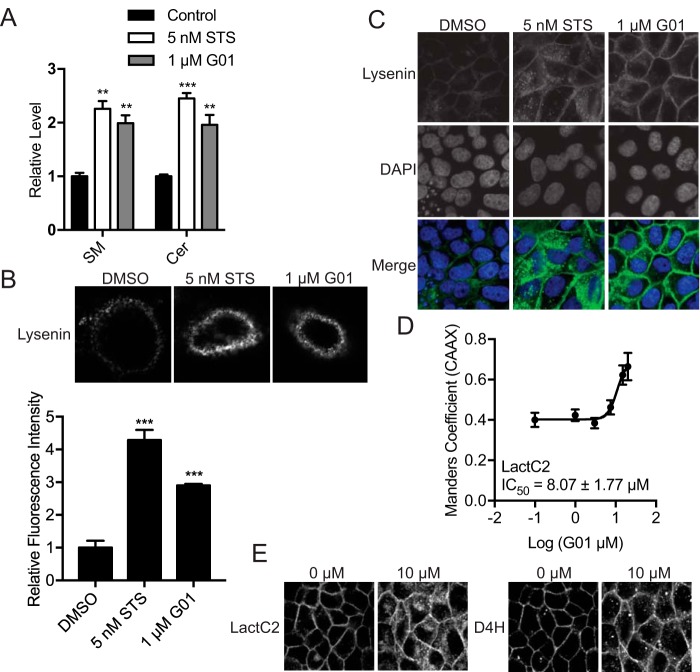
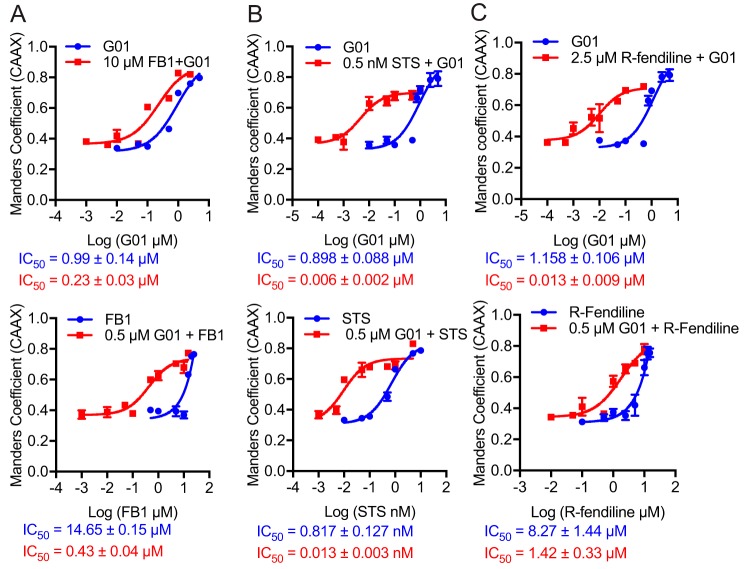
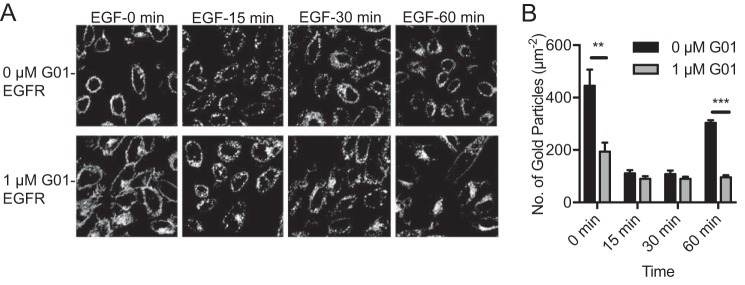
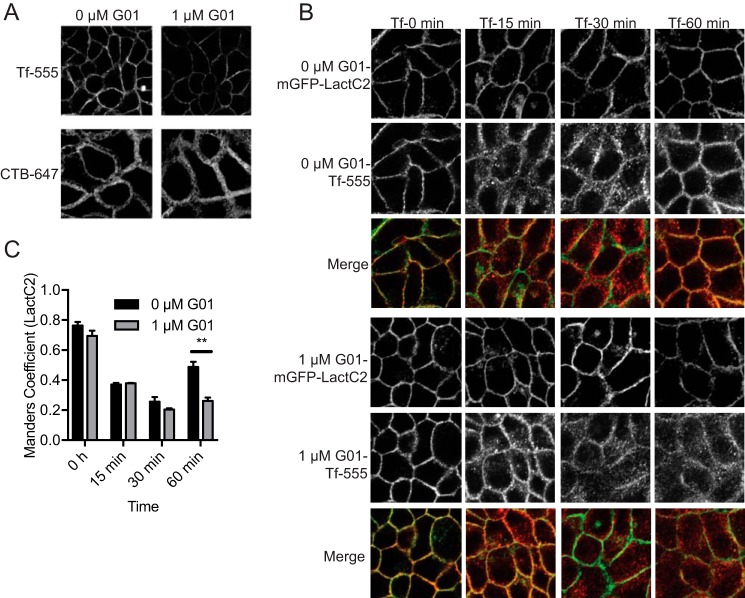
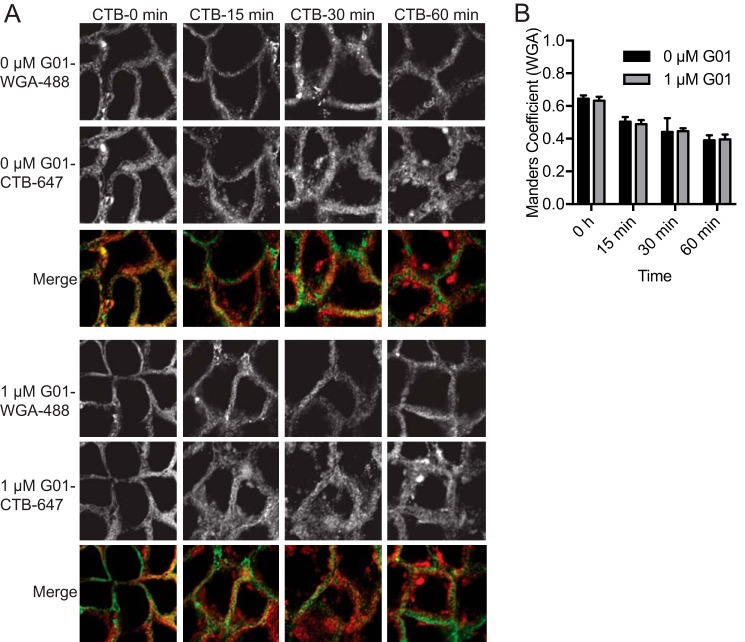
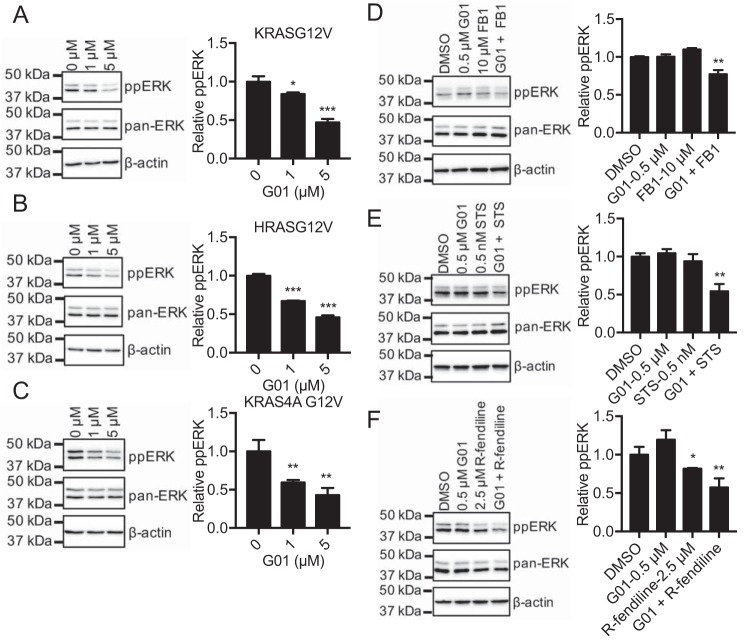
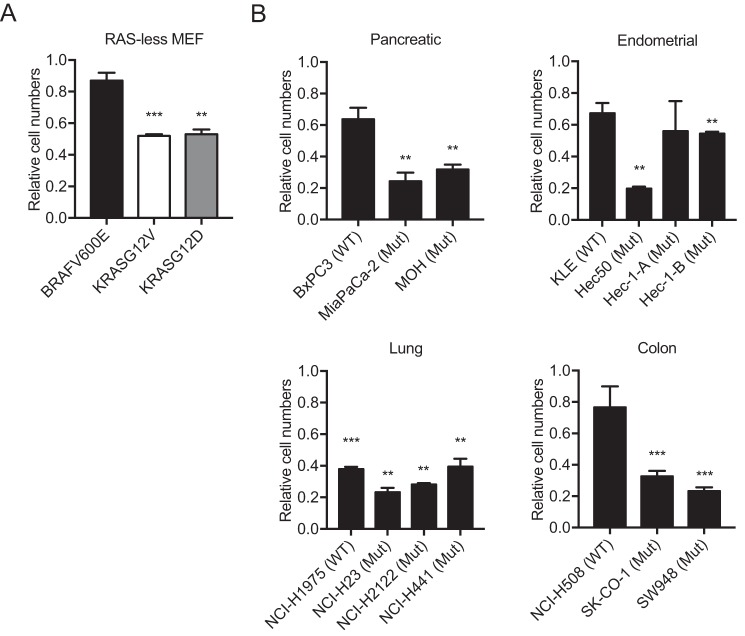
Oncogenic RAS proteins are commonly expressed in human cancer. To be functional, RAS proteins must undergo post-translational modification and localize to the plasma membrane (PM). Therefore, compounds that prevent RAS PM targeting have potential as putative RAS inhibitors. Here we examine the mechanism of action of oxanthroquinone G01 (G01), a recently described inhibitor of KRAS PM localization. We show that G01 mislocalizes HRAS and KRAS from the PM with similar potency and disrupts the spatial organization of RAS proteins remaining on the PM. G01 also inhibited recycling of epidermal growth factor receptor and transferrin receptor, but did not impair internalization of cholera toxin, indicating suppression of recycling endosome function. In searching for the mechanism of impaired endosomal recycling we observed that G01 also enhanced cellular sphingomyelin (SM) and ceramide levels and disrupted the localization of several lipid and cholesterol reporters, suggesting that the G01 molecular target may involve SM metabolism. Indeed, G01 exhibited potent synergy with other compounds that target SM metabolism in KRAS localization assays. Furthermore, G01 significantly abrogated RAS-RAF-MAPK signaling in Madin-Darby canine kidney (MDCK) cells expressing constitutively activated, oncogenic mutant RASG12V. G01 also inhibited the proliferation of RAS-less mouse embryo fibroblasts expressing oncogenic mutant KRASG12V or KRASG12D but not RAS-less mouse embryo fibroblasts expressing oncogenic mutant BRAFV600E. Consistent with these effects, G01 selectively inhibited the proliferation of KRAS-transformed pancreatic, colon, and endometrial cancer cells. Taken together, these results suggest that G01 should undergo further evaluation as a potential anti-RAS therapeutic.

Keywords: GTPase Kras (KRAS); Ras protein; cancer; endosome recycling; oxanthroquinone; plasma membrane; signaling; sphingolipid; sphingomyelin; trafficking.


Conflict of interest statement

The authors declare that they have no conflicts of interest with the contents of this article

Figures

Figure 1.
Figure 1.
Mislocalization of KRASG12V, HRASG12V, KRAS4A G12V from the PM is induced by G01. A, structure of G01. B, MDCK cells stably coexpressing mCherry-CAAX, an endomembrane marker, and mGFP-KRASG12V, mGFP-HRASG12V, or mGFP-KRAS4A G12V were seeded on coverslips and treated with vehicle (DMSO) or G01 for 48 h. Cells were imaged in a confocal microscope. Representative images of vehicle (DMSO), 1 and 5 μm G01 treatments are shown. C, the extent of RAS mislocalization was quantified with Manders coefficients, which evaluate the extent of colocalization of mCherry-CAAX and mGFP-RASG12V. Estimated IC50 values for G01 on each cell line were obtained from the respective Manders coefficient (mean ± S.E., n = 3) dose-response plots.
Figure 2.
Figure 2.
G01 disrupts the PM nanoscale organization of KRASG12V, HRASG12V, and KRAS4A G12V. A, basal PM sheets were generated from MDCK cells stably expressing mGFP-KRASG12V, mGFP-HRASG12V, or mGFP-KRAS4A G12V treated with vehicle (DMSO) or 1 μm G01 for 24 h and imaged by EM after labeling with anti-GFP antibody conjugated to 4.5-nm gold. The extent of clustering of the gold particles was analyzed using Ripley's K-function expressed as L(r) − r functions and normalized on the 99% CI. The maximum value of L(r) − r, defined as Lmax is used as a summary statistic. Values of Lmax above the CI indicates nanoclustering, with the extent of clustering being reflected by the Lmax value. At least 12 PM sheets were evaluated for each condition and RAS isoform. Significant differences from the control pattern for G01-treated cells were assessed using bootstrap tests (***, p < 0.001). B, average mean (± S.E., n ≥ 12) gold labeling density on the PM sheets was calculated and the statistical significance of differences in gold labeling density was evaluated using Student's t test (**, p < 0.01; ***, p < 0.001).
Figure 3.
Figure 3.
SM metabolism is disrupted in G01-treated cells. A, MDCK cells stably expressing mGFP-KRASG12V, or WT MDCK cells were grown in the presence of vehicle (DMSO) or 5 nm STS or 1 μm G01 for 48 h. Whole cell lysates were prepared and total SM and Cer levels were measured. The graph shows SM and Cer levels relative to control, the significance of differences were assessed in one-way ANOVA using the actual mean lipid pmol values (mean ± S.E., n = 3) (**, p < 0.01; ***, p < 0.001). B, WT MDCK cells were treated with G01 for 48 h, stained with mGFP-lysenin, and imaged in a confocal microscope with fixed imaging parameters to assess comparative fluorescent intensities. The PM mGFP fluorescence intensity was quantified using the region of interest tool in ImageJ. The values of fluorescence intensity were normalized to the mean of those in vehicle (DMSO) treated groups (mean ± S.E., n ≥ 20). The statistical significance of differences in relative fluorescence intensity was assessed by one-way ANOVA (***, p < 0.001). C, WT MDCK cells were treated with G01 for 48 h and permeabilized, stained with GFP-lysenin and 4′,6-diamidino-2-phenylindole (DAPI). Cells were imaged in a confocal microscope with fixed imaging parameters. Representative images were shown. D, MDCK cells stably coexpressing mGFP-LactC2 and mCherry-CAAX were treated with G01 for 48 h. Cells were fixed and imaged in a confocal microscope. Colocalization between mGFP-LactC2 and mCherry-CAAX was quantified by Manders coefficients. The IC50 value was estimated from the Manders coefficient (mean ± S.E., n = 3) dose-response plot. E, MDCK cells stably coexpressing mGFP-LactC2 and the cholesterol probe, mCherry-D4H, were treated with G01 for 48 h. Cells were fixed and imaged in a confocal microscope. Representative images are shown.
Figure 4.
Figure 4.
The cocktails of G01 with other compounds are more potent for PM mislocalization of KRAS. A, MDCK cells stably coexpressing mCherry-CAAX and mGFP-KRASG12V were treated with 10 μm FB1 with variable concentrations of G01, or 0.5 μm G01 with variable concentrations of FB1. Cells were fixed and imaged in a confocal microscope. The colocalization between mGFP-LactC2 and mCherry-CAAX was quantified by Manders coefficients (mean ± S.E., n = 3). IC50 values were estimated from the Manders coefficient dose-response plots. B, MDCK cells stably coexpressing mCherry-CAAX and mGFP-KRASG12V were treated with 0.5 nm STS with variable concentrations of G01, or 0.5 μm G01 with variable concentrations of STS. Manders coefficients (mean ± S.E., n = 3) were quantified and IC50 values were estimated. C, MDCK cells stably coexpressing mCherry-CAAX and mGFP-KRASG12V were treated with 2.5 μm R-fendiline with variable concentrations of G01, or 0.5 μm G01 with variable concentrations of R-fendiline. Manders coefficients (mean ± S.E., n = 3) were quantified and IC50 values were estimated.
Figure 5.
Figure 5.
EGFR endosomal recycling is inhibited by G01. A, CHO cells stably expressing mGFP-EGFR were treated with vehicle (DMSO) or 1 μm G01 for 48 h. Cells were serum-starved for 2 h and incubated with 50 ng/ml of EGF on ice for 20 min. Excess EGF was washed away with ice-cold PBS. Cells were then incubated with fresh warm medium with vehicle (DMSO), or 1 μm G01 at 37 °C and fixed at different time points. Cells were imaged in a confocal microscope. Representative images of vehicle (DMSO) and 1 μm G01 were shown. B, in parallel identical experiments PM sheets were generated from the CHO cells under identical conditions as in A, labeled with anti-GFP antibody conjugated to 4.5-nm gold, and imaged by EM. Mean gold density on the PM sheets was determined. The statistical significance of differences in mean (± S.E., n ≥ 12) gold labeling density at each time point was evaluated using Student's t test (**, p < 0.01; ***, p < 0.001).
Figure 6.
Figure 6.
Transferrin receptor endocytic recycling is disrupted by G01. A, WT MDCK or A431 cells were treated with vehicle (DMSO) or 1 μm G01 for 48 h. MDCK and A431 cells were incubated with Tf-555 or CTB-647 on ice, respectively, for 20 min. Excess Tf-555 or CTB-647 was washed away with ice-cold PBS. Cells were fixed and observed under a confocal microscope with fixed imaging parameters to assess comparative fluorescent intensities. Representative images were shown. B, MDCK cells stably expressing mGFP-LactC2 were treated with vehicle (DMSO) or 1 μm G01 for 48 h. Cells were incubated with Tf-555 on ice for 20 min. Excess Tf-555 was washed away with ice-cold PBS. Cells were then incubated with fresh warm medium with vehicle (DMSO) or 1 μm G01 at 37 °C and fixed at different time points. Cells were imaged in a confocal microscope and representative images of vehicle (DMSO), 1 μm G01 are shown. C, images were analyzed using Manders coefficients to quantify the extent of colocalization of mGFP-LactC2 and Tf-555. The statistical significance of differences between mean Manders coefficients (mean ± S.E., n = 3) at each time point was evaluated using Student's t tests (**, p < 0.01).
Figure 7.
Figure 7.
Endocytosis of cholera toxin is unaffected by G01. A, A431 cells were treated with vehicle (DMSO) or 1 μm G01 for 48 h. Cells were incubated with CTB-647 on ice for 20 min. Excess CTB-647 was washed away by ice-cold PBS. Cells were then incubated with fresh warm medium with vehicle (DMSO) or 1 μm G01 at 37 °C and fixed at different time points. Cells were incubated with WGA-488 for 10 min and fixed. Cells were imaged in a confocal microscope and representative images of vehicle (DMSO), 1 μm G01 are shown. B, images were analyzed using Manders coefficients to quantify colocalization of the PM markers, WGA-488 and CTB-647. The statistical significance of differences between mean Manders coefficients (mean ± S.E., n = 3) at each time point was evaluated using Student's t tests.
Figure 8.
Figure 8.
G01 inhibits oncogenic RAS signaling. MDCK cells stably expressing mGFP-KRASG12V (A), mGFP-HRASG12V (B), or mGFP-KRAS4A G12V (C) were treated with vehicle (DMSO) or G01 for 48 h. Levels of ppERK were measured by quantitative immunoblotting and normalized to the total level of ERK. Representative Western blots are shown. The significance of differences between mean (± S.E., n = 3) drug-treated and control ppERK levels were assessed using one-way ANOVA (*, p < 0.05; **, p < 0.01; ***, p < 0.001). MDCK cells stably expressing mGFP-KRASG12V were treated for 48 h with vehicle (DMSO), low dose G01 alone, low dose FB1 alone, or a combination of low dose FB1 with G01 (D), STS alone, or a combination of STS with G01 (E), or low dose R-fendiline alone or a combination of low dose R-fendiline with G01 (F). Levels of ppERK were measured by quantitative immunoblotting and normalized to the total level of ERK. Representative Western blots are shown. The significance of differences between mean (± S.E., n = 3) drug-treated and control ppERK levels were assessed using one-way ANOVA (*, p < 0.05; **, p < 0.01).
Figure 9.
Figure 9.
G01 inhibits the proliferation of oncogenic KRAS-dependent cell lines. A, RAS-less MEF cells rescued by expressing KRASG12V, KRASG12D, or BRAFV600E were seeded in 24-well plates and treated with vehicle (DMSO) or 5 μm G01 for 48 h. The cells were detached and counted. For graphing cell numbers were normalized to the respective mean of number of vehicle (DMSO)-treated cells. The statistical significance of differences in actual cell numbers between control and treated cells (mean ± S.E., n = 3) were evaluated by Student's t (**, p < 0.01; ***, p < 0.001). B, a panel of WT or oncogenic mutant (Mut) KRAS-expressing tumor cells and treated for 72 h with vehicle (DMSO) or 5 μm G01. The cells were detached and counted. For graphing cell numbers were normalized to the respective mean of number of vehicle (DMSO)-treated cells. The statistical significance of differences in actual cell numbers between control and treated cells (mean ± S.E., n = 3) were evaluated by Student's t test (**, p < 0.01; ***, p < 0.001). Results with pancreatic, endometrial, lung, and colon tumor cells are shown, respectively.

Similar articles

Cited by

References

    1. Prior I. A., Lewis P. D., and Mattos C. (2012) A comprehensive survey of Ras mutations in cancer. Cancer Res. 72, 2457–2467 10.1158/0008-5472.CAN-11-2612 - DOI - PMC - PubMed
    1. Cox A. D., Fesik S. W., Kimmelman A. C., Luo J., and Der C. J. (2014) Drugging the undruggable RAS: mission possible? Nat. Rev. Drug Discov. 13, 828–851 10.1038/nrd4389 - DOI - PMC - PubMed
    1. Prior I. A., and Hancock J. F. (2012) Ras trafficking, localization and compartmentalized signalling. Semin. Cell Dev. Biol. 23, 145–153 10.1016/j.semcdb.2011.09.002 - DOI - PMC - PubMed
    1. Zhou Y., and Hancock J. F. (2015) Ras nanoclusters: Versatile lipid-based signaling platforms. Biochim. Biophys. Acta 1853, 841–849 10.1016/j.bbamcr.2014.09.008 - DOI - PubMed
    1. Hancock J. F. (2003) Ras proteins: different signals from different locations. Nat. Rev. Mol. Cell Biol. 4, 373–384 10.1038/nrm1105 - DOI - PubMed

Publication types