. 2018 Jul 3;9(7):737.
doi: 10.1038/s41419-018-0712-9.

Pyruvate kinase M2 isoform deletion in cone photoreceptors results in age-related cone degeneration

Affiliations

Pyruvate kinase M2 isoform deletion in cone photoreceptors results in age-related cone degeneration

Ammaji Rajala et al. Cell Death Dis. .

Abstract

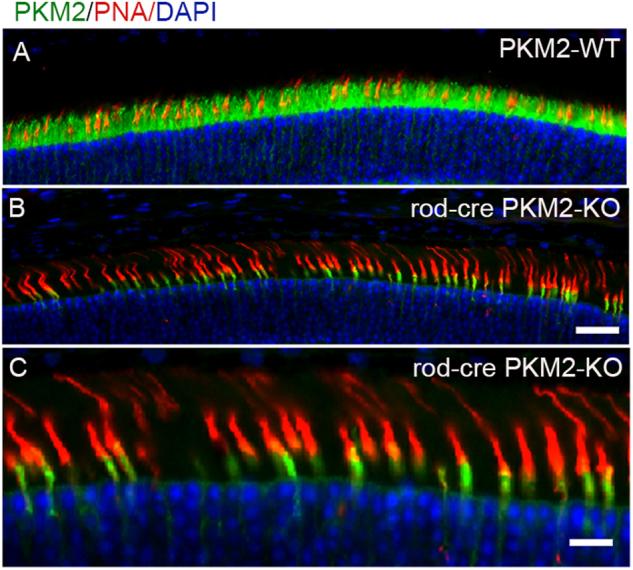
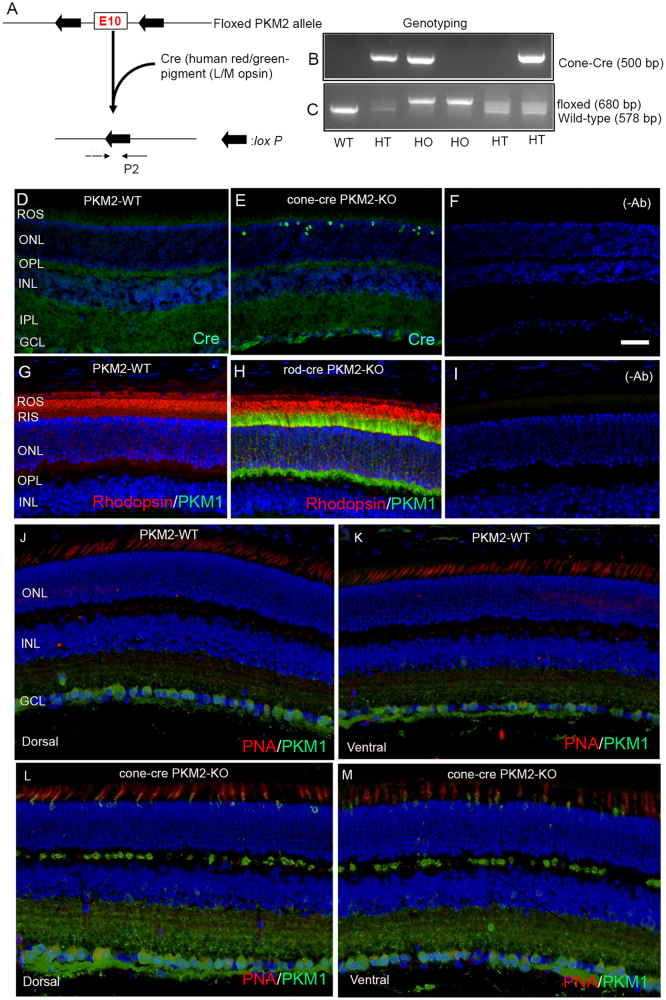
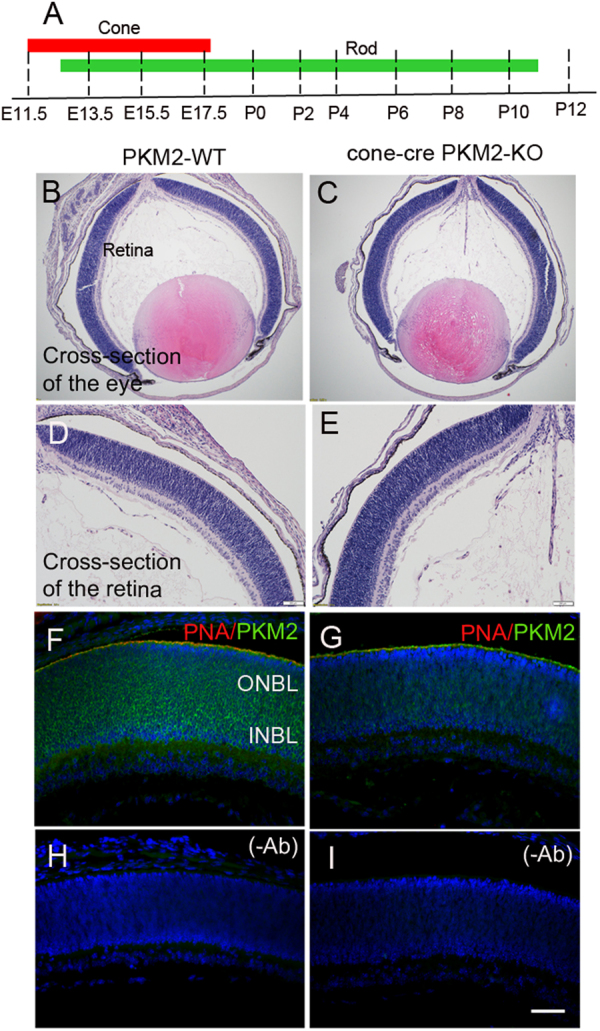
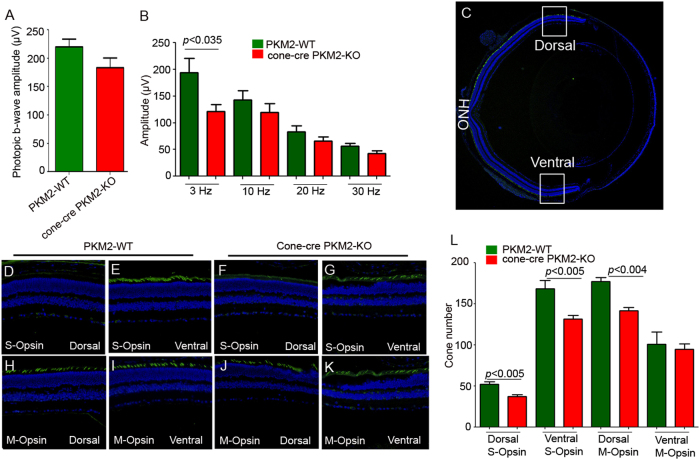
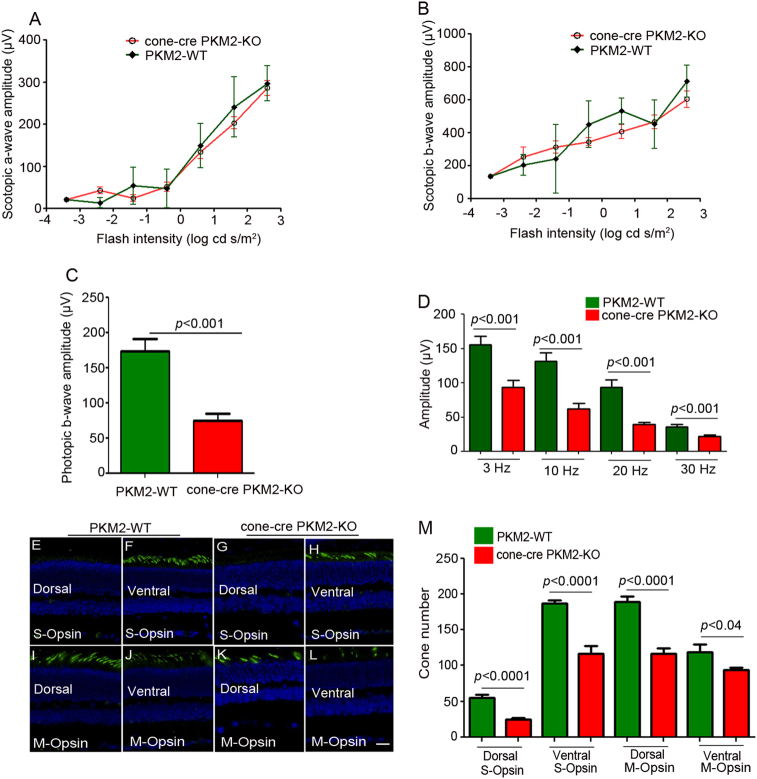
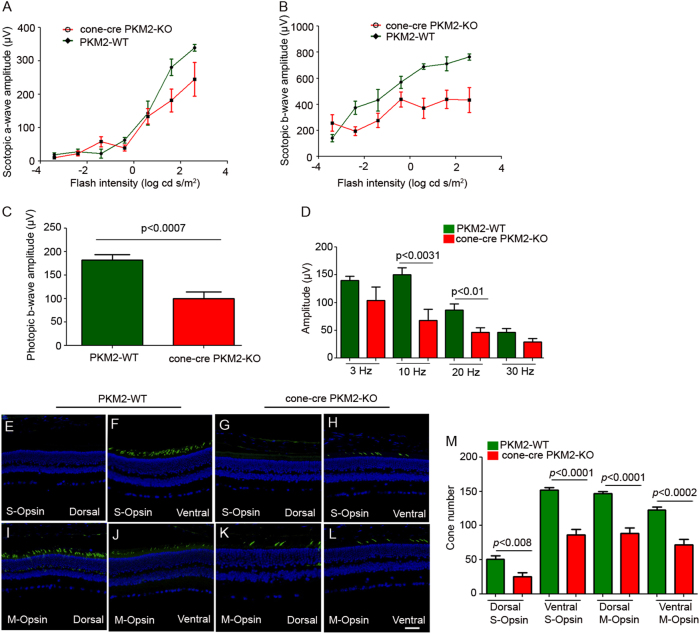
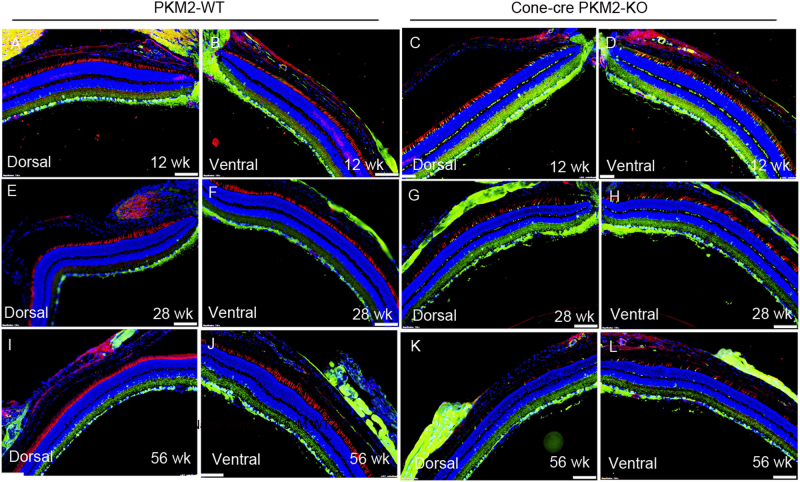
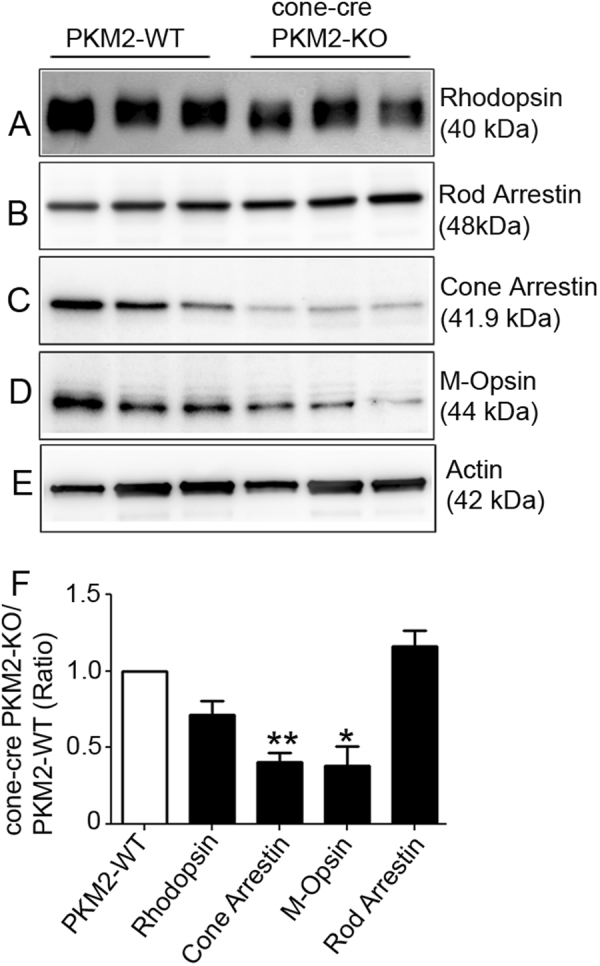
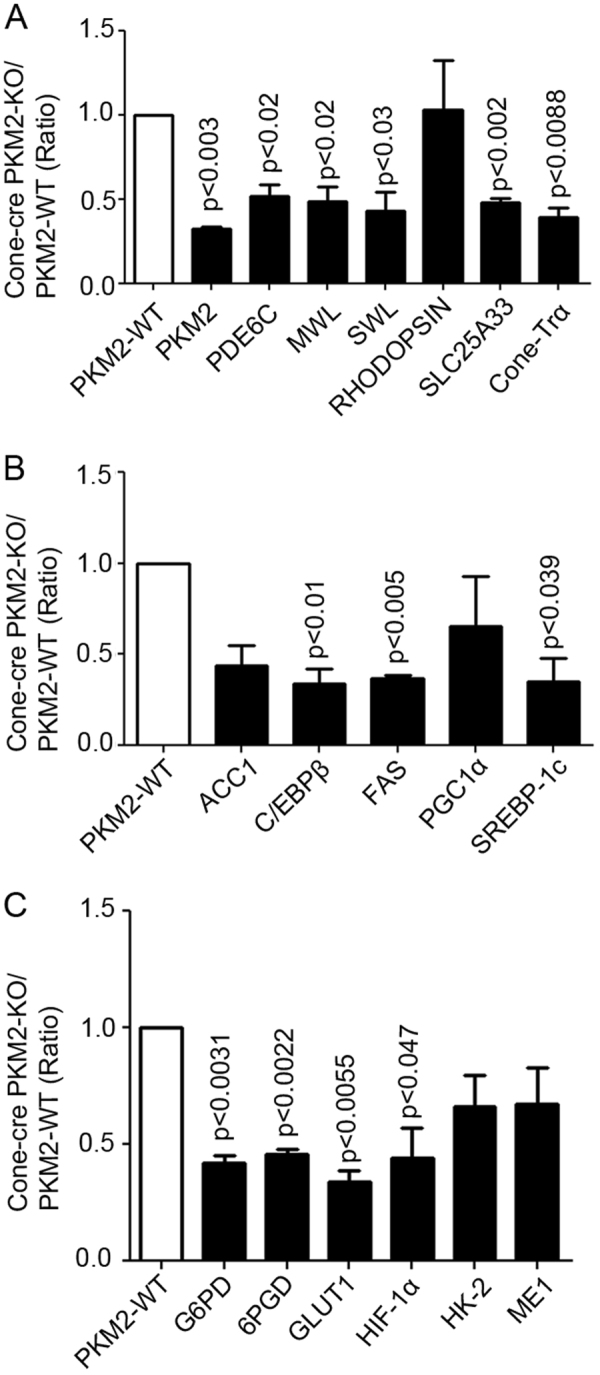
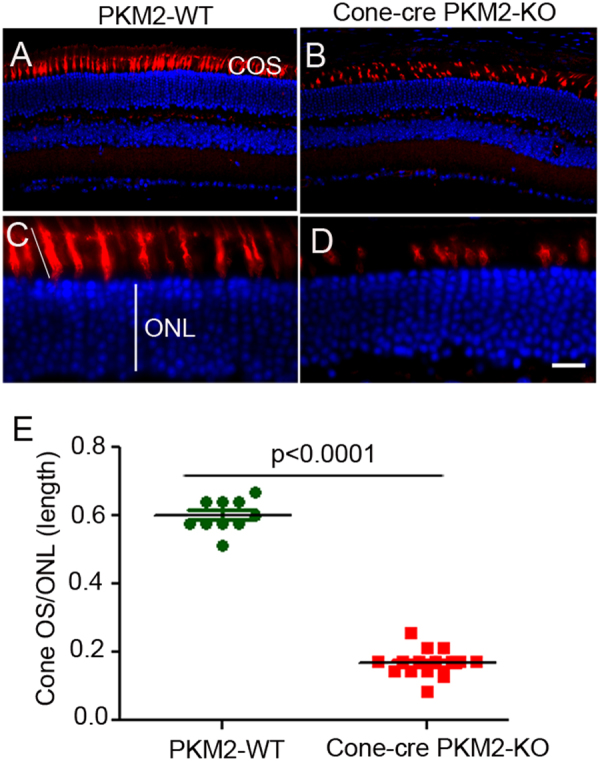
The tumor form of pyruvate kinase M2 has been suggested to promote cellular anabolism by redirecting the metabolism to cause accumulation of glycolytic intermediates and increasing flux through the pentose phosphate pathway, which is a metabolic pathway parallel to glycolysis. Both rod and cone photoreceptors express the tumor form of pyruvate kinase M2. Recent studies from our laboratory show that PKM2 is functionally important for rod photoreceptor structure, function, and viability. However, the functional role of PKM2 in cones is not known. In this study, we conditionally deleted PKM2 in cones (cone-cre PKM2-KO) and found that loss of PKM2 results in the upregulation of PKM1 and a significant loss of cone function and cone degeneration in an age-dependent manner. Gene expression studies on cone-cre PKM2-KO show decreased expression of genes regulating glycolysis, PPP shunt, and fatty acid biosynthesis. Consistent with these observations, cones lacking PKM2 have significantly shorter cone outer segments than cones with PKM2. Our studies clearly suggest that PKM2 is essential for the anabolic process in cones to keep them alive for normal functioning and to support cone structure.


Conflict of interest statement

The authors declare that they have no conflict of interest.

Figures

Fig. 1
Fig. 1. Immunofluorescence analysis of PKM2 in wild-type and rod-cre PKM2-KO mice.
Prefer-fixed sections of PKM2-WT (a) and rod-cre PKM2-KO (b) mouse retinas were subjected to immunofluorescence with anti-PKM2 (green) and anti-PNA (red) antibodies. Panel (c) is an enlarged image of (b) showing PKM2 expression in cones. Scale bar = 50 μm (a, b) and 20 μm for panel (c)
Fig. 2
Fig. 2. Generation of cone-conditional PKM2-KO mice.
Schematic diagram of loxP floxed PKM2 loci. Cone photoreceptor-specific PKM2 KO mice were generated by breeding mice with an exon 10 floxed PKM gene with mice that express Cre recombinase under the control of human red/green pigment promoter (a). Primer pairs P1 and P2 were used to identify the wild-type, cone-Cre, and the floxed PKM2 alleles (b, c). Cryosections were prepared from PKM2-WT and cone-cre-PKM2-KO mouse retinas and were immunostained with an anti-Cre antibody (d, e). Prefer-fixed sections of 8-week-old PKM2-WT (g) and rod-cre PKM2-KO (h) mouse retinas were subjected to immunofluorescence with anti-rhodopsin (red) and PKM1 (green) antibodies. Prefer-fixed sections of 12-week-old PKM2-WT (j, k) and cone-cre PKM2-KO (l, m) mouse retains were stained with PNA (red) and PKM1 (green) antibodies, and images were captured on both dorsal and ventral regions of the retina. Panels (f) and (i) represent the omission of primiary antibody. ROS rod outer segments, RIS rod inner segments, ONL outer nuclear layer, OPL outer plexiform layer, INL inner nuclear layer, IPL inner plexiform layer, GCL ganglion cell layer. Scale bar = 50 μm
Fig. 3
Fig. 3. Expression of PKM2 in the developmental retina.
Developmental scheme of cone and rod photoreceptors showing that cone development precedes rod development (a). After euthanization, whole P0 mouse heads were harvested, cut in half with one eye on each side, and were subjected to prefer-fixation followed by paraffin embedding. Genotyping was performed on mouse tail DNA to distinguish cone-cre PKM2-KO mice from PKM2-WT mice, as described in Methods. Sections were prepared from PKM2-WT (b, d) and cone-cre-PKM2-KO (c, e) mice and stained with hematoxylin and eosin. Panels (b) and (c) show the cross-section of the eye. Panels (d) and (e) show the cross-section of the retina. Immunohistochemistry was performed on PKM2-WT (f) and cone-cre PKM2-KO (g) retina sections with PNA (red) and PKM2 (green). Panels (h) and (i) represent the omission of primary antibodies. ONBL outer neuroblastic layer, INBL inner neuroblastic layer. Scale bar = 50 μm
Fig. 4
Fig. 4. The function and structure of the 12-week-old cone-cre PKM2-KO mouse retina.
Cone function (photopic b-wave) and cone flicker electroretinographic analysis were performed on 12-week-old PKM2-WT and cone-cre PKM2-KO mice. Photopic b-wave amplitudes were performed at a flash intensity of 3.3 log cd s/m2 (a). Isolated cone photoreceptor components of the photopic flicker ERG were done at 3, 10, 20, and 30 Hz (b). Panel (c) represents staining of the retina with M-opsin (green) and nuclei (blue) on a section of PKM2-WT retina at 12 weeks (Scale bar = 100 μm). Higher expression of M-opsin dorsally than ventrally. Panels (dk) represent the difference of expression of S-opsin (S-opsin positive cones) and M-opsin (M-opsin positive cones) in dorsal and ventral regions of the retina from 12-week-old PKM2-WT and cone-cre PKM2-KO mice. Panel (l) represents the quantification of the number of cones in dorsal and ventral regions of the retina counted starting from the optic nerve head (ONH). Data are mean ± SEM (n=6). Significance, if any, is indicated on each panel. The images shown are representative of six retinas examined from PKM2-WT and cone-cre PKM2-KO mice
Fig. 5
Fig. 5. The function and structure of the 28-week-old cone-cre PKM2-KO mouse retina.
Scotopic a-wave (a), scotopic b-wave (b), photopic b-wave (c), and cone flicker (d) electroretinographic analysis was performed on 28-week-old PKM2-WT and cone-cre PKM2-KO mice. Scotopic a-wave and scotopic b-wave amplitudes were carried out at different flash intensities (−3.4, −2.4, −1.4, −0.4, 0.6, 1.6, and 2.6 log cd s/m2), whereas photopic b-wave amplitudes were performed at a flash intensity of 3.3 log cd s/m2. Isolated cone photoreceptor components of the photopic flicker ERG were done at 3, 10, 20, and 30 Hz. Data are mean ± SEM (n = 13). Significance, if any, is indicated on each panel. Panels (el) represent the difference of expression of S-opsin (S-opsin positive cones) and M-opsin (M-opsin positive cones) in dorsal and ventral regions of the retina from 28-week-old PKM2-WT and cone-cre PKM2-KO mice. Panel (m) represents the quantification of the number of cones in dorsal and ventral regions of the retina counted starting from the optic nerve head (ONH). Data are mean ± SEM (n = 8). Significance, if any, is indicated on each panel. Scale bar = 50 μm. The images shown are representative of six retinas examined from PKM2-WT and cone-cre PKM2-KO mice
Fig. 6
Fig. 6. The function and structure of the 56-week-old cone-cre PKM2-KO mouse retina.
Scotopic a-wave (a), scotopic b-wave (b), photopic b-wave (c), and cone flicker (d) electroretinographic analysis was performed on 56-week-old PKM2-WT and cone-cre PKM2-KO mice. Scotopic a-wave and scotopic b-wave amplitudes were carried out at different flash intensities (−3.4, −2.4, −1.4, −0.4, 0.6, 1.6, and 2.6 log cd s/m2), whereas photopic b-wave amplitudes were performed at a flash intensity of 3.3 log cd s/m2. Isolated cone photoreceptor components of the photopic flicker ERG were done at 3, 10, 20, and 30 Hz. Data are mean ± SEM (n=13). Significance, if any, is indicated on each panel. Panels (el) represent the difference of expression of S-opsin (S-opsin positive cones) and M-opsin (M-opsin positive cones) in dorsal and ventral regions of the retina from 56-week-old PKM2-WT and cone-cre PKM2-KO mice. Panel (m) represents the quantification of the number of cones in dorsal and ventral regions of the retina counted starting from the optic nerve head (ONH). Data are mean ± SEM (n = 8). Significance, if any, is indicated on each panel. Scale bar = 50 μm. The images shown are representative of six retinas examined from PKM2-WT and cone-cre PKM2-KO mice
Fig. 7
Fig. 7. Cone photoreceptor integrity in cone-cre PKM2-KO mice.
Prefer-fixed sections of 12-week-old, 28-week-old, and 56-week-old PKM2-WT (a, b, e, f, i, j) and cone-cre PKM2-KO (c, d, g, h, k, l) mouse retinas were subjected to immunofluorescence with anti-PNA (red) and anti-PKM1 (green) antibodies. Images were captured from dorsal and ventral regions of the retina. The images shown are representative of five retinas examined from PKM2-WT and cone-cre PKM2-KO mice. Scale bar = 100 μm
Fig. 8
Fig. 8. Expression levels of PKM2 and photoreceptor-specific proteins in PKM2-WT and cone-cre PKM2-KO mice.
Retinal homogenates (5.0 µg protein) from three independent PKM2-WT and cone-cre PKM2-KO mice were subjected to immunoblot analysis with anti-rhodopsin (a), anti-rod arrestin (b), anti-cone arrestin (c), anti-M-opsin (d), and anti-actin (e) antibodies. We normalized the protein expression to rod arrestin (f) and then calculated the ratios (cone-cre PKM2-KO/PKM2-WT). Data are mean ± SEM (n = 3). **p < 0.01, *p < 0.03. The molecular weight of each protein is indicated in the parentheses
Fig. 9
Fig. 9. Expression of the photoreceptor, fatty acid biosynthetic, glycolytic, and pentose phosphate pathway-regulated gene expression in cone-cre PKM2-KO mice.
Equal amounts of retinal total RNA reverse transcribed to cDNA from three independent PKM2-WT and cone-cre PKM2-KO mice were used for real-time (RT)-PCR and were normalized to 18 S rRNA levels and ratios were calculated (cone-cre PKM2-KO/PKM2-WT). Data are mean ± SEM (n=3). Significance, if any, is indicated on each panel. Panel (a) represents the expression of rod photoreceptor, cone photoreceptor, and mitochondrial genes in cone-cre PKM2 KO mice. Panel (b) represents the expression of fatty acid biosynthetic genes, whereas panel (c) represents the expression of pentose phosphate pathway-regulated genes in cone-cre PKM2 KO mice. MWL medium wavelength opsin, SWL short wavelength opsin
Fig. 10
Fig. 10. Shortening of cone outer segment length in cone-cre PKM2-KO mice.
Prefer-fixed sections of PKM2-WT (a) and cone-cre PKM2-KO (b) mouse retinas were subjected to immunofluorescence with the anti-PNA antibody. The sections were imaged at ×20 (a, b), and ×60 (c, d, scale bar = 20 µm). Using a ruler, the length of cone photoreceptors and outer nuclear layer (ONL) were measured, and the cone outer segment length was normalized to ONL thickness (e). Data are mean ± SEM (n=16). Significance was indicated in the panel

Similar articles

Cited by

References

    1. Bok D. Retinal photoreceptor-pigment epithelium interactions. Friedenwald lecture. Invest Ophthalmol. Vis. Sci. 1985;26:1659–1694. - PubMed
    1. Iqbal MA, et al. Insulin enhances metabolic capacities of cancer cells by dual regulation of glycolytic enzyme pyruvate kinase M2. Mol. Cancer. 2013;12:72. doi: 10.1186/1476-4598-12-72. - DOI - PMC - PubMed
    1. Gruning NM, et al. Pyruvate kinase triggers a metabolic feedback loop that controls redox metabolism in respiring cells. Cell. Metab. 2011;14:415–427. doi: 10.1016/j.cmet.2011.06.017. - DOI - PMC - PubMed
    1. Rajala A, et al. Pyruvate kinase M2 regulates photoreceptor structure, function, and viability. Cell Death Dis. 2018;9:240. doi: 10.1038/s41419-018-0296-4. - DOI - PMC - PubMed
    1. Ivanovic I, et al. Deletion of the p85alpha regulatory subunit of phosphoinositide 3-kinase in cone photoreceptor cells results in cone photoreceptor degeneration. Invest. Ophthalmol. Vis. Sci. 2011;52:3775–3783. doi: 10.1167/iovs.10-7139. - DOI - PMC - PubMed

Publication types