. 2018 Jul 3;9(1):2509.
doi: 10.1038/s41467-018-04860-y.

Dynamic strain determination using fibre-optic cables allows imaging of seismological and structural features

Affiliations

Dynamic strain determination using fibre-optic cables allows imaging of seismological and structural features

Philippe Jousset et al. Nat Commun. .

Abstract

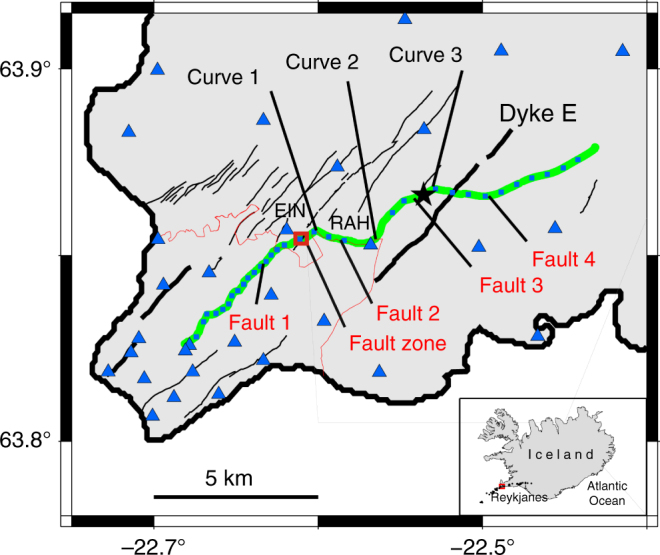
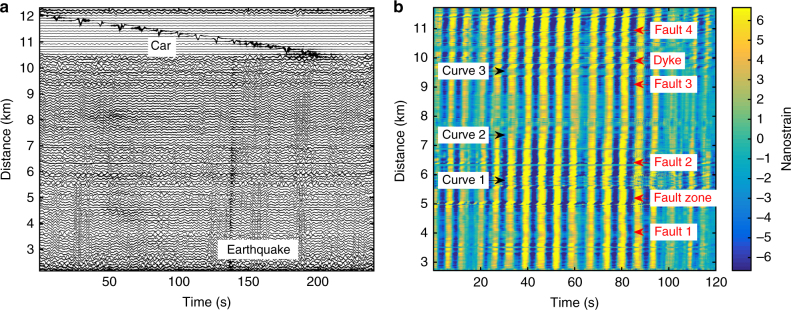
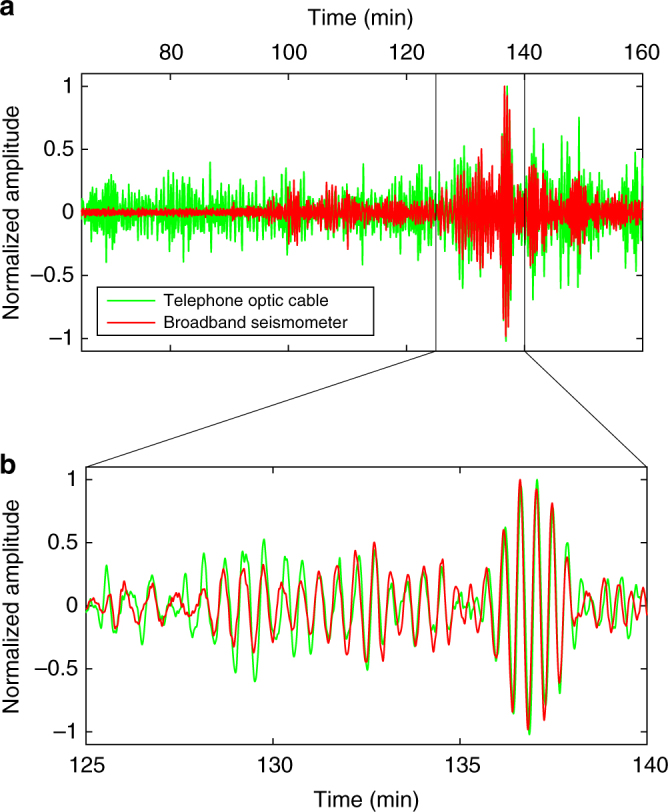
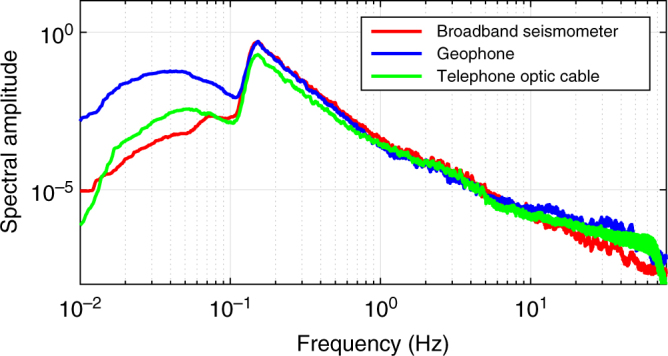
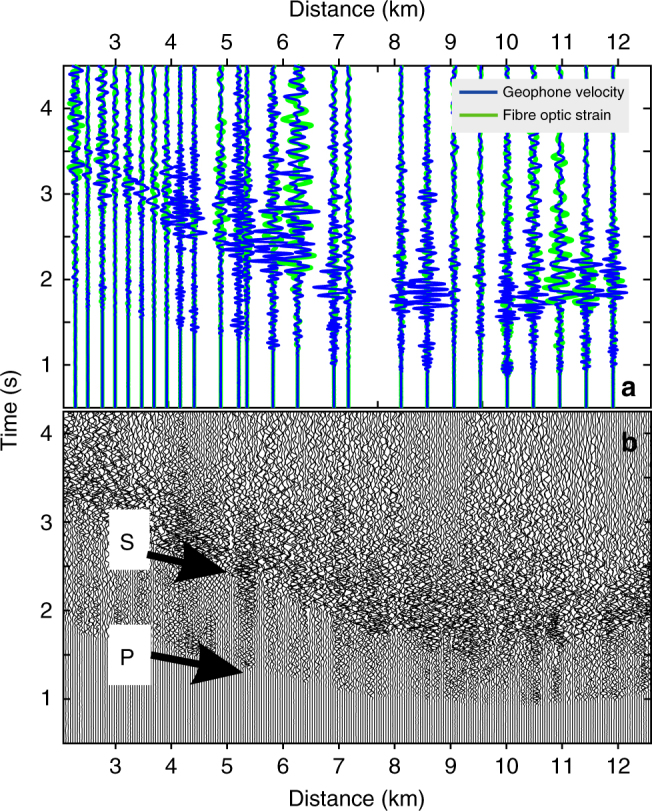
Natural hazard prediction and efficient crust exploration require dense seismic observations both in time and space. Seismological techniques provide ground-motion data, whose accuracy depends on sensor characteristics and spatial distribution. Here we demonstrate that dynamic strain determination is possible with conventional fibre-optic cables deployed for telecommunication. Extending recently distributed acoustic sensing (DAS) studies, we present high resolution spatially un-aliased broadband strain data. We recorded seismic signals from natural and man-made sources with 4-m spacing along a 15-km-long fibre-optic cable layout on Reykjanes Peninsula, SW-Iceland. We identify with unprecedented resolution structural features such as normal faults and volcanic dykes in the Reykjanes Oblique Rift, allowing us to infer new dynamic fault processes. Conventional seismometer recordings, acquired simultaneously, validate the spectral amplitude DAS response between 0.1 and 100 Hz bandwidth. We suggest that the networks of fibre-optic telecommunication lines worldwide could be used as seismometers opening a new window for Earth hazard assessment and exploration.


Conflict of interest statement

The authors declare no competing interests.

Figures

Fig. 1
Fig. 1
Location of the fibre-optic cable in Reykjanes and main geological features. Location of the fibre-optic cable (continuous green line) from the telecommunication network (Míla Company) used for our measurements within the Reykjanes fissure swarm (black lines). Small light blue squares along the fibre-optic cable represent geophones. Blue triangles indicate broadband seismological stations from the European Project IMAGE (Integrated Methods for Advanced Geothermal Exploration) network,. RAH and EIN are the closest broadband stations to the optical cable. The thick black lines indicate a series of cones and postglacial craters, from the latest eruptive episode in Reykjanes in 1210–1240 (e.g. Dyke E = Eldvörp crater row). The black star indicates a local earthquake epicentre (depth ~3.5 km). The thin red curve indicates the limit of the Sh = Sandfellshæð lava shield (most recent lava flow), hiding most of the faults at the surface of the tip of the Peninsula. The inset represents the location of the area in Iceland (North Atlantic), with black dots being epicentres of 68 earthquakes (Supplementary Table 1) recorded during the 9 days of our optical DAS records
Fig. 2
Fig. 2
DAS records. a 4 min of strain signal (17 March 2015, 12:33–12:37). Only selected normalized traces (one trace out of 25, i.e. one trace every 100 m, frequency range 0.01–100 Hz) are shown. A local earthquake is revealed by higher frequencies in the signal from 135 to 140 s. Coherent oscillations of 5–6 s period correspond to ocean-driven micro-seism. Traces between 10.5 and 11.6 km with large amplitude signals correspond to a car travelling on the road along the cable (Methods: Shallow sub-surface crustal properties determination). b 2 min of strain record (19.03.2015, 15:27 UTC) showing micro-seism (4–6 s period) propagating from the south coast northwards along the cable. Beamforming computation (from the DAS record) indicates a source in the Atlantic Ocean, SW of Iceland. Changes in cable direction along the road (black labels) induce a change in the incidence angle of the micro-seism waves, and therefore amplitude change. Amplitudes and phases are disturbed at specific locations (indicated by the red labels), which correspond to geological features such as faults or volcanic dykes (Fig. 1)
Fig. 3
Fig. 3
Record of a teleseism earthquake with DAS. a Normalized strain (green curve) recorded during an Mb ~6.2 (USGS) earthquake (Kota Ternate, Indonesia, 2015-03-17 22:12:28 UTC, 1.669°N; 126.522°E, 44 km depth) superimposed with the normalized velocity record (red curve) from the broadband station RAH (80 m from the optical cable). Data are filtered between 16 and 50 s corresponding to highest amplitudes for surface waves of remote earthquakes. b Zoom from a showing good phase correspondence between seismometer velocity record and DAS strain records at 20 s period
Fig. 4
Fig. 4
DAS record conversion to seismic data. True amplitude spectra of displacements of 1 h (20.03.2015 5:00-06:00) noise record for DAS (green), geophone (natural frequency of 4.5 Hz, blue) and broadband (flat amplitude response between 0.008 and 100 Hz, red) records, respectively, after instrumental corrections (Methods: Instrumental correction of records from the iDAS system)
Fig. 5
Fig. 5
Records of a local earthquake. a Geophone record (blue) of an Ml ~1.2 local earthquake (23.03.2015, 16:07:08.5 U.T.C.—Iceland Meteorological Office) and fibre-optic (green) record at the corresponding locations of the geophone. b DAS record of the same earthquake as in a
Fig. 6
Fig. 6
Exploration studies using conventional seismological methods and a fibre-optic telecommunication line. a P- and S-waves’ travel times automatically picked along the profile: each symbol represents a P- (black star) and S- (grey dots) arrival times on the DAS records. The white squares with black dot and the white circle with black dot correspond to P- and S-wave travel times, respectively, picked on the geophone records with the same automatic picker. The continuous grey (black) lines correspond to theoretical arrival times for the inverted hypocentre using P- and S-wave picks from the cable (respectively). b Observed Vp/Vs ratio computed at all traces and compared with the results obtained from the travel time tomography (green dots) obtained from more than 2000 local earthquakes over 1.5 years. The black line corresponds to the polynomial (Savitsky–Golay) smoothing filter of order 5 with size frame ~3 km long through the fibre-optic Vp/Vs individual values
Fig. 7
Fig. 7
Structure of a fault damage zone within an active geological rift. a The road and the cable (distance ~5 km) cross several faults, e.g. a clearly visible fault zone with more loose material in the field (between 5.04 and 5.09 km). b The fault damage zone is visible by the ~50–60 m wide depression area (picture taken at ~100 m SW of the road, looking towards SW). Note that at the cable location no depression area is visible. The depression is only the surface expression at the position of the picture (Picture Martin Lipus, GFZ). c Short record (6 s) of strain phases from a local earthquake (Fig. 5) trapped in the fault damage zone. Phases are reflected until ~4.98 km, which may indicate a hidden fault with surface expression. Waves inside and outside the fault zone have different apparent velocities
Fig. 8
Fig. 8
Dynamics of a fault damage zone within an active geological rift. a Extensive record (400 s) of strain observed in the vicinity of the damage fault zone, from 100 s before, during and 300 s after the earthquake (Figs. 6 and 7). Sudden strain steps (black arrows indicated at the time 0) occur over several neighbouring traces simultaneously to the waves of the earthquake. Strain remains with the same value for at least 300 s, possibly more. The location of the steps correspond to locations of geological features observed in the field, e.g. faults. b Displacement computed by spatial integration at selected traces along the same section of the cable as in Fig. 7a and c. The displacement is directly obtained from the spatial integration of the strain in a over a 60-m-long sliding window. Eq: earthquake

References

    1. Sigmundsson F, et al. Segmented lateral dyke growth in a rifting event at Bárðarbunga volcanic system, Iceland. Nature. 2015;517:191–195. doi: 10.1038/nature14111. - DOI - PubMed
    1. Witze A. Volcano risk quantified. Nature. 2015;519:16–17. doi: 10.1038/519016a. - DOI - PubMed
    1. Harris, R. H. Large earthquakes and creeping faults. Rev. Geophys. 55, 169–198 (2017).
    1. Budd, G. Efficient interpretation. New Technol. Mag. 1–2 (2010).
    1. Yatman G, Üzumcü S, Pahsa A, Mert AA. Intrusion detection sensors used by electronic security systems for critical facilities and infrastructures: a review. WIT Trans. Built Environ. 2015;151:131–141. doi: 10.2495/SAFE150121. - DOI

Publication types