. 2018 Jun 22:12:1837-1853.
doi: 10.2147/DDDT.S162950. eCollection 2018.

Salidroside ameliorates autophagy and activation of hepatic stellate cells in mice via NF-κB and TGF-β1/Smad3 pathways

Affiliations

Salidroside ameliorates autophagy and activation of hepatic stellate cells in mice via NF-κB and TGF-β1/Smad3 pathways

Jiao Feng et al. Drug Des Devel Ther. .

Abstract

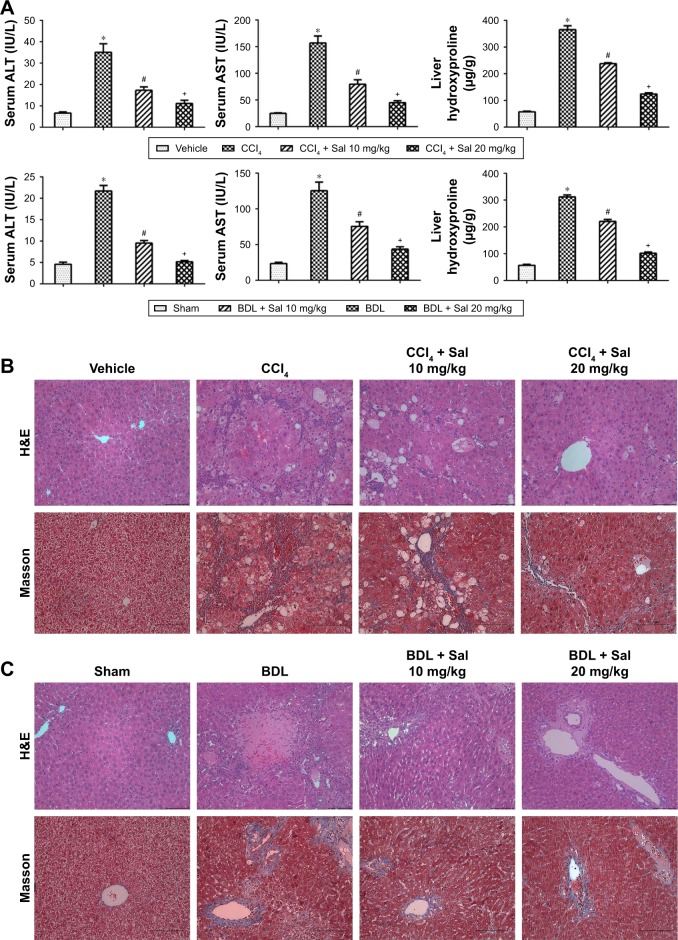
Purpose: Liver fibrosis is commonly seen and a necessary stage in chronic liver disease. The aim of this study was to explore the effect of salidroside on liver fibrosis in mice and its potential mechanisms.

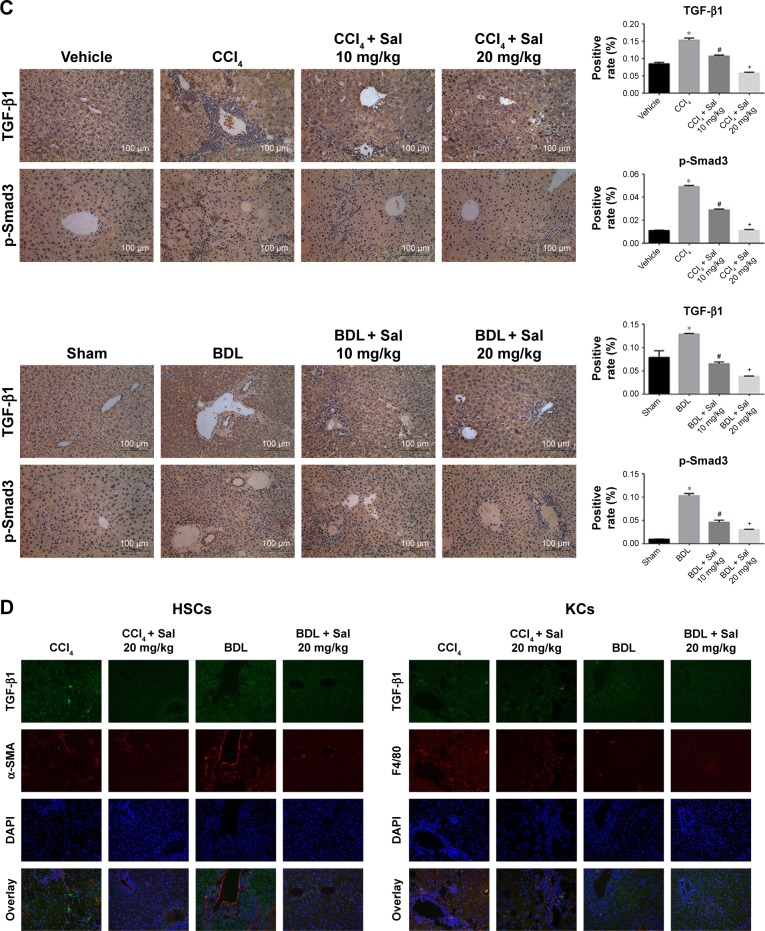
Materials and methods: Two mouse liver fibrosis models were established by intraperitoneal injection of carbon tetrachloride (CCl4) for 8 weeks and bile duct ligation for 14 days. Salidroside was injected intraperitoneally at doses of 10 and 20 mg/kg once a day. Gene and protein expression levels were determined by quantitative real-time polymerase chain reaction, enzyme-linked immunosorbent assay, Western blot, immunohistochemistry, and immunofluorescence.

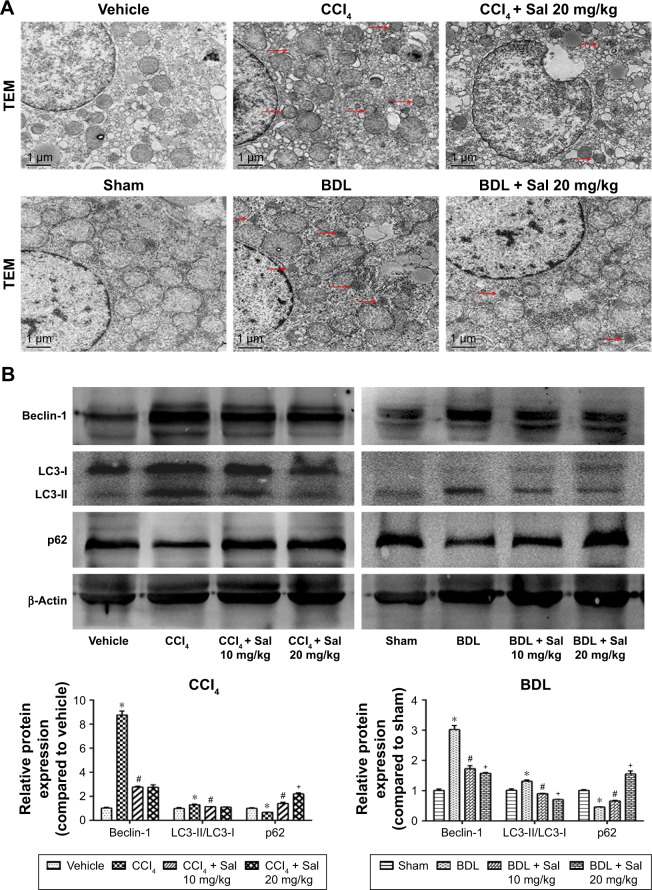
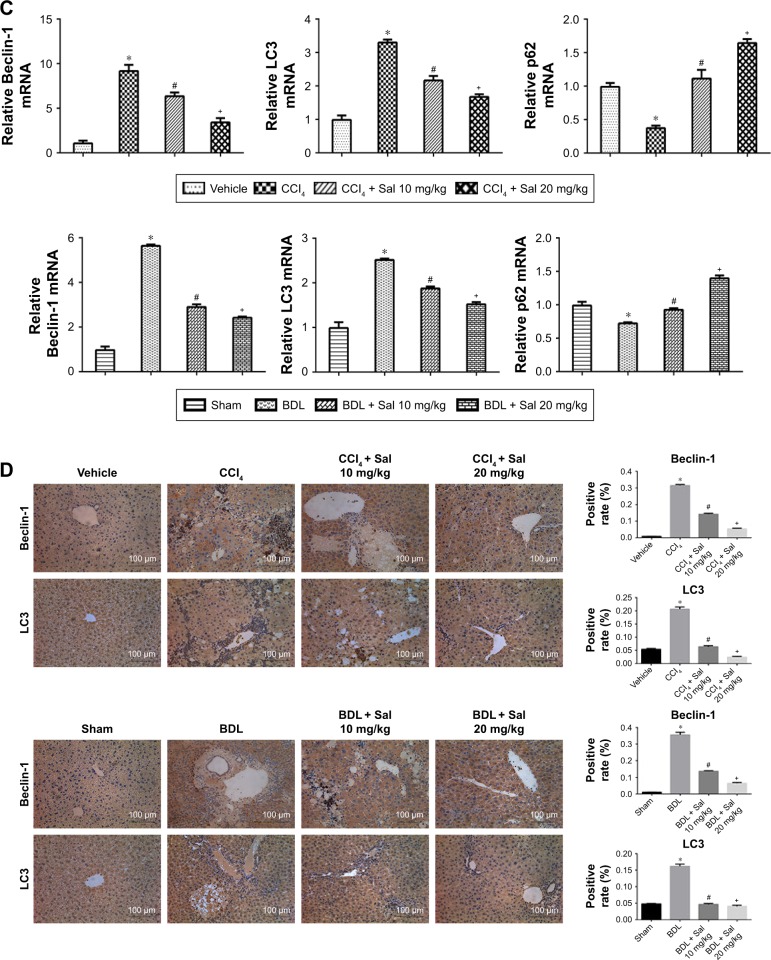
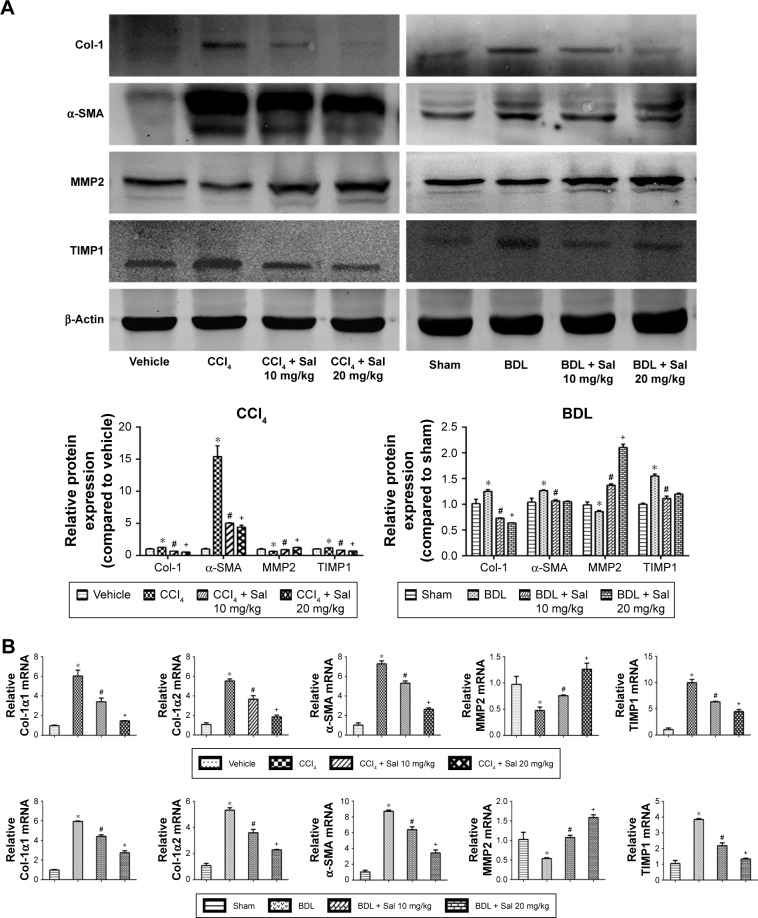
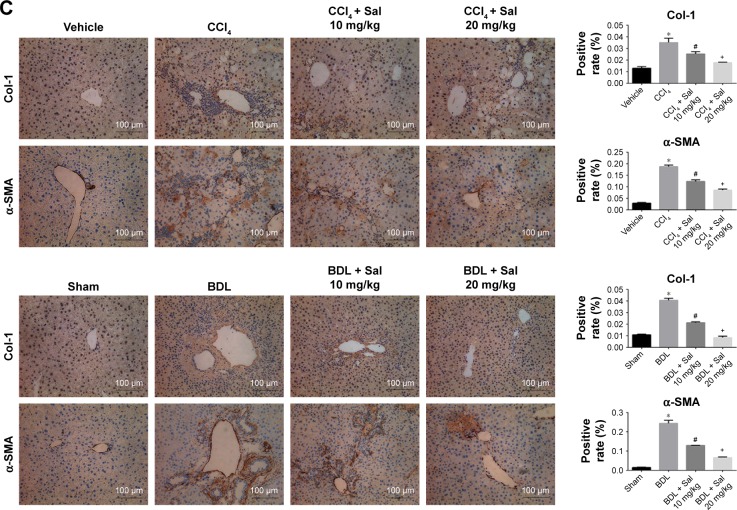
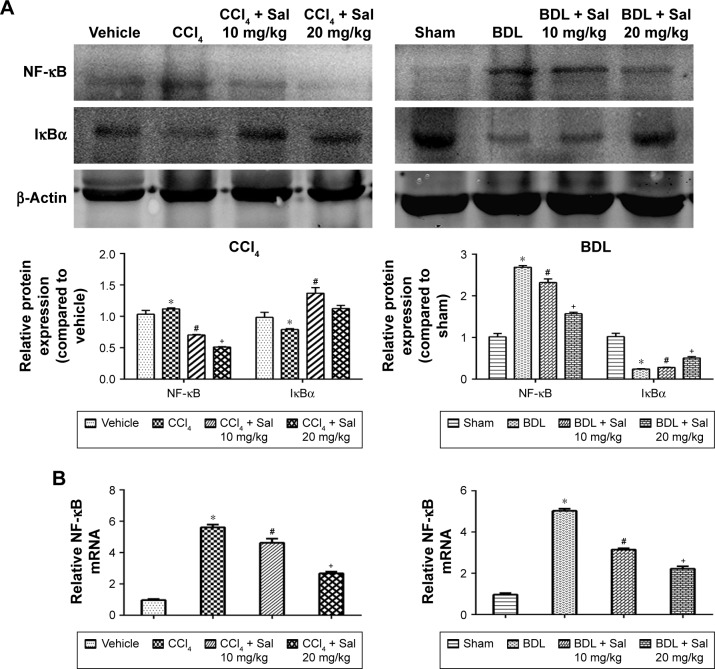
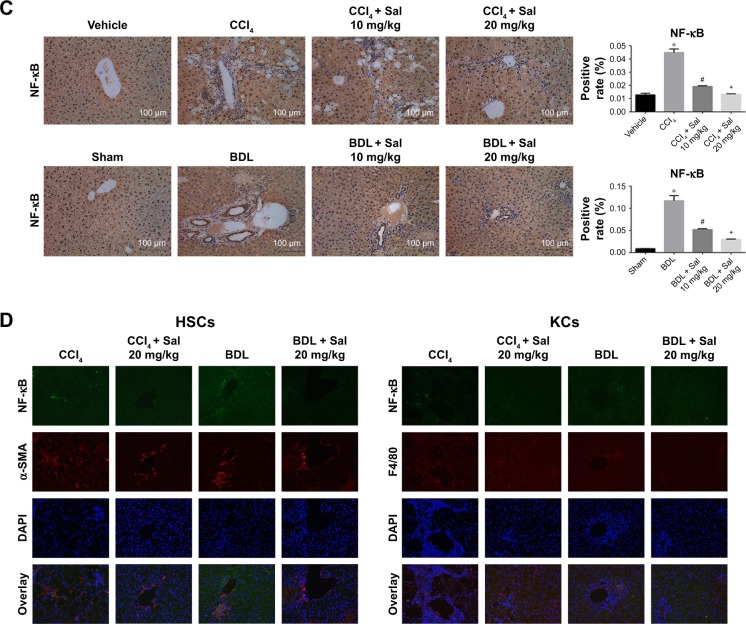
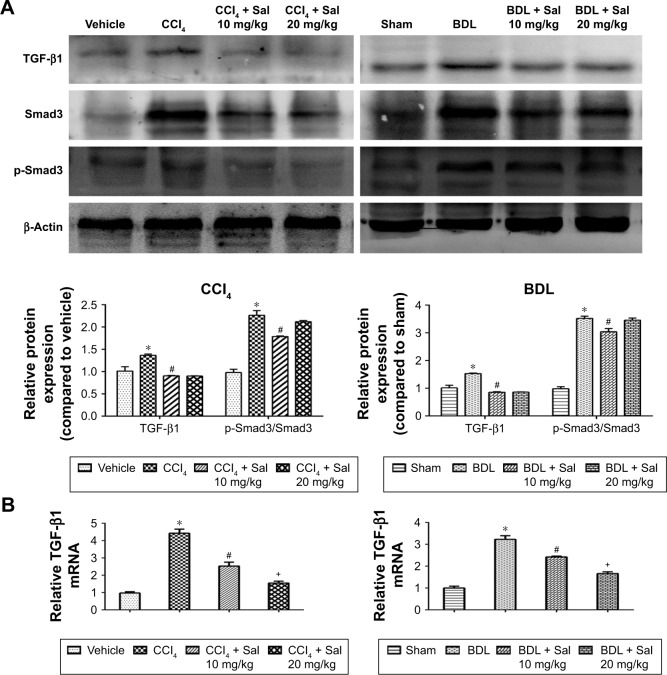
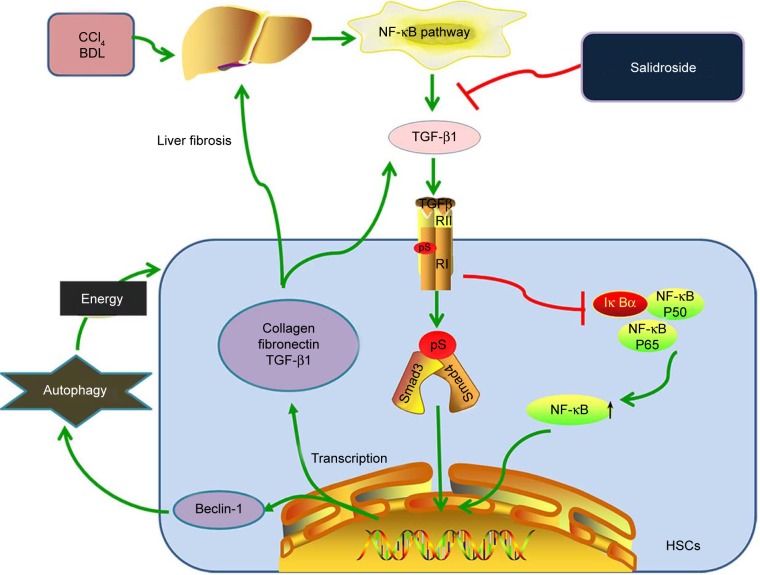
Results: Salidroside inhibited the production of extracellular matrix (ECM) and regulated the balance between MMP2 and TIMP1 and, therefore, alleviated liver fibrosis in the two fibrosis models. Salidroside reduced the production of transforming growth factor (TGF)-β1 in Kupffer cells and hepatic stellate cells (HSCs) via the nuclear factor-κB signaling pathway and, therefore, inhibited the activation of HSCs and autophagy by downregulation of the TGF-β1/Smad3 signaling pathway.

Conclusion: Salidroside can effectively attenuate liver fibrosis by inhibiting the activation of HSCs in mice.

Keywords: TGF-β1/Smad3; autophagy; hepatic stellate cells; liver fibrosis; salidroside.


Conflict of interest statement

Disclosure The authors report no conflicts of interest in this work.

Figures

Figure 1
Figure 1
Effect of salidroside on liver function and pathology in CCl4- and BDL-induced liver fibrosis. Notes: (A) CCl4- and BDL-induced increases in serum ALT and AST and liver hydroxyproline levels were reduced by salidroside in dose-dependent manners. Data given as mean ± SD (n=8, *P<0.05 for CCl4 or BDL group vs vehicle or sham group, #P<0.05 for CCl4 + Sal 10 mg/kg or BDL + Sal 10 mg/kg vs CCl4 or BDL group, and +P<0.05 for CCl4 + Sal 20 mg/kg or BDL + Sal 20 mg/kg vs CCl4 + Sal 10 mg/kg or BDL + Sal 10 mg/kg). (B and C) H&E stain and Masson’s trichrome stain of liver sections (original magnification, ×200, scale bars =100 μm). There was rearrangement of liver lobular structures, ballooning or necrosis of hepatocytes, and formation of pericellular collagen deposition in CCl4 group in H&E staining. BDL resulted in proliferation of the bile duct and deposition of collagen around the portal areas. Masson stain showed increased collagen staining in both the CCl4 and BDL groups compared with the vehicle and sham groups. However, salidroside could decrease liver injury and collagen deposition in the two liver fibrosis mouse models. Abbreviations: ALT, alanine aminotransferase; AST, aspartate aminotransferase; BDL, bile duct ligation; CCl4, carbon tetrachloride; H&E, hematoxylin and eosin; Sal, salidroside; SD, standard deviation.
Figure 2
Figure 2
Salidroside ameliorated autophagy process in liver fibrosis. Notes: (A) TEM showed that the number of autophagosomes, which were indicated by red arrows, was decreased by salidroside (original magnification, ×10,000). (B) Western blot and quantitative analyses of Beclin-1, LC3, and p62. Salidroside inhibited autophagy by decreasing Beclin-1 and LC3 expression and increasing p62 in both CCl4- and BDL-induced liver fibrosis mouse models. (C) The qPCR analyses. (D) Immunohistochemical staining showed that salidroside reduced Beclin-1- and LC3-positive cells in liver tissues in both CCl4 and BDL groups (original magnification, ×200). Data were given as mean ± SD (n=8, *P<0.05 for CCl4 or BDL group vs vehicle or sham group, #P<0.05 for CCl4 + Sal 10 mg/kg or BDL + Sal 10 mg/kg vs CCl4 or BDL group, and +P<0.05 for CCl4 + Sal 20 mg/kg or BDL + Sal 20 mg/kg vs CCl4 + Sal 10 mg/kg or BDL + Sal 10 mg/kg). Abbreviations: BDL, bile duct ligation; CCl4, carbon tetrachloride; qPCR, quantitative real-time polymerase chain reaction; Sal, salidroside; SD, standard deviation; TEM, transmission electron microscopy.
Figure 2
Figure 2
Salidroside ameliorated autophagy process in liver fibrosis. Notes: (A) TEM showed that the number of autophagosomes, which were indicated by red arrows, was decreased by salidroside (original magnification, ×10,000). (B) Western blot and quantitative analyses of Beclin-1, LC3, and p62. Salidroside inhibited autophagy by decreasing Beclin-1 and LC3 expression and increasing p62 in both CCl4- and BDL-induced liver fibrosis mouse models. (C) The qPCR analyses. (D) Immunohistochemical staining showed that salidroside reduced Beclin-1- and LC3-positive cells in liver tissues in both CCl4 and BDL groups (original magnification, ×200). Data were given as mean ± SD (n=8, *P<0.05 for CCl4 or BDL group vs vehicle or sham group, #P<0.05 for CCl4 + Sal 10 mg/kg or BDL + Sal 10 mg/kg vs CCl4 or BDL group, and +P<0.05 for CCl4 + Sal 20 mg/kg or BDL + Sal 20 mg/kg vs CCl4 + Sal 10 mg/kg or BDL + Sal 10 mg/kg). Abbreviations: BDL, bile duct ligation; CCl4, carbon tetrachloride; qPCR, quantitative real-time polymerase chain reaction; Sal, salidroside; SD, standard deviation; TEM, transmission electron microscopy.
Figure 3
Figure 3
Salidroside inhibited ECM production and regulated the balance between MMP2 and TIMP1. Notes: (A) Western blot and quantitative analyses. Salidroside decreased Col-1, α-SMA, and TIMP1 levels and increased MMP2 levels in the two liver fibrosis mouse models, compared with CCl4 or BDL treatment alone. (B) The qPCR analyses. Salidroside downregulated mRNA expression levels of Col-1α1, Col-1α2, α-SMA, and TIMP1 and upregulated MMP2 mRNA. (C) Immunohistochemical staining showed that the increased expression levels of Col-1 and α-SMA proteins in liver tissues in both CCl4 and BDL groups were ameliorated by salidroside (original magnification, ×200, scale bars =100 μm). Data were given as mean ± SD (n=8, *P<0.05 for CCl4 or BDL group vs vehicle or sham group, #P<0.05 for CCl4 + Sal 10 mg/kg or BDL + Sal 10 mg/kg vs CCl4 or BDL group, and +P<0.05 for CCl4 + Sal 20 mg/kg or BDL + Sal 20 mg/kg vs CCl4 + Sal 10 mg/kg or BDL + Sal 10 mg/kg). Abbreviations: BDL, bile duct ligation; CCl4, carbon tetrachloride; ECM, extracellular matrix; qPCR, quantitative real-time polymerase chain reaction; Sal, salidroside; SD, standard deviation.
Figure 3
Figure 3
Salidroside inhibited ECM production and regulated the balance between MMP2 and TIMP1. Notes: (A) Western blot and quantitative analyses. Salidroside decreased Col-1, α-SMA, and TIMP1 levels and increased MMP2 levels in the two liver fibrosis mouse models, compared with CCl4 or BDL treatment alone. (B) The qPCR analyses. Salidroside downregulated mRNA expression levels of Col-1α1, Col-1α2, α-SMA, and TIMP1 and upregulated MMP2 mRNA. (C) Immunohistochemical staining showed that the increased expression levels of Col-1 and α-SMA proteins in liver tissues in both CCl4 and BDL groups were ameliorated by salidroside (original magnification, ×200, scale bars =100 μm). Data were given as mean ± SD (n=8, *P<0.05 for CCl4 or BDL group vs vehicle or sham group, #P<0.05 for CCl4 + Sal 10 mg/kg or BDL + Sal 10 mg/kg vs CCl4 or BDL group, and +P<0.05 for CCl4 + Sal 20 mg/kg or BDL + Sal 20 mg/kg vs CCl4 + Sal 10 mg/kg or BDL + Sal 10 mg/kg). Abbreviations: BDL, bile duct ligation; CCl4, carbon tetrachloride; ECM, extracellular matrix; qPCR, quantitative real-time polymerase chain reaction; Sal, salidroside; SD, standard deviation.
Figure 4
Figure 4
Salidroside downregulated the NF-κB pathway in liver fibrosis. Notes: (A) Western blot and quantitative analyses of NF-κB pathway. Salidroside inhibited NF-κB expression and increased IκBα expression in both mouse liver fibrosis models. (B) The qPCR analyses. Salidroside downregulated NF-κB mRNA expression levels. (C) Immunohistochemical staining showed that salidroside reduced the expression of NF-κB in liver tissues in both CCl4 and BDL groups (original magnification, ×200). (D) Representative images of double-immunofluorescence staining of liver sections were showed here (original magnification, ×400). α-SMA is considered to be a marker of activated HSCs, and F4/80 is the specific marker of KCs. There were positive areas in CCl4 and BDL groups. However, salidroside treatment could effectively inhibit the expression of NF-κB in these two kinds of cells. Data were given as mean ± SD (n=8, *P<0.05 for CCl4 or BDL group vs vehicle or sham group, #P<0.05 for CCl4 + Sal 10 mg/kg or BDL + Sal 10 mg/kg vs CCl4 or BDL group, and +P<0.05 for CCl4 + Sal 20 mg/kg or BDL + Sal 20 mg/kg vs CCl4 + Sal 10 mg/kg or BDL + Sal 10 mg/kg). Abbreviations: BDL, bile duct ligation; CCl4, carbon tetrachloride; HSCs, hepatic stellate cells; KCs, Kupffer cells; qPCR, quantitative real-time polymerase chain reaction; Sal, salidroside; SD, standard deviation.
Figure 4
Figure 4
Salidroside downregulated the NF-κB pathway in liver fibrosis. Notes: (A) Western blot and quantitative analyses of NF-κB pathway. Salidroside inhibited NF-κB expression and increased IκBα expression in both mouse liver fibrosis models. (B) The qPCR analyses. Salidroside downregulated NF-κB mRNA expression levels. (C) Immunohistochemical staining showed that salidroside reduced the expression of NF-κB in liver tissues in both CCl4 and BDL groups (original magnification, ×200). (D) Representative images of double-immunofluorescence staining of liver sections were showed here (original magnification, ×400). α-SMA is considered to be a marker of activated HSCs, and F4/80 is the specific marker of KCs. There were positive areas in CCl4 and BDL groups. However, salidroside treatment could effectively inhibit the expression of NF-κB in these two kinds of cells. Data were given as mean ± SD (n=8, *P<0.05 for CCl4 or BDL group vs vehicle or sham group, #P<0.05 for CCl4 + Sal 10 mg/kg or BDL + Sal 10 mg/kg vs CCl4 or BDL group, and +P<0.05 for CCl4 + Sal 20 mg/kg or BDL + Sal 20 mg/kg vs CCl4 + Sal 10 mg/kg or BDL + Sal 10 mg/kg). Abbreviations: BDL, bile duct ligation; CCl4, carbon tetrachloride; HSCs, hepatic stellate cells; KCs, Kupffer cells; qPCR, quantitative real-time polymerase chain reaction; Sal, salidroside; SD, standard deviation.
Figure 5
Figure 5
Salidroside inhibited the TGF-β1/Smad3 pathway in liver fibrosis. Notes: (A) Western blot and quantitative analyses of TGF-β1/Smad3 pathway. Salidroside inhibited the expression of these proteins in both liver fibrosis mouse models. (B) The qPCR analyses. Salidroside attenuated TGF-β1 mRNA expression. (C) Immunohistochemical staining showed that salidroside reduced the expression of TGF-β1 and p-Smad3 in liver tissues in both model groups (original magnification, ×200, scale bar =100 μm). (D) Representative images of double-immunofluorescence staining of liver sections were showed here (original magnification, ×400). α-SMA is considered to be a marker of activated HSCs, and F4/80 is the specific marker of KCs. There were positive areas in CCl4 and BDL groups. However, salidroside treatment could effectively inhibit the expression of TGF-β1 in these two kinds of cells. Data were given as mean ± SD (n=8, *P<0.05 for CCl4 or BDL group vs vehicle or sham group, #P<0.05 for CCl4 + Sal 10 mg/kg or BDL + Sal 10 mg/kg vs CCl4 or BDL group, and +P<0.05 for CCl4 + Sal 20 mg/kg or BDL + Sal 20 mg/kg vs CCl4 + Sal 10 mg/kg or BDL + Sal 10 mg/kg). Abbreviations: BDL, bile duct ligation; CCl4, carbon tetrachloride; HSCs, hepatic stellate cells; KCs, Kupffer cells; qPCR, quantitative real-time polymerase chain reaction; Sal, salidroside; SD, standard deviation.
Figure 5
Figure 5
Salidroside inhibited the TGF-β1/Smad3 pathway in liver fibrosis. Notes: (A) Western blot and quantitative analyses of TGF-β1/Smad3 pathway. Salidroside inhibited the expression of these proteins in both liver fibrosis mouse models. (B) The qPCR analyses. Salidroside attenuated TGF-β1 mRNA expression. (C) Immunohistochemical staining showed that salidroside reduced the expression of TGF-β1 and p-Smad3 in liver tissues in both model groups (original magnification, ×200, scale bar =100 μm). (D) Representative images of double-immunofluorescence staining of liver sections were showed here (original magnification, ×400). α-SMA is considered to be a marker of activated HSCs, and F4/80 is the specific marker of KCs. There were positive areas in CCl4 and BDL groups. However, salidroside treatment could effectively inhibit the expression of TGF-β1 in these two kinds of cells. Data were given as mean ± SD (n=8, *P<0.05 for CCl4 or BDL group vs vehicle or sham group, #P<0.05 for CCl4 + Sal 10 mg/kg or BDL + Sal 10 mg/kg vs CCl4 or BDL group, and +P<0.05 for CCl4 + Sal 20 mg/kg or BDL + Sal 20 mg/kg vs CCl4 + Sal 10 mg/kg or BDL + Sal 10 mg/kg). Abbreviations: BDL, bile duct ligation; CCl4, carbon tetrachloride; HSCs, hepatic stellate cells; KCs, Kupffer cells; qPCR, quantitative real-time polymerase chain reaction; Sal, salidroside; SD, standard deviation.
Figure 6
Figure 6
Protective mechanisms of salidroside against liver fibrosis. Notes: Salidroside inhibits the production of TGF-β1 in KCs and HSCs via the NF-κB signaling pathway. Insufficient TGF-β1 results in the reduced activation of HSCs and downregulation of the TGF-β1/Smad3 signaling pathway, including decreased ECM production and inhibition of autophagy. Abbreviations: BDL, bile duct ligation; CCl4, carbon tetrachloride; ECM, extracellular matrix; HSCs, hepatic stellate cells; KCs, Kupffer cells.

References

    1. Crespo Yanguas S, Cogliati B, Willebrords J, et al. Experimental models of liver fibrosis. Arch Toxicol. 2016;90(5):1025–1048. - PMC - PubMed
    1. Schuppan D. Liver fibrosis: common mechanisms and antifibrotic therapies. Clin Res Hepatol Gastroenterol. 2015;39(suppl 1):S51–S59. - PubMed
    1. Wu L, Zhang Q, Mo W, et al. Quercetin prevents hepatic fibrosis by inhibiting hepatic stellate cell activation and reducing autophagy via the TGF-beta1/Smads and PI3K/Akt pathways. Sci Rep. 2017;7(1):9289. - PMC - PubMed
    1. Mao Y, Zhang S, Yu F, Li H, Guo C, Fan X. Ghrelin attenuates liver fibrosis through regulation of TGF-beta1 expression and autophagy. Int J Mol Sci. 2015;16(9):21911–21930. - PMC - PubMed
    1. Toosi AE. Liver fibrosis: causes and methods of assessment, a review. Rom J Intern Med. 2015;53(4):304–314. - PubMed