. 2018 Jun 19:12:248.
doi: 10.3389/fnhum.2018.00248. eCollection 2018.

Local and Widespread Slow Waves in Stable NREM Sleep: Evidence for Distinct Regulation Mechanisms

Affiliations

Local and Widespread Slow Waves in Stable NREM Sleep: Evidence for Distinct Regulation Mechanisms

Giulio Bernardi et al. Front Hum Neurosci. .

Abstract

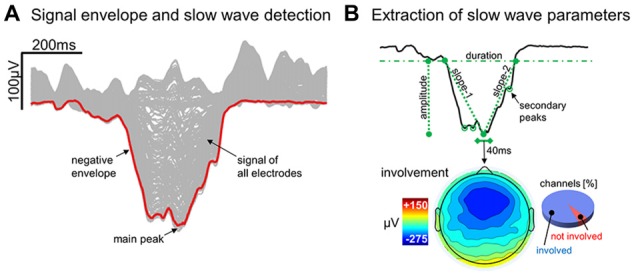
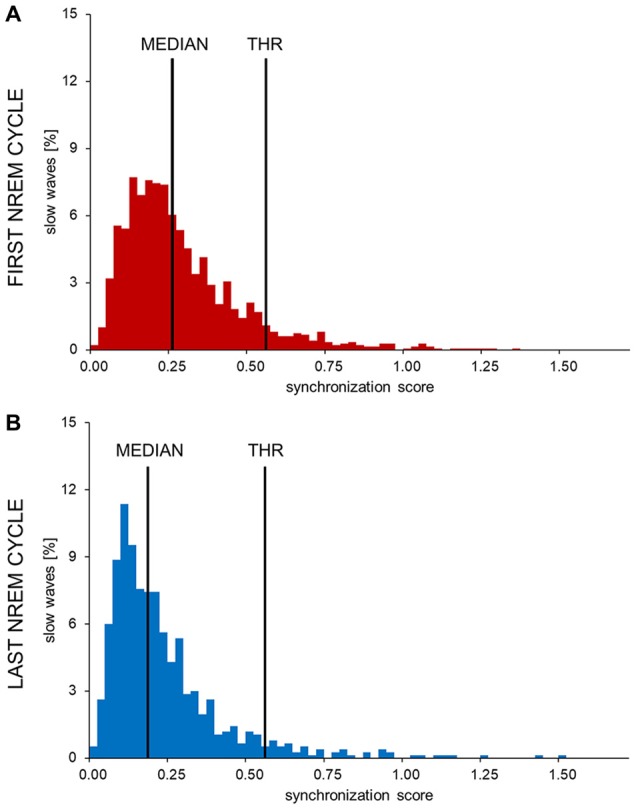
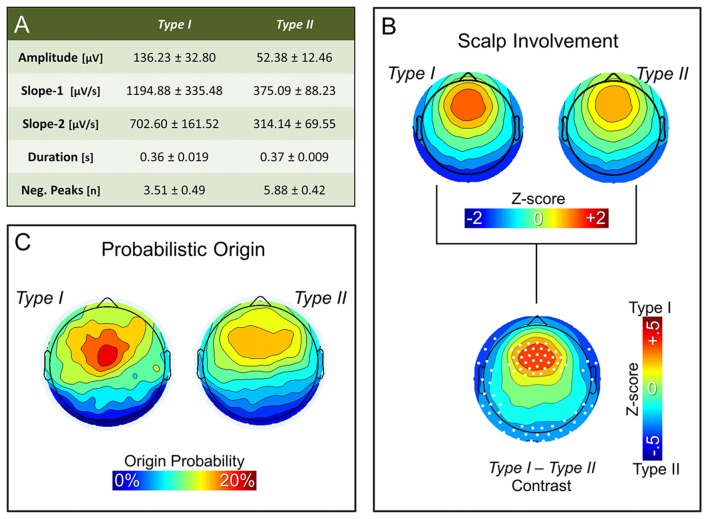
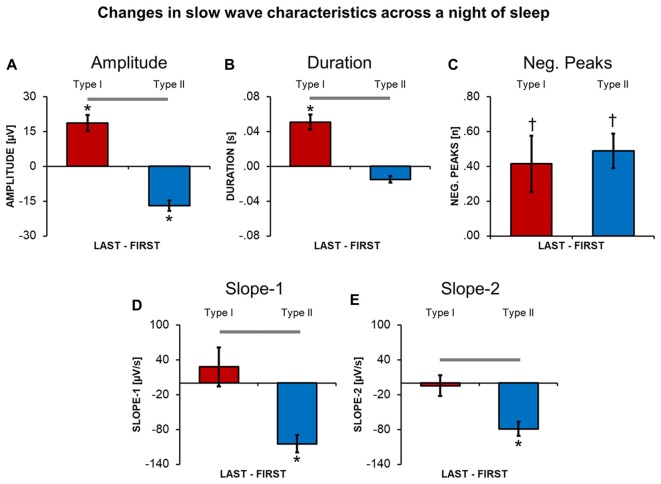
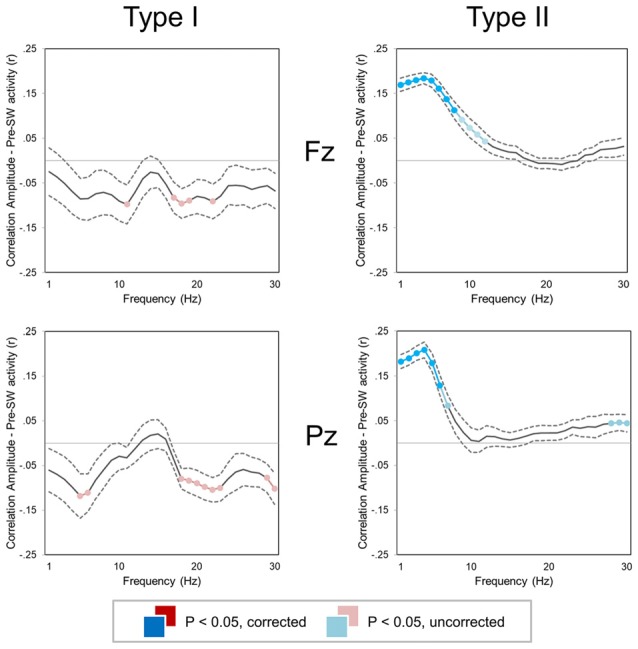
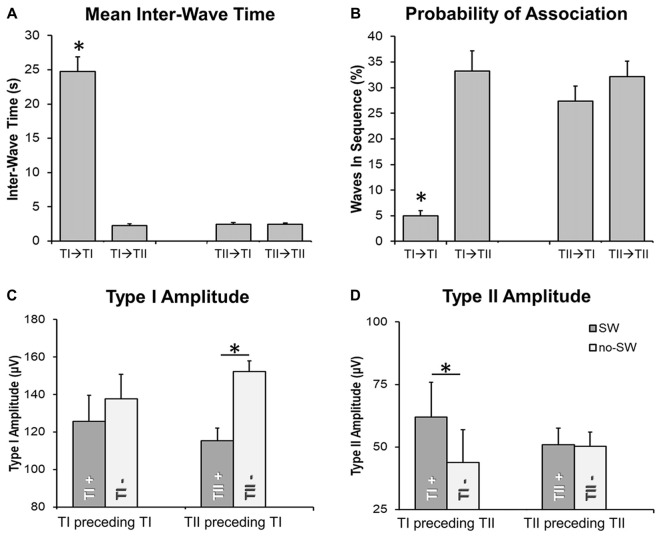
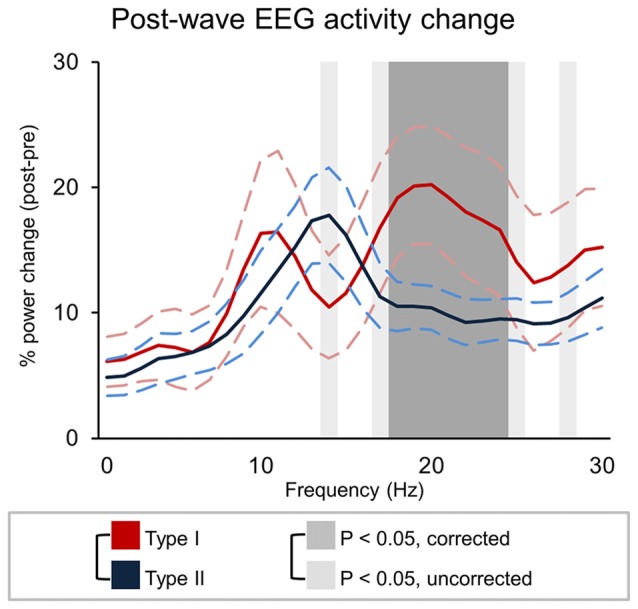
Previous work showed that two types of slow waves are temporally dissociated during the transition to sleep: widespread, large and steep slow waves predominate early in the falling asleep period (type I), while smaller, more circumscribed slow waves become more prevalent later (type II). Here, we studied the possible occurrence of these two types of slow waves in stable non-REM (NREM) sleep and explored potential differences in their regulation. A heuristic approach based on slow wave synchronization efficiency was developed and applied to high-density electroencephalographic (EEG) recordings collected during consolidated NREM sleep to identify the potential type I and type II slow waves. Slow waves with characteristics compatible with those previously described for type I and type II were identified in stable NREM sleep. Importantly, these slow waves underwent opposite changes across the night, with only type II slow waves displaying a clear homeostatic regulation. In addition, we showed that the occurrence of type I slow waves was often followed by larger type II slow waves, whereas the occurrence of type II slow waves was usually followed by smaller type I waves. Finally, type II slow waves were associated with a relative increase in spindle activity, while type I slow waves triggered periods of high-frequency activity. Our results provide evidence for the existence of two distinct slow wave synchronization processes that underlie two different types of slow waves. These slow waves may have different functional roles and mark partially distinct "micro-states" of the sleeping brain.

Keywords: K-complex; NREM sleep; high-density EEG; slow wave activity; slow waves.


Figures

Figure 1
Figure 1
Detection and characterization of slow waves. Panel (A) shows the signal corresponding to a representative (type I) slow wave for all individual electrodes (gray lines) and for the negative envelope (red line) computed across all channels (the latter is the signal actually used for slow wave detection). Panel (B) depicts the different parameters extracted from the negative envelope of the same slow wave, including duration, amplitude, slope-1, slope-2, number negative peaks and the proportion of involved electrodes.
Figure 2
Figure 2
Histograms showing the distribution of synchronization scores (SS) in one representative subject. The SSs observed in the first (A) and last (B) sleep cycle were divided in 0.025 SS-units bins to obtain these images. The y-axis shows the percentage of all detected waves in each bin. In all subjects and examined conditions the SS showed a non-normal, skewed distribution. The long, sparse, right tail of the distribution is compatible with the presence of highly synchronized slow waves. An arbitrary threshold to distinguish between potential type I and type II slow waves (THR) was set at three median absolute deviations (MAD) from the median of the early SS distribution.
Figure 3
Figure 3
Properties of non-REM (NREM) slow waves classified as type I and type II. Panel (A) displays the mean ± SD for the main morphological properties of slow waves detected during the first NREM cycle: amplitude, slope-1, slope-2, duration and number of negative peaks. Topographic plots in panel (B) represent the mean scalp involvement of type I and type II waves, as well as the statistical comparison between the two (p < 0.05, Bonferroni corrected). Finally, topographic plots in panel (C) show the distribution of the probabilistic origin for the two types of slow waves.
Figure 4
Figure 4
Changes in slow wave characteristics throughout a night of continuous sleep. Each barplot displays the difference between the last and the first NREM sleep cycle for slow waves classified as type I or type II, in: amplitude (A), duration (B), number of negative peaks (C), slope-1 (D), slope-2 (E). Vertical bars indicate standard errors (SE). Horizontal gray bars mark significant differences in relative overnight changes between type I and type II waves. Asterisks mark significant overnight changes for each slow wave type separately. *Bonferroni corrected p < 0.05; uncorrected p < 0.05.
Figure 5
Figure 5
Correlation between slow wave amplitude and background EEG activity (±SE, dashed lines) for two small regions of interest (ROIs) centered on Fz (top) and Pz (bottom). Colored (red, cyan) sections indicate significant correlations (Bonferroni corrected p < 0.05; lighter colors indicate uncorrected p < 0.05). For both type I (left column) and type II (right column) slow waves, the mean power was computed in 1 Hz frequency bins for the time window corresponding to −2.5 to −0.5 s with respect to the first zero-crossing of the slow wave.
Figure 6
Figure 6
Temporal relationship between slow waves. Barplots in (A,B) show that the delay between two type I slow waves is typically longer than the delay between type I and type II slow waves or between two type II slow waves. Barplots in (C,D) depict the effect of the “presence” (TI+, TII+; vs. “absence,” marked with TI- or TII-) of a slow wave on the amplitude of a subsequent, associated type I (TI) or type II (TII) slow wave. Two waves were defined as associated if the distance between the end of the preceding half-wave and the beginning of the following negative deflection was <1 s. The *marks significant differences at corrected p < 0.05 (when placed above a single bar, the *marks difference between a specific condition and all other examined conditions). Vertical bars indicate SE.
Figure 7
Figure 7
Signal power changes following type I and type II slow waves. The graph show the percent power variation between pre- and post- slow wave periods (±SE, dashed lines). Dark-gray shadows indicate Bonferroni corrected p < 0.05, while light gray indicate results at uncorrected p < 0.05.

References

    1. Achermann P., Borbély A. A. (1997). Low-frequency (<1 Hz) oscillations in the human sleep electroencephalogram. Neuroscience 81, 213–222. 10.1016/s0306-4522(97)00186-3 - DOI - PubMed
    1. Bastien C., Campbell K. (1992). The evoked K-complex: all-or-none phenomenon? Sleep 15, 236–245. 10.1093/sleep/15.3.236 - DOI - PubMed
    1. Bastien C., Campbell K. (1994). Effects of rate of tone-pip stimulation on the evoked K-Complex. J. Sleep Res. 3, 65–72. 10.1111/j.1365-2869.1994.tb00109.x - DOI - PubMed
    1. Bellesi M., Riedner B. A., Garcia-Molina G. N., Cirelli C., Tononi G. (2014). Enhancement of sleep slow waves: underlying mechanisms and practical consequences. Front. Syst. Neurosci. 8:208. 10.3389/fnsys.2014.00208 - DOI - PMC - PubMed
    1. Bernardi G., Cecchetti L., Siclari F., Buchmann A., Yu X., Handjaras G., et al. . (2016). Sleep reverts changes in human grey and white matter caused by wake-dependent training. Neuroimage 129, 367–377. 10.1016/j.neuroimage.2016.01.020 - DOI - PMC - PubMed