. 2018 Jun 19:9:721.
doi: 10.3389/fphys.2018.00721. eCollection 2018.

Validation of Patient-Specific Cerebral Blood Flow Simulation Using Transcranial Doppler Measurements

Affiliations

Validation of Patient-Specific Cerebral Blood Flow Simulation Using Transcranial Doppler Measurements

Derek Groen et al. Front Physiol. .

Abstract

We present a validation study comparing results from a patient-specific lattice-Boltzmann simulation to transcranial Doppler (TCD) velocity measurements in four different planes of the middle cerebral artery (MCA). As part of the study, we compared simulations using a Newtonian and a Carreau-Yasuda rheology model. We also investigated the viability of using downscaled velocities to reduce the required resolution. Simulations with unscaled velocities predict the maximum flow velocity with an error of less than 9%, independent of the rheology model chosen. The accuracy of the simulation predictions worsens considerably when simulations are run at reduced velocity, as is for example the case when inflow velocities from healthy individuals are used on a vascular model of a stroke patient. Our results demonstrate the importance of using directly measured and patient-specific inflow velocities when simulating blood flow in MCAs. We conclude that localized TCD measurements together with predictive simulations can be used to obtain flow estimates with high fidelity over a larger region, and reduce the need for more invasive flow measurement procedures.

Keywords: blood flow; computational fluid dynamics; high performance computing; lattice-Boltzmann; middle cerebral artery; transcranial Doppler; validation study.


Figures

Figure 1
Figure 1
Overview of the overall patient vasculature in the medical images (A), and the patient-specific 3D model used in our simulations (B). As part of the simulation model overview, we indicate the four TCD measurement planes used for validation. Both the inlet and the 63 mm TCD measurement plane are at the right hand side of the image.
Figure 2
Figure 2
Raw TCD input image of the measured velocity at a depth of 63 mm (inflow boundary plane). The measured velocity at the selected depth (63 mm) is given at the top, while the general flow direction at all depths is given at the bottom, either toward the device (red) or away from it (blue). We observe a change in flow direction around a depth of 67 mm, which is at the junction between the right MCA and the right ACA.
Figure 3
Figure 3
Differential pressure at the main outlet plane, relative to the ideal gas pressure for average density in the simulation. The maximal pressure found in the plane is given by the red dashed line, while the minimal pressure found in the plane is given by the blue dotted line. The average pressure in the plane is given by the black line.
Figure 4
Figure 4
Comparison of the maximum velocity using both TCD (blue line) HemeLB (green line), given for the planes at 49 mm (Top left), 54 mm (Top right), 57 mm (Bottom left), and 59 mm (Bottom right). HemeLB results presented here are for the run at 100% velocity and with Newtonian rheology. The phase has been shifted to align both results with the start of the first cardiac cycle.
Figure 5
Figure 5
Calculated flow velocity magnitude, in the direction along the vessel center lines, at the second peak systole (at 1.44 s) in m/s for each of the four TCD validation planes. We show the velocity profiles in (A–D) for planes at a depth at 49, 54, 57, and 59 mm, respectively (run at 100% velocity, Newtonian rheology). We present the calculated wall shear stress (WSS) at peak systole in (E), and at diastole (at 2.18 s) in (F) (using the same scale).
Figure 6
Figure 6
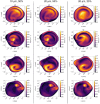
Absolute difference in flow velocity, between the run with Newtonian rheology at 10 μm resolution and 100% velocity and other runs for each of the four validation planes. Comparisons are made with runs at 10 μm and 50% velocity (Left column), 20 μm and 50% velocity (Middle), and 20 μm, and 25% velocity (Right) respectively. The velocities in reduced velocity runs are multiplied by 2 (for the 50% velocity runs) or 4 (for the 25% velocity runs). The snapshots were made at the second peak systole (at 1.44 s), with differences in m/s.
Figure 7
Figure 7
Absolute difference in flow velocity, between the run with Newtonian rheology and run with CY rheology. Both of these runs were performed at 100% of the full velocity. The snapshots were made at the second peak systole (at 1.44 s), with differences in m/s, for each of the four TCD validation planes.
Figure 8
Figure 8
Absolute difference in flow velocity, between the run with Newtonian rheology and run with CY rheology. Both of these runs were performed at 50% of the full velocity, with the differences rescaled by a factor 2. The snapshots were made at the second peak systole (at 1.44 s), with differences in m/s, for each of the four TCD validation planes.

References

    1. Abraham F., Behr M., Heinkenschloss M. (2005). Shape optimization in steady blood flow: a numerical study of non-newtonian effects. Comput. Methods Biomech. Biomed. Eng. 8, 127–137. 10.1080/10255840512331388588 - DOI - PubMed
    1. Alnæs M. S., Isaksen J., Mardal K. A., Romner B., Morgan M. K., Ingebrigtsen T. (2007). Computation of hemodynamics in the circle of Willis. Stroke 38, 2500–2505. 10.1161/STROKEAHA.107.482471 - DOI - PubMed
    1. Bernabeu M. O., Nash R. W., Groen D., Carver H. B., Hetherington J., Krüger T., et al. . (2013). Impact of blood rheology on wall shear stress in a model of the middle cerebral artery. J. R. Soc. Interface Focus 3:20120094. 10.1098/rsfs.2012.0094 - DOI - PMC - PubMed
    1. Bernsdorf J., Wang D. (2009). Non-Newtonian blood flow simulation in cerebral aneurysms. Comput. Math. Appl. 58, 1024–1029. 10.1016/j.camwa.2009.02.019 - DOI
    1. Bhatnagar P. L., Gross E. P., Krook M. (1954). A model for collision processes in gases. I. Small amplitude processes in charged and neutral one-component systems. Phys. Rev. 94, 511–525.