

Exploring the Potential Roles of Band 3 and Aquaporin-1 in Blood CO2 Transport-Inspired by Comparative Studies of Glycophorin B-A-B Hybrid Protein GP.Mur
- PMID: 29971013
- PMCID: PMC6018491
- DOI: 10.3389/fphys.2018.00733
Exploring the Potential Roles of Band 3 and Aquaporin-1 in Blood CO2 Transport-Inspired by Comparative Studies of Glycophorin B-A-B Hybrid Protein GP.Mur
Abstract
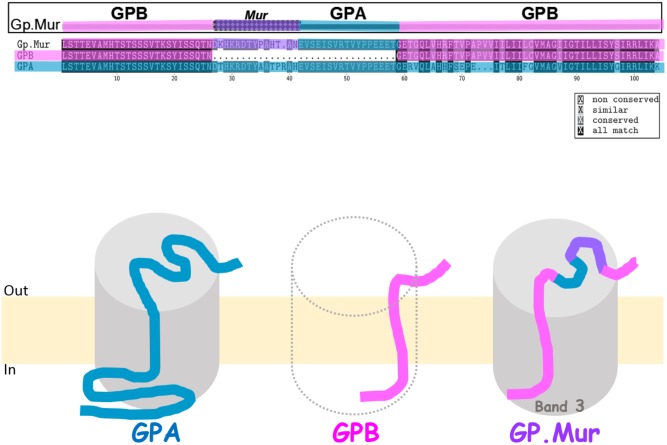
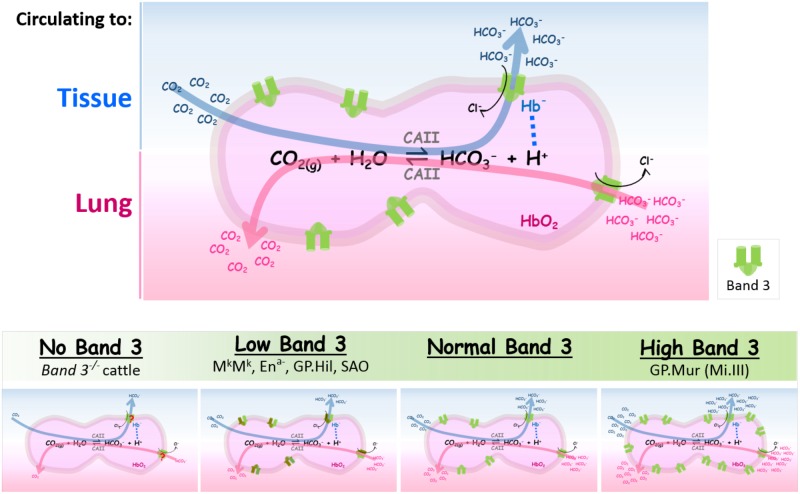
The Cl-/HCO3- exchanger band 3 is functionally relevant to blood CO2 transport. Band 3 is the most abundant membrane protein in human red blood cells (RBCs). Our understanding of its physiological functions mainly came from clinical cases associated with band 3 mutations. Severe reduction in band 3 expression affects blood HCO3-/CO2 metabolism. What could happen physiologically if band 3 expression is elevated instead? In some areas of Southeast Asia, about 1-10% of the populations express GP.Mur, a glycophorin B-A-B hybrid membrane protein important in the field of transfusion medicine. GP.Mur functions to promote band 3 expression, and GP.Mur red cells can be deemed as a naturally occurred model for higher band 3 expression. This review first compares the functional consequences of band 3 at different levels, and suggests a critical role of band 3 in postnatal CO2 respiration. The second part of the review explores the transport of water, which is the other substrate for intra-erythrocytic CO2/HCO3- conversion (an essential step in blood CO2 transport). Despite that water is considered unlimited physiologically, it is unclear whether water channel aquaporin-1 (AQP1) abundantly expressed in RBCs is functionally involved in CO2 transport. Research in this area is complicated by the fact that the H2O/CO2-transporting function of AQP1 is replaceable by other erythrocyte channels/transporters (e.g., UT-B/GLUT1 for H2O; RhAG for CO2). Recently, using carbonic anhydrase II (CAII)-filled erythrocyte vesicles, AQP1 has been demonstrated to transport water for the CAII-mediated reaction, CO2(g) + H2O ⇌ HCO3-(aq) + H+(aq). AQP1 is structurally associated with some population of band 3 complexes on the erythrocyte membrane in an osmotically responsive fashion. The current findings reveal transient interaction among components within the band 3-central, CO2-transport metabolon (AQP1, band 3, CAII and deoxygenated hemoglobin). Their dynamic interaction is envisioned to facilitate blood CO2 respiration, in the presence of constantly changing osmotic and hemodynamic stresses during circulation.
Keywords: CO2 transport; GP.Mur; aquaporin-1; band 3; erythrocytes; glycophorin; metabolon.
Figures

Similar articles
-
Different Involvement of Band 3 in Red Cell Deformability and Osmotic Fragility-A Comparative GP.Mur Erythrocyte Study.Cells. 2021 Nov 30;10(12):3369. doi: 10.3390/cells10123369. Cells. 2021. PMID: 34943876 Free PMC article.
-
Adaptable interaction between aquaporin-1 and band 3 reveals a potential role of water channel in blood CO2 transport.FASEB J. 2017 Oct;31(10):4256-4264. doi: 10.1096/fj.201601282R. Epub 2017 Jun 8. FASEB J. 2017. PMID: 28596233 Free PMC article.
-
The MNS glycophorin variant GP.Mur affects differential erythroid expression of Rh/RhAG transcripts.Vox Sang. 2017 Oct;112(7):671-677. doi: 10.1111/vox.12555. Epub 2017 Aug 24. Vox Sang. 2017. PMID: 28836328
-
Role of RhAG and AQP1 in NH3 and CO2 gas transport in red cell ghosts: a stopped-flow analysis.Transfus Clin Biol. 2006 Mar-Apr;13(1-2):117-22. doi: 10.1016/j.tracli.2006.03.004. Epub 2006 Mar 29. Transfus Clin Biol. 2006. PMID: 16574458 Review.
-
Transport of volatile solutes through AQP1.J Physiol. 2002 Jul 1;542(Pt 1):17-29. doi: 10.1113/jphysiol.2002.023218. J Physiol. 2002. PMID: 12096045 Free PMC article. Review.
Cited by
-
Plasmodium knowlesi (Pk) Malaria: A Review & Proposal of Therapeutically Rational Exchange (T-REX) of Pk-Resistant Red Blood Cells.Trop Med Infect Dis. 2023 Oct 20;8(10):478. doi: 10.3390/tropicalmed8100478. Trop Med Infect Dis. 2023. PMID: 37888606 Free PMC article. Review.
-
A Balance between Transmembrane-Mediated ER/Golgi Retention and Forward Trafficking Signals in Glycophorin-Anion Exchanger-1 Interaction.Cells. 2022 Nov 6;11(21):3512. doi: 10.3390/cells11213512. Cells. 2022. PMID: 36359907 Free PMC article.
-
Increased Anion Exchanger-1 (Band 3) on the Red Blood Cell Membrane Accelerates Scavenging of Nitric Oxide Metabolites and Predisposes Hypertension Risks.Function (Oxf). 2025 Feb 12;6(1):zqae052. doi: 10.1093/function/zqae052. Function (Oxf). 2025. PMID: 39656872 Free PMC article.
-
What Decides Your Athletic Career?-Reflection from Our Study of GP.Mur-Associated Sports Talents during the COVID-19 Pandemic Era.Int J Environ Res Public Health. 2022 Oct 4;19(19):12691. doi: 10.3390/ijerph191912691. Int J Environ Res Public Health. 2022. PMID: 36231989 Free PMC article.
-
Chloride Gradient Is Involved in Ammonium Influx in Human Erythrocytes.Int J Mol Sci. 2024 Jul 5;25(13):7390. doi: 10.3390/ijms25137390. Int J Mol Sci. 2024. PMID: 39000500 Free PMC article.
References
-
- Al-Samir S., Papadopoulos S., Scheibe R. J., Meissner J. D., Cartron J. P., Sly W. S., et al. (2013). Activity and distribution of intracellular carbonic anhydrase II and their effects on the transport activity of anion exchanger AE1/SLC4A1. J. Physiol. 591 4963–4982. 10.1113/jphysiol.2013.251181 - DOI - PMC - PubMed
-
- Aoki S. S. (2002). The Writing About Taiwan by a Japanese Police Officer Who Lived in the Indigenous Communities of Taiwan. Osaka: Nenshosha.
Publication types
LinkOut - more resources
Full Text Sources
Other Literature Sources
Miscellaneous