

Non-invasive kinetic modelling of PET tracers with radiometabolites using a constrained simultaneous estimation method: evaluation with 11C-SB201745
- PMID: 29971517
- PMCID: PMC6029994
- DOI: 10.1186/s13550-018-0412-6
Non-invasive kinetic modelling of PET tracers with radiometabolites using a constrained simultaneous estimation method: evaluation with 11C-SB201745
Abstract
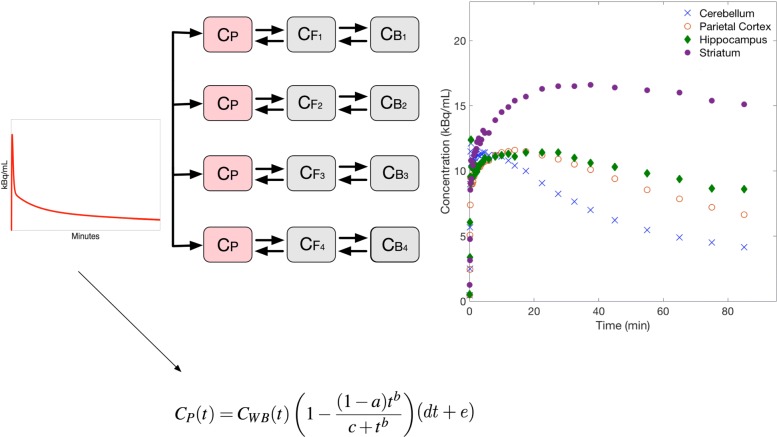
Background: Kinetic analysis of dynamic PET data requires an accurate knowledge of available PET tracer concentration within blood plasma over time, known as the arterial input function (AIF). The gold standard method used to measure the AIF requires serial arterial blood sampling over the course of the PET scan, which is an invasive procedure and makes this method less practical in clinical settings. Traditional image-derived methods are limited to specific tracers and are not accurate if metabolites are present in the plasma.
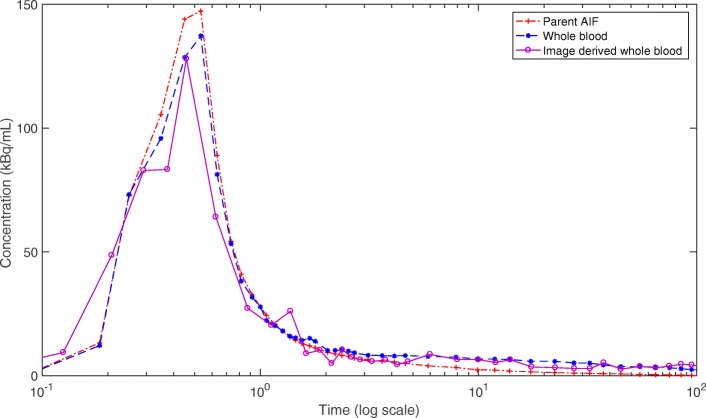
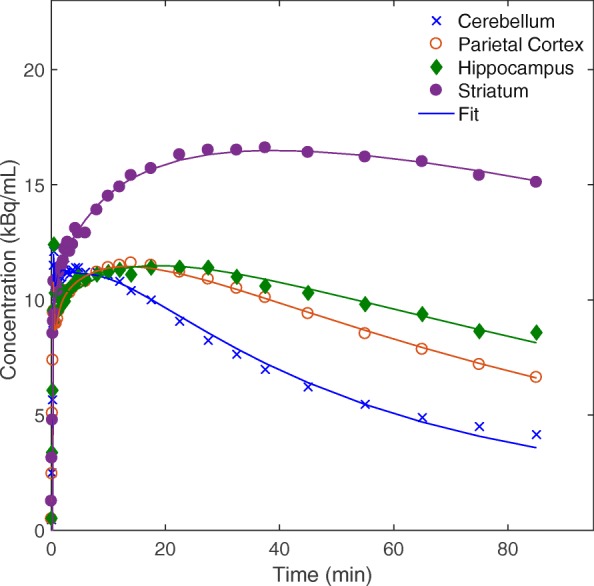
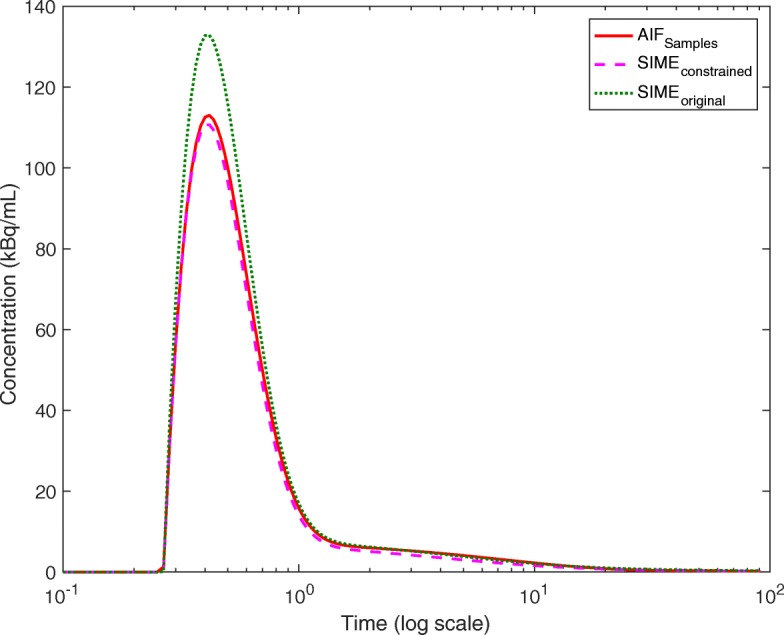
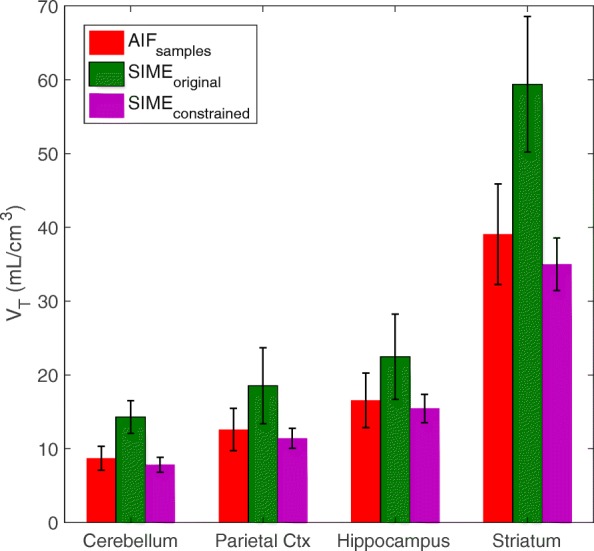
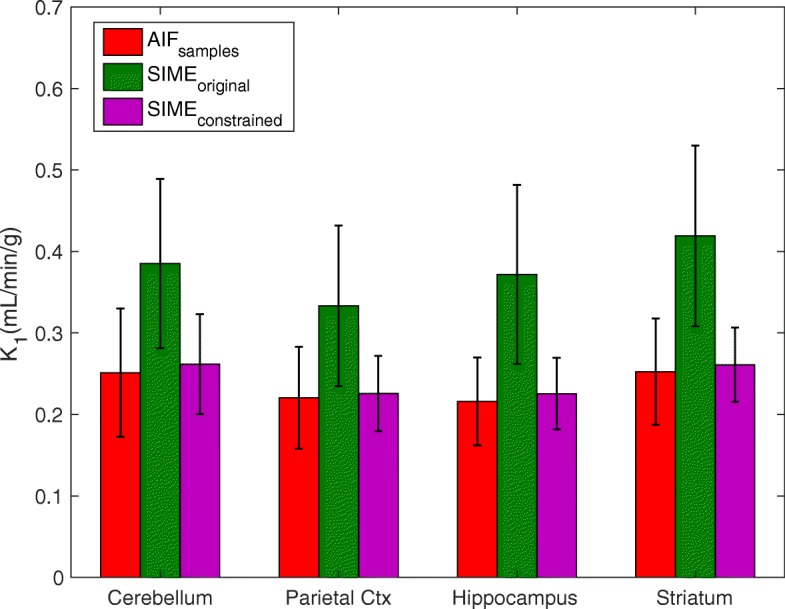
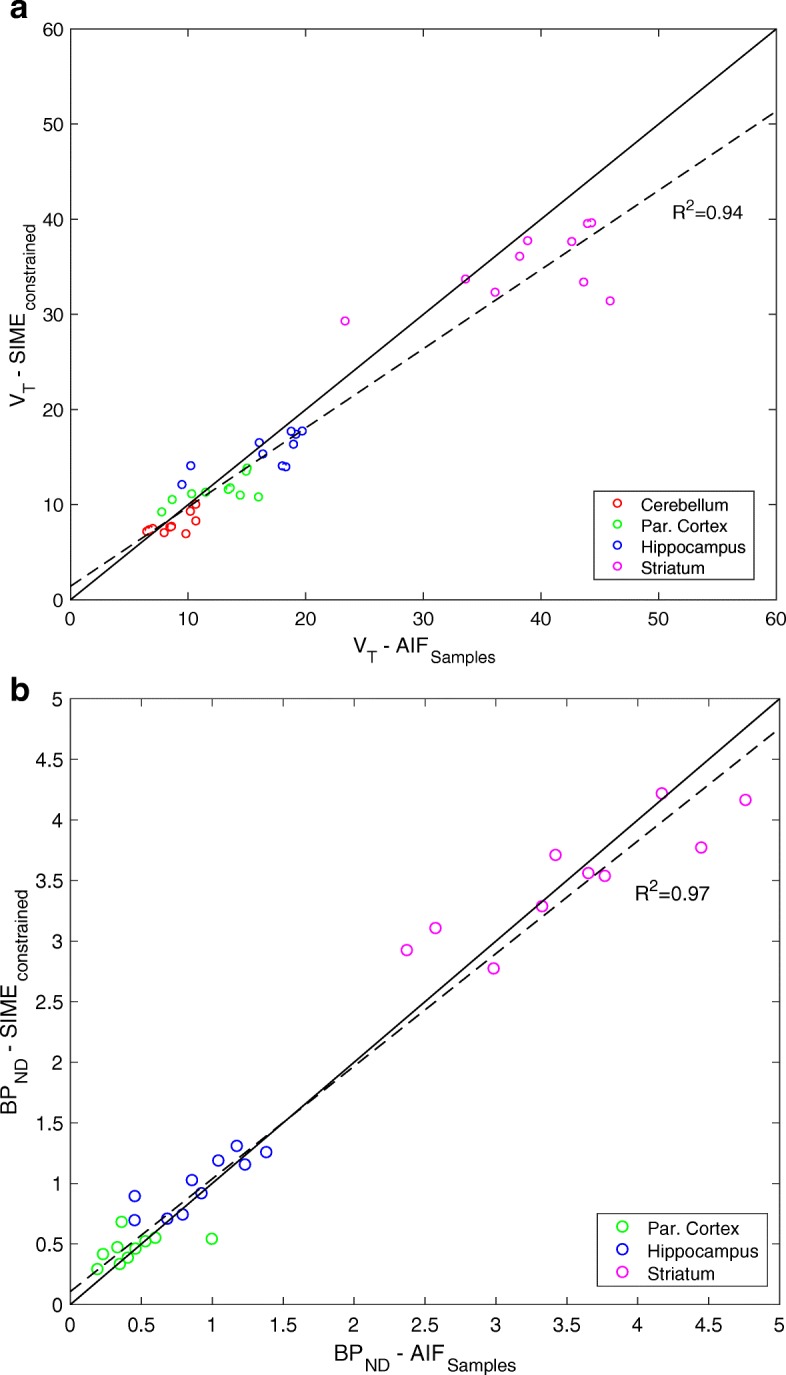
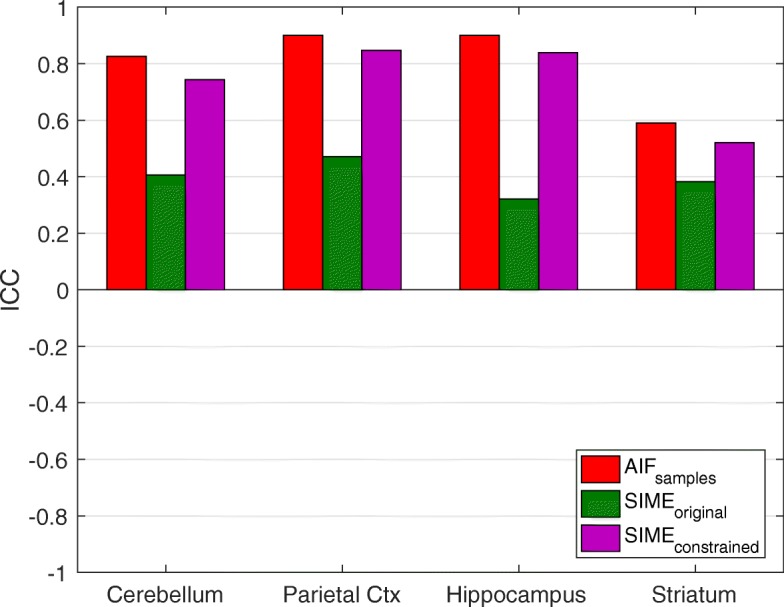
Results: In this work, we utilise an image-derived whole blood curve measurement to reduce the computational complexity of the simultaneous estimation method (SIME), which is capable of estimating the AIF directly from tissue time activity curves (TACs). This method was applied to data obtained from a serotonin receptor study (11C-SB207145) and estimated parameter results are compared to results obtained using the original SIME and gold standard AIFs derived from arterial samples. Reproducibility of the method was assessed using test-retest data. It was shown that the incorporation of image-derived information increased the accuracy of total volume of distribution (V T) estimates, averaged across all regions, by 40% and non-displaceable binding potential (BP ND) estimates by 16% compared to the original SIME. Particular improvements were observed in K1 parameter estimates. BP ND estimates, based on the proposed method and the gold standard arterial sample-derived AIF, were not significantly different (P=0.7).
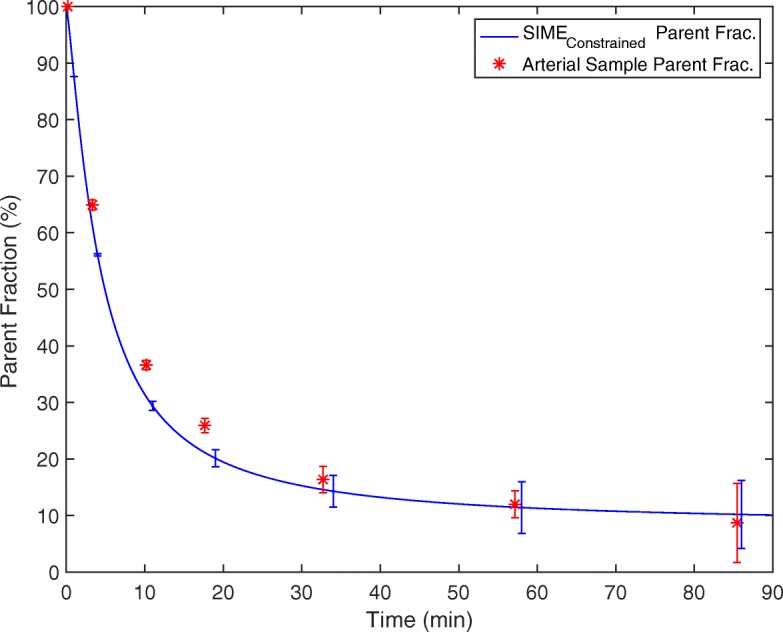
Conclusions: The results of this work indicate that the proposed method with prior AIF information obtained from a partial volume corrected image-derived whole blood curve, and modelled parent fraction, has the potential to be used as an alternative non-invasive method to perform kinetic analysis of tracers with metabolite products.
Keywords: Arterial input function; Kinetic modelling; PET/MR; Positron emission tomography.
Conflict of interest statement
Ethics approval and consent to participate
All procedures performed in studies involving human participants were in accordance with the ethical standards of the institutional and/or national research committee and with the 1964 Helsinki declaration and its later amendments or comparable ethical standards. The study was approved by the Ethics Committee for Copenhagen and Frederiksberg ((KfF)01-274821). Informed consent was obtained from all individual participants included in the study.
Consent for publication
All patients included gave written informed consent that their data could be used for scientific purposes.
Competing interests
The authors declare that they have no competing interests.
Publisher’s Note
Springer Nature remains neutral with regard to jurisdictional claims in published maps and institutional affiliations.
Figures
Similar articles
-
Non-invasive kinetic modelling approaches for quantitative analysis of brain PET studies.Eur J Nucl Med Mol Imaging. 2023 May;50(6):1636-1650. doi: 10.1007/s00259-022-06057-4. Epub 2023 Jan 18. Eur J Nucl Med Mol Imaging. 2023. PMID: 36651951 Free PMC article.
-
Simultaneous estimation of a model-derived input function for quantifying cerebral glucose metabolism with [18F]FDG PET.EJNMMI Phys. 2024 Jan 29;11(1):11. doi: 10.1186/s40658-024-00614-6. EJNMMI Phys. 2024. PMID: 38285319 Free PMC article.
-
Kinetic quantitation of cerebral PET-FDG studies without concurrent blood sampling: statistical recovery of the arterial input function.IEEE Trans Med Imaging. 2010 Mar;29(3):610-24. doi: 10.1109/TMI.2009.2029096. Epub 2009 Aug 25. IEEE Trans Med Imaging. 2010. PMID: 19709971 Free PMC article.
-
Development of a minimally invasive simultaneous estimation method for quantifying translocator protein binding with [18F]FEPPA positron emission tomography.EJNMMI Res. 2023 Jan 12;13(1):1. doi: 10.1186/s13550-023-00950-1. EJNMMI Res. 2023. PMID: 36633702 Free PMC article.
-
MRI-Driven PET Image Optimization for Neurological Applications.Front Neurosci. 2019 Jul 31;13:782. doi: 10.3389/fnins.2019.00782. eCollection 2019. Front Neurosci. 2019. PMID: 31417346 Free PMC article. Review.
Cited by
-
Non-invasive quantification of 18F-florbetaben with total-body EXPLORER PET.Res Sq [Preprint]. 2023 Dec 27:rs.3.rs-3764930. doi: 10.21203/rs.3.rs-3764930/v1. Res Sq. 2023. Update in: EJNMMI Res. 2024 Apr 16;14(1):39. doi: 10.1186/s13550-024-01104-7. PMID: 38234716 Free PMC article. Updated. Preprint.
-
A short 18F-FDG imaging window triple injection neuroimaging protocol for parametric mapping in PET.EJNMMI Res. 2024 Jan 2;14(1):1. doi: 10.1186/s13550-023-01061-7. EJNMMI Res. 2024. PMID: 38169031 Free PMC article.
-
Source-to-Target Automatic Rotating Estimation (STARE) - A publicly-available, blood-free quantification approach for PET tracers with irreversible kinetics: Theoretical framework and validation for [18F]FDG.Neuroimage. 2022 Apr 1;249:118901. doi: 10.1016/j.neuroimage.2022.118901. Epub 2022 Jan 10. Neuroimage. 2022. PMID: 35026425 Free PMC article.
-
Non-invasive [15O]H2O PET measurements of cerebral perfusion and cerebrovascular reactivity using an additional heart scan.J Cereb Blood Flow Metab. 2025 Jun;45(6):1144-1152. doi: 10.1177/0271678X251313743. Epub 2025 Jan 20. J Cereb Blood Flow Metab. 2025. PMID: 39829334 Free PMC article.
-
Non-invasive kinetic modelling approaches for quantitative analysis of brain PET studies.Eur J Nucl Med Mol Imaging. 2023 May;50(6):1636-1650. doi: 10.1007/s00259-022-06057-4. Epub 2023 Jan 18. Eur J Nucl Med Mol Imaging. 2023. PMID: 36651951 Free PMC article.
References
-
- Zanotti-Fregonara P, Fadaili EM, Maroy R, Comtat C, Souloumiac A, Jan S, Ribeiro MJ, Gaura V, Bar-Hen A, Trébossen R. Comparison of eight methods for the estimation of the image-derived input function in dynamic [(18)F]-FDG PET human brain studies. J Cereb Blood Flow Metab. 2009;29(11):1825–35. doi: 10.1038/jcbfm.2009.93. - DOI - PubMed
-
- Sari H, Erlandsson K, Law I, Larsson HB, Ourselin S, Arridge S, Atkinson D, Hutton BF. Estimation of an image derived input function with MR-defined carotid arteries in FDG-PET human studies using a novel partial volume correction method. J Cereb Blood Flow Metab. 2017;37(4):1398–409. doi: 10.1177/0271678X16656197. - DOI - PMC - PubMed
Grants and funding
LinkOut - more resources
Full Text Sources
Other Literature Sources
