. 2019 Apr;8(4):e00670.
doi: 10.1002/mbo3.670. Epub 2018 Jul 3.

Gut microbial diversity in two insectivorous bats: Insights into the effect of different sampling sources

Affiliations

Gut microbial diversity in two insectivorous bats: Insights into the effect of different sampling sources

Haonan Wu et al. Microbiologyopen. 2019 Apr.

Abstract

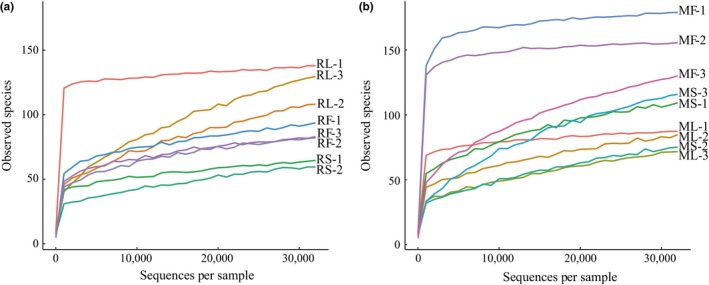
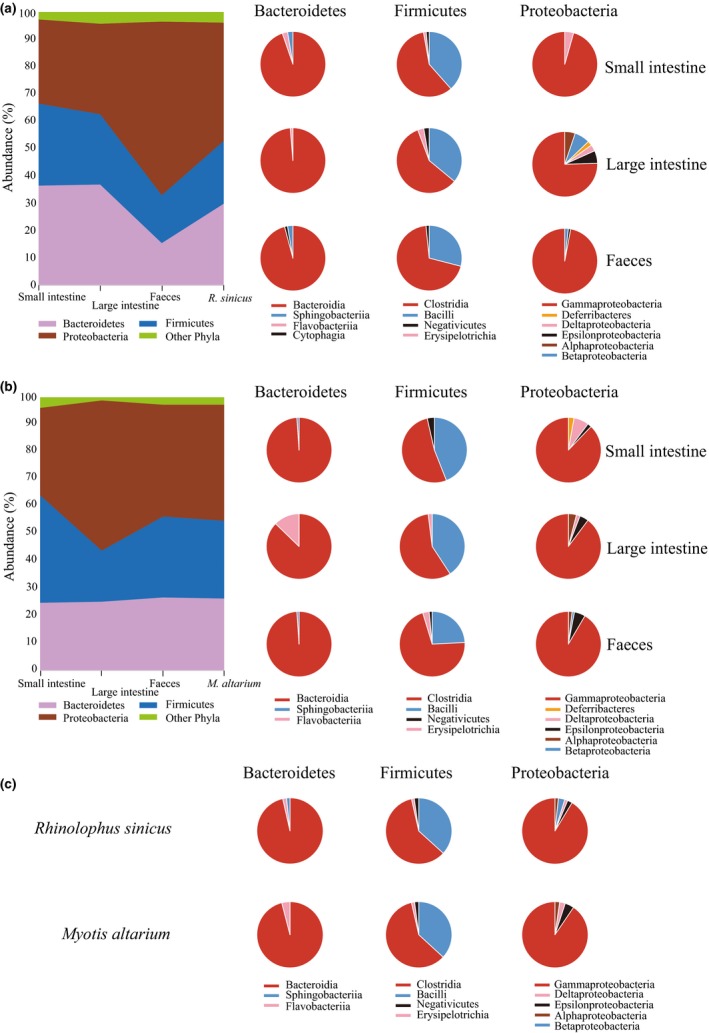
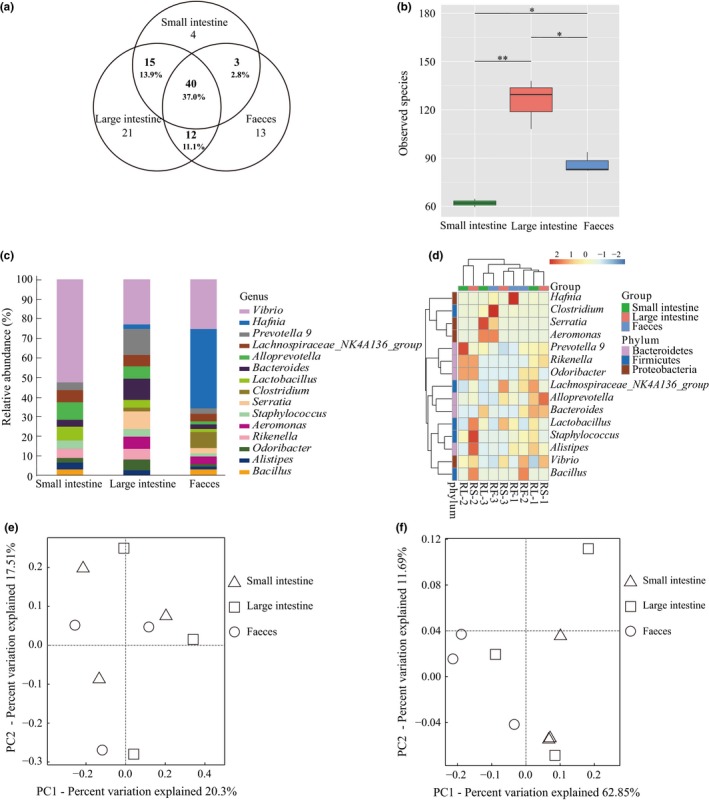
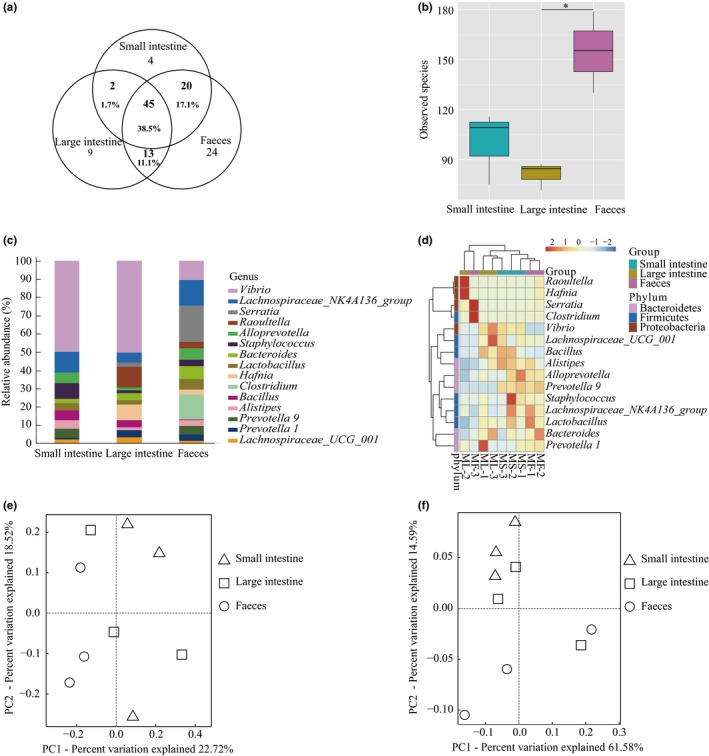
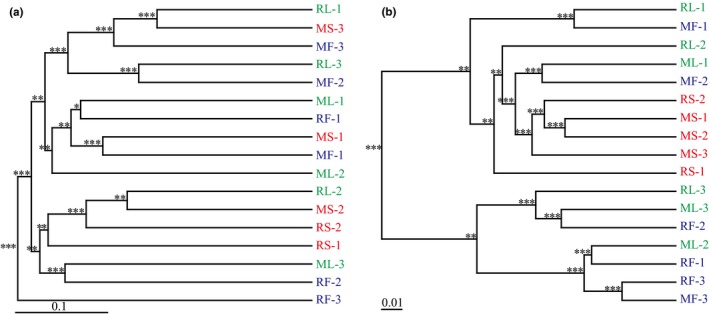
The gut microbiota is now known as a key factor in mammalian physiology and health. Our understanding of the gut microbial communities and their effects on ecology and evolution of their hosts is extremely limited in bats which represent the second largest mammalian order. In the current study, gut microbiota of three sampling sources (small intestine, large intestine, and feces) were characterized in two sympatric and insectivorous bats (Rhinolophus sinicus and Myotis altarium) by high-throughput sequencing of the V3-V4 region of the 16S rRNA gene. Combining with published studies, this work reveals that Gammaproteobacteria may be a dominant class in the whole Chiroptera and Fusobacteria is less observed in bats although it has been proven to be dominant in other mammals. Our results reveal that the sampling source influences alpha diversity of the microbial community in both studied species although no significant variations of beta diversity were observed, which support that fecal samples cannot be used as a proxy of the microbiota in other gut regions in wild animals.

Keywords: Myotis altarium; Rhinolophus sinicus; 16S rRNA; gut microbiota.


Conflict of interest statement

None declared.

Figures

Figure 1
Figure 1
Rarefaction analysis of gut bacteria sequencing of the 16S rRNA gene in different samples of R. sinicus and M. altarium. (a) Rarefaction curves of eight samples in R. sinicus at 32,010 sequences depth. (b) Rarefaction curves of nine samples in M. altarium at 32,010 sequences depth
Figure 2
Figure 2
Bacteria community composition and relative abundance at the phyla and class levels in (a) R. sinicus and (b) M. altarium. (c) Pie charts show relative abundances of bacterial classes with an abundance of > 1% in three dominated phyla in R. sinicus and M. altarium
Figure 3
Figure 3
Comparisons of the microbial community composition and abundance in three sampling sources of R. sinicus. (a) Venn diagrams of shared genera in three sampling sources. (b) Statistical comparisons of alpha diversity (measured by the total number of observed species) of microbiota among the three sampling sources at 32,010 sequences depths. *p < 0.05, **p < 0.01. (c) Relative abundances of the top 15 genera in three sampling sources. (d) Heatmap of the top 15 abundance genera in three sampling sources. Principal coordinates analysis (PCoA) of all three microbial communities of R. sinicus regions based on unweighted UniFrac distances (e) and weighted UniFrac distances (f)
Figure 4
Figure 4
Comparisons of the microbial community composition and abundance in three sampling sources of M. altarium. (a) Venn diagrams of shared genera in three sampling sources. (b) Statistical comparisons of alpha diversity (measured by the total number of observed species) of microbiota among the three sampling sources at 32,010 sequences depth. *p < 0.05. (c) Relative abundances of the top 15 genera in three sampling sources. (d) Heatmap of the top 15 abundance genera in three sampling sources. Principal coordinates analysis (PCoA) of three microbial communities of M. altarium based on unweighted UniFrac distances (e) and weighted UniFrac distances (f)
Figure 5
Figure 5
UPGMA clustering analysis of three gut microbial communities of R. sinicus and M. altarium. (a) Unweighted UniFrac distances. (b) Weighted UniFrac distances. In both trees, samples from the small intestine, large intestine, and feces are coded by red, green, and blue, respectively. Asterisks in the node represent confidence values: *** 75%~100%, ** 50%~75%, * 25%~50%

Similar articles

Cited by

References

    1. Annan, A. , Baldwin, H. J. , Corman, V. M. , Klose, S. M. , Owusu, M. , Nkrumah, E. E. , … Oppong, S. (2013). Human betacoronavirus 2c EMC/2012–related viruses in bats, Ghana and Europe. Emerging Infectious Diseases, 19, 456–459. 10.3201/eid1903.121503 - DOI - PMC - PubMed
    1. Banskar, S. , Mourya, D. T. , & Shouche, Y. S. (2016). Bacterial diversity indicates dietary overlap among bats of different feeding habits. Microbiological Research, 182, 99–108. 10.1016/j.micres.2015.10.006 - DOI - PubMed
    1. Berger, S. A. , Krompass, D. , & Stamatakis, A. (2011). Performance, accuracy, and web server for evolutionary placement of short sequence reads under maximum likelihood. Systematic Biology, 60(3), 291–302. 10.1093/sysbio/syr010 - DOI - PMC - PubMed
    1. Blaxter, M. , Mann, J. , Chapman, T. , Thomas, F. , Whitton, C. , Floyd, R. , & Abebe, E. (2005). Defining operational taxonomic units using DNA barcode data. Philosophical Transactions of the Royal Society B: Biological Sciences, 360, 1935–1943. 10.1098/rstb.2005.1725 - DOI - PMC - PubMed
    1. Bolger, A. M. , Lohse, M. , & Usadel, B . (2014). Trimmomatic: A flexible trim‐mer for Illumina sequence data. Bioinformatics, 30, 2114–2120. 10.1093/bioinformatics/btu170 - DOI - PMC - PubMed

Publication types

LinkOut - more resources