. 2018 Aug 3;17(8):2623-2634.
doi: 10.1021/acs.jproteome.8b00086. Epub 2018 Jul 18.

Multifunctional Activity-Based Protein Profiling of the Developing Lung

Affiliations

Multifunctional Activity-Based Protein Profiling of the Developing Lung

Ethan G Stoddard et al. J Proteome Res. .

Abstract

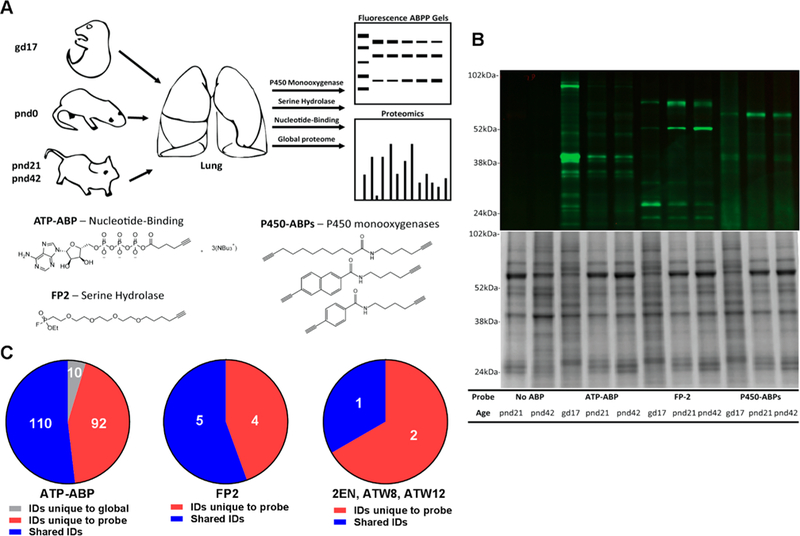
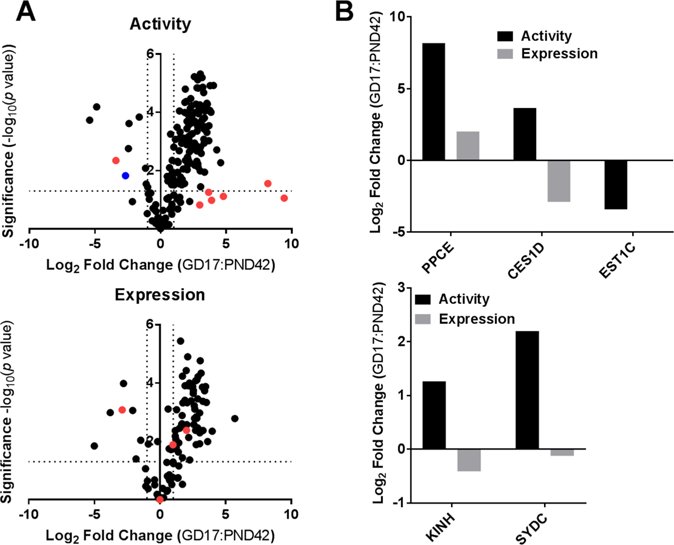
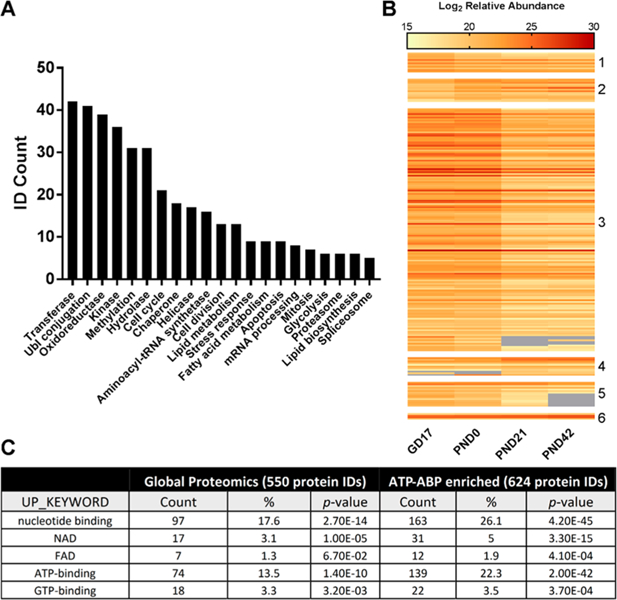
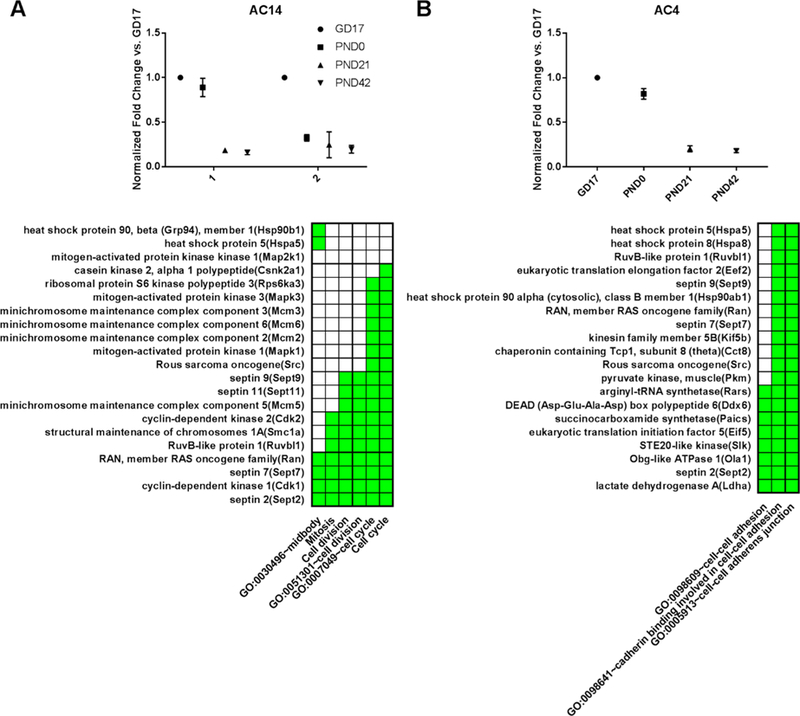
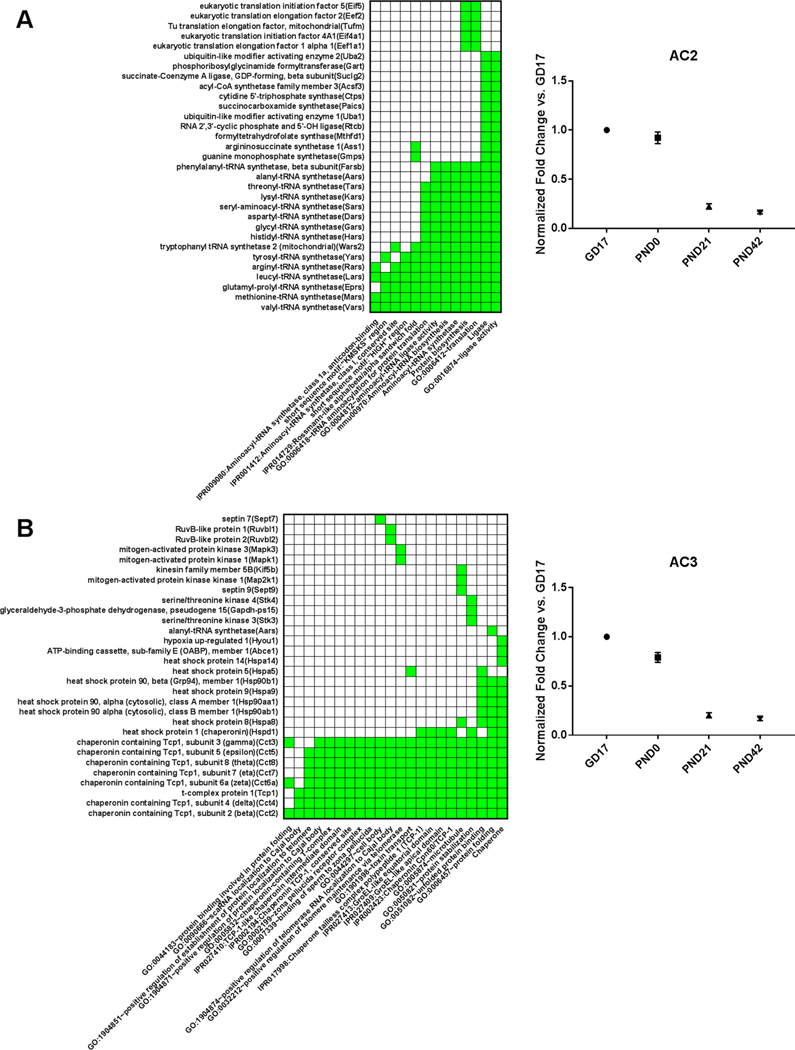
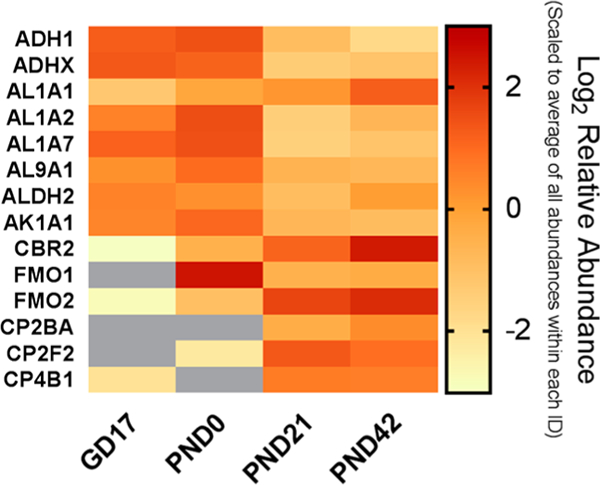
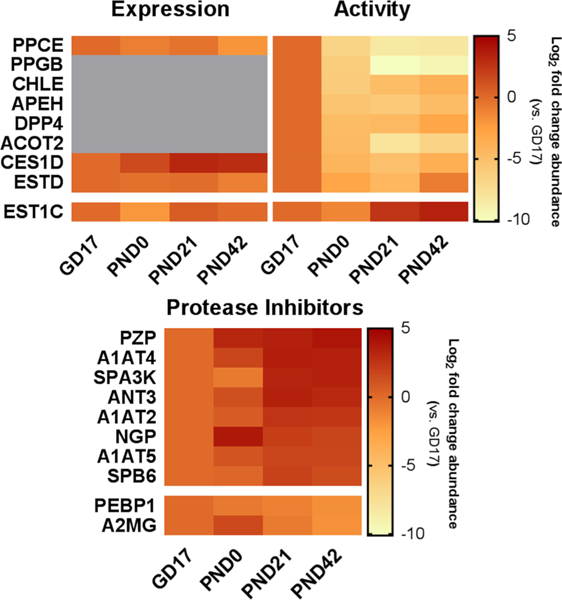
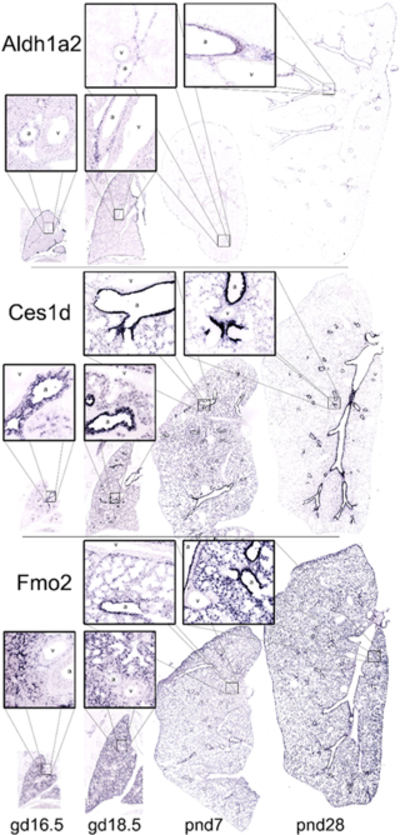
Lung diseases and disorders are a leading cause of death among infants. Many of these diseases and disorders are caused by premature birth and underdeveloped lungs. In addition to developmentally related disorders, the lungs are exposed to a variety of environmental contaminants and xenobiotics upon birth that can cause breathing issues and are progenitors of cancer. In order to gain a deeper understanding of the developing lung, we applied an activity-based chemoproteomics approach for the functional characterization of the xenometabolizing cytochrome P450 enzymes, active ATP and nucleotide binding enzymes, and serine hydrolases using a suite of activity-based probes (ABPs). We detected P450 activity primarily in the postnatal lung; using our ATP-ABP, we characterized a wide range of ATPases and other active nucleotide- and nucleic acid-binding enzymes involved in multiple facets of cellular metabolism throughout development. ATP-ABP targets include kinases, phosphatases, NAD- and FAD-dependent enzymes, RNA/DNA helicases, and others. The serine hydrolase-targeting probe detected changes in the activities of several proteases during the course of lung development, yielding insights into protein turnover at different stages of development. Select activity-based probe targets were then correlated with RNA in situ hybridization analyses of lung tissue sections.

Keywords: activity-based protein profiling; chemoproteomics; lung development.


Conflict of interest statement

The authors declare no competing financial interest.

Figures

Figure 1.
Figure 1.
(A) Overview of experimental processes and subsequent analysis and structures of the activity-based probes ATP-ABP, FP2, and P450-ABPs. (B) SDS-PAGE gel of in vitro probe labeled murine lung proteome using 10 μM ATP-ABP, FP2, and P450-ABPs: 2EN, ATW8, ATW12. Following probe labeling, rhodamine azide was appended onto the probe:protein complexes via click chemistry and 10 μg protein per lane was loaded onto the gel cassette followed by SDS-PAGE and fluorescence imaging of probe-labeled protein (top). Gels were then stained using GelCode Blue and total protein stain was imaged using Bio-Rad (bottom). (C) Comparative analysis of functional enrichment of identified proteins from probe-enriched murine lung versus corresponding global proteomes.
Figure 2.
Figure 2.
(A) Volcano plots of activity-based (top) and global (bottom) log2 fold change AMT abundances and significance (t test) of identified proteins from gd17 versus pnd42. Horizontal dotted line is plotted where p = 0.05. Vertical lines placed at fold change = 2. Red dots indicate FP-2 targets, blue indicates P450-ABP targets, and black shows ATP-ABP targets. (B) Log2 fold change abundances of gd17/pnd42 from global vs ABP analysis. Selected serine proteases (top) and nucleotide-binding (bottom) proteins shown are those whose expression does not significantly change but activity is significantly altered (p < 0.05, F.C > 2).
Figure 3.
Figure 3.
(A) Representative UP_KEYWORDS enriched from nucleotide-binding proteins from ATP-ABP enriched lung proteome. (B) Heatmap of relative abundances of proteins from the DAVID functional enrichment of ATP-ABP lung samples. Protein IDs are grouped on the basis of largest abundance differences between developmental stage and whether this change is positive or negative (with increasing development). 1: largest change between gd17 and pnd0, negative; 2: between gd17 and pnd0, positive; 3: between pnd0 and pnd21, negative; 4: between pnd0 and pnd21, positive; 5: between pnd21 and pnd42, negative; 6: between pnd21 and pnd42, positive. (C) Comparative functional DAVID enrichment of nucleotide-, NAD-, FAD-, ATP-, GTP-binding proteins from ATP-ABP enriched and global lung proteome.
Figure 4.
Figure 4.
DAVID functional annotation clusters (AC) from DAVID analysis of active nucleotide-binding proteins with significant decreases in relative abundances between gd17 and pnd42. Also included in the functional analysis are proteins with data in gd17 samples and without in pnd42 samples. Heatmaps of the DAVID analysis shown on bottom, average fold change vs gd17 of proteins within each individual cluster at each devo stage plotted as line graph on top. Results from clusters 4 (left) and 14 (right) shown. Error bars represent standard error of the mean.
Figure 5.
Figure 5.
DAVID functional annotation clusters (AC) from DAVID analysis of active nucleotide-binding proteins with significant decreases in relative abundances between gd17 and pnd42. Also included in the functional analysis are proteins with data in gd17 samples and without in pnd42 samples. Heatmaps of the DAVID analysis shown on bottom, average fold change vs gd17 of proteins within each individual cluster at each devo stage plotted as line graph on top. Results from clusters 2 (top) and 3 (bottom) shown. Error bars represent standard error of the mean.
Figure 6.
Figure 6.
Heatmap depicting relative log2 abundances of ATP-ABP and P450-ABP enriched proteins involved in xenobiotic metabolism. Log2 abundances shown are scaled to the average of all abundance values within each individual protein ID. Gray blocks indicate lack of abundance data at those developmental stages.
Figure 7.
Figure 7.
Heatmaps depicting log2 fold change abundances (versus GD17) of serine protease expression via global analysis (left) and activity analysis (right) as well as expression of serine protease inhibitors (bottom). Gray blocks indicate lack of abundance data at those developmental stages.
Figure 8.
Figure 8.
Results from in situ hybridization indicating expression of Aldh1a2, Ces1d, and Fmo2 in pre- and postnatal lung tissue slices. “a” and “v” indicate airways and vasculature, respectively.

Similar articles

Cited by

References

    1. Kochanek KD; Murphy SL; Xu JQ; Arias E Mortality in the United States, 2016; National Center for Health Statistics: Hyattsville, MD, 2017; NCHS Data Brief No. 293.
    1. Sadler NC; Nandhikonda P; Webb-Robertson B-J; Ansong C; Anderson LN; Smith JN; Corley RA; Wright AT Hepatic Cytochrome P450 Activity, Abundance, and Expression Throughout Human Development. Drug Metab. Dispos 2016, 44 (7), 984–991. - PMC - PubMed
    1. Speers AE; Cravatt BF Activity-Based Protein Profiling (ABPP) and Click Chemistry (CC)-ABPP by MudPIT Mass Spectrometry. Curr. Protoc. Chem. Biol 2009, 1, 29–41. - PMC - PubMed
    1. Pond SM; Tozer TN First-Pass Elimination Basic Concepts and Clinical Consequences. Clin. Pharmacokinet 1984, 9 (1), 1–25. - PubMed
    1. Zhang JY; Wang Y; Prakash C Xenobiotic-metabolizing enzymes in human lung. Curr. Drug Metab 2006, 7 (8), 939–48. - PubMed

Publication types

LinkOut - more resources