

Frequency-specific alterations of regional homogeneity in subcortical stroke patients with different outcomes in hand function
- PMID: 29972261
- PMCID: PMC6866647
- DOI: 10.1002/hbm.24277
Frequency-specific alterations of regional homogeneity in subcortical stroke patients with different outcomes in hand function
Abstract
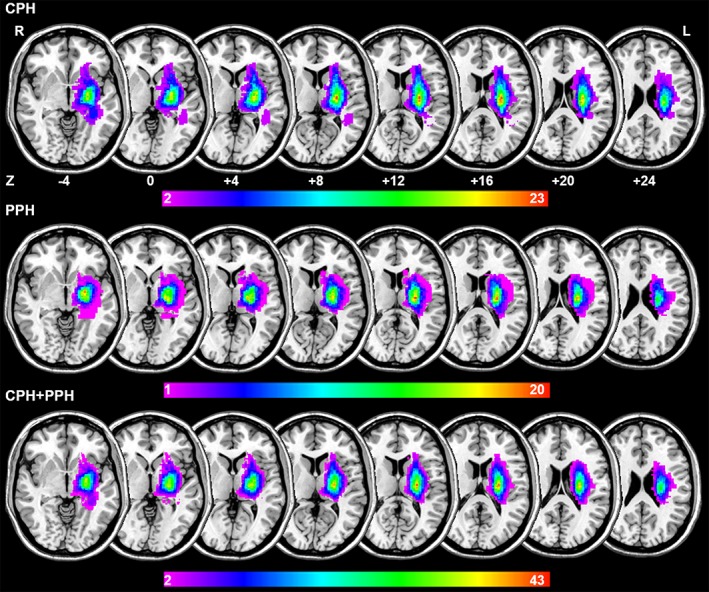
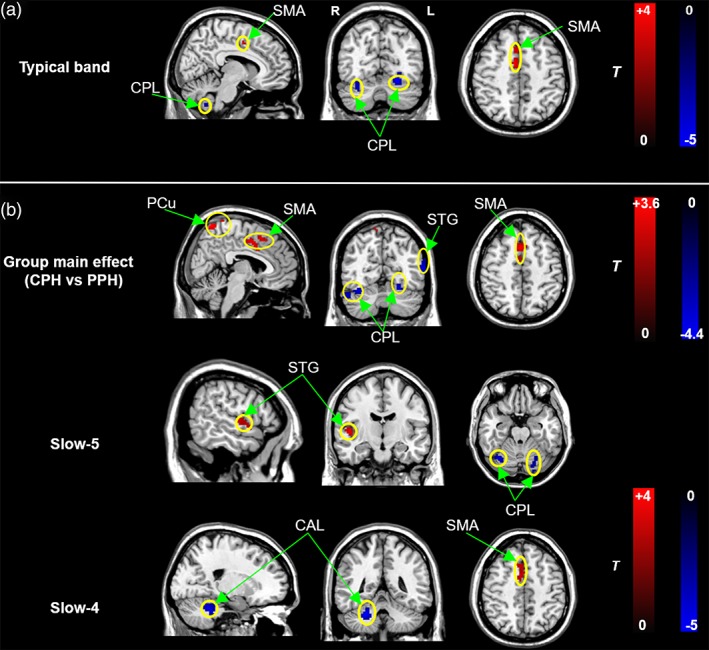
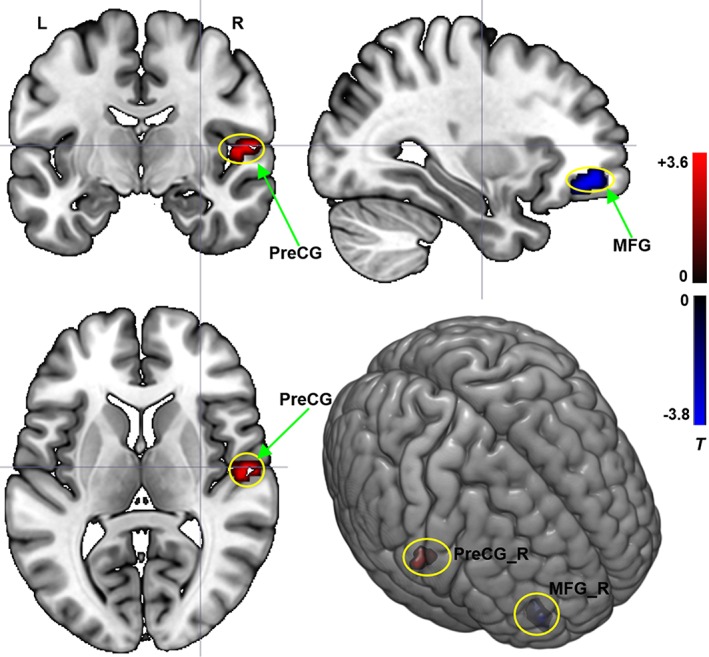
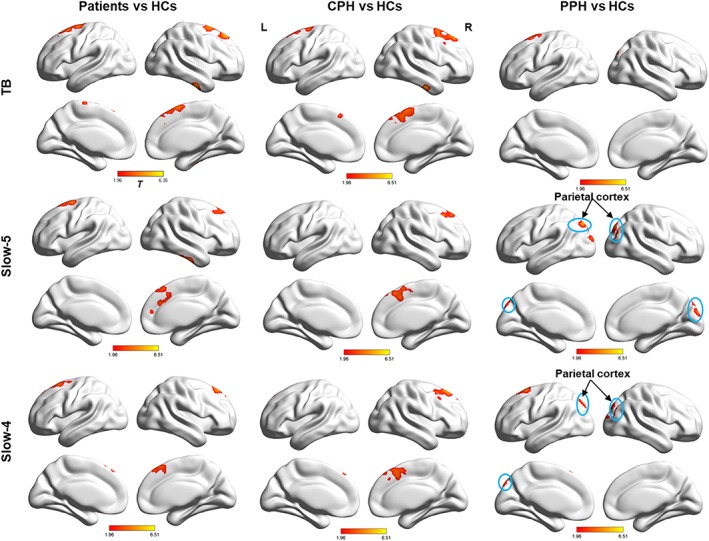
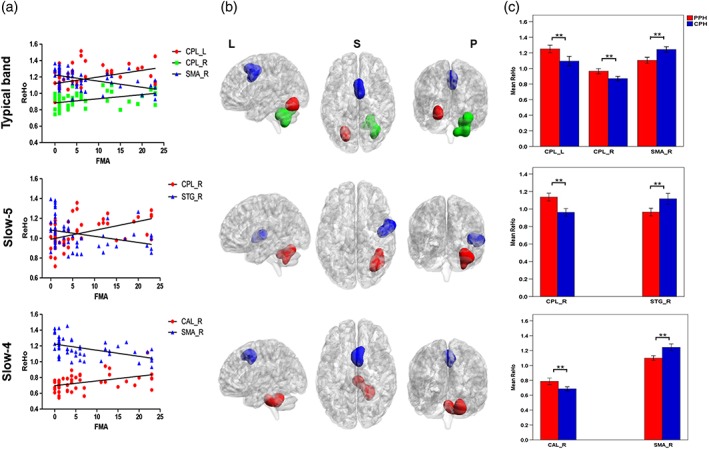
Emerging evidence has suggested that abnormalities in regional spontaneous brain activity following stroke may be detected by intrinsic low-frequency oscillations (LFO) in resting-state functional MRI (R-fMRI). However, the relationship between hand function outcomes following stroke and local LFO synchronization in different frequency bands is poorly understood. In this study, we performed R-fMRI to examine the regional homogeneity (ReHo) at three different frequency bands (slow-5: .01-.027 Hz; slow-4: .027-.08 Hz; and typical band: .01-.1 Hz) in 26 stroke patients with completely paralyzed hands (CPH) and 26 matched patients with partially paralyzed hands (PPH). Compared to the PPH group, decreased ReHo in the bilateral cerebellum posterior lobes and the contralesional cerebellum anterior lobe was observed in the slow-5 band and the slow-4 band in the CPH group, respectively. The mean ReHo values in these regions were positively correlated with the Fugl-Meyer assessment (FMA) scores. In contrast, increased ReHo in the contralesional supplementary motor area and the contralesional superior temporal gyrus was observed in the slow-4 band and the slow-5 band, respectively. The mean ReHo values in these regions were negatively correlated with the FMA scores. Importantly, significant interactions were identified between the frequency bands and the subgroups of patients in the contralesional precentral gyrus and middle frontal gyrus. These findings indicate that frequency-dependent R-fMRI patterns may serve as potential biomarkers of the neural substrates associated with hand function outcomes following stroke.
Keywords: completely paralyzed hands; frequency-dependent; partially paralyzed hands; regional homogeneity; resting-state fMRI; stroke.
© 2018 Wiley Periodicals, Inc.
Figures
References
-
- Alexander, G. E. , DeLong, M. R. , & Strick, P. L. (1986). Parallel organization of functionally segregated circuits linking basal ganglia and cortex. Annual Review of Neuroscience, 9, 357–381. - PubMed
-
- Amengual, J. L. , Münte, T. F. , Marco‐Pallarés, J. , Rojo, N. , Grau‐Sánchez, J. , Rubio, F. , … Rodríguez‐Fornells, A. (2014). Overactivation of the supplementary motor area in chronic stroke patients. Journal of Neurophysiology, 112, 2251–2263. - PubMed
-
- Ashburner, J. , & Friston, K. J. (2005). Unified segmentation. NeuroImage, 26, 839–851. - PubMed
Publication types
MeSH terms
LinkOut - more resources
Full Text Sources
Other Literature Sources
Research Materials
