. 2019 Jul;39(7):1394-1409.
doi: 10.1177/0271678X18785480. Epub 2018 Jul 4.

Preconditioning with partial caloric restriction confers long-term protection against grey and white matter injury after transient focal ischemia

Affiliations

Preconditioning with partial caloric restriction confers long-term protection against grey and white matter injury after transient focal ischemia

Jia Zhang et al. J Cereb Blood Flow Metab. 2019 Jul.

Abstract

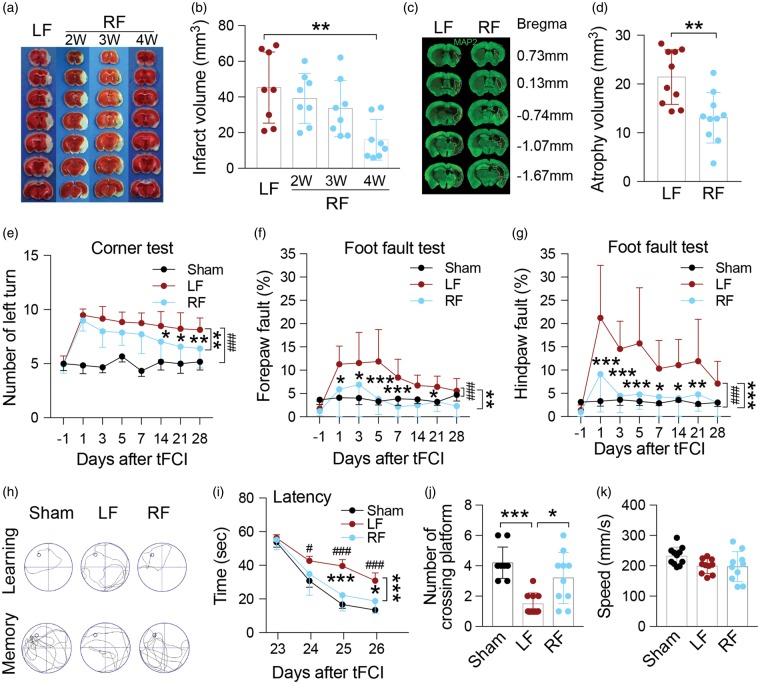
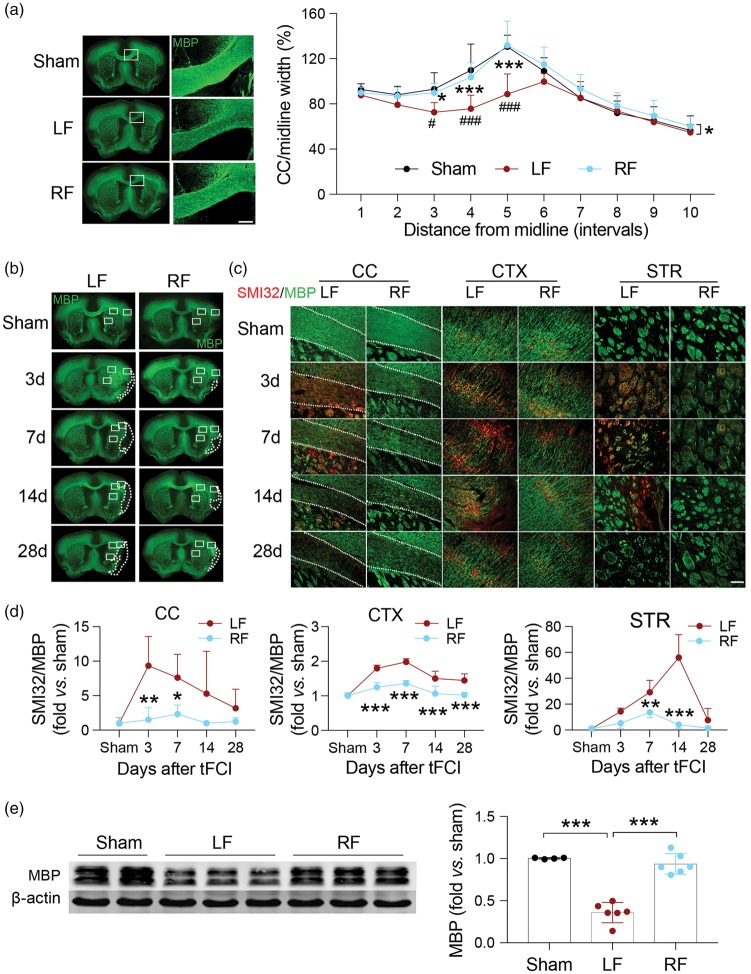
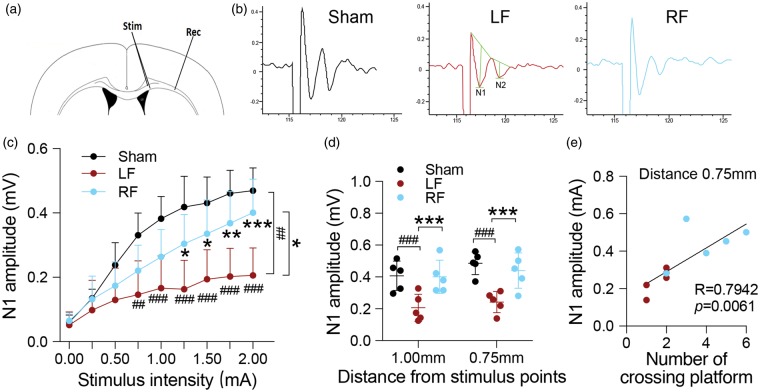
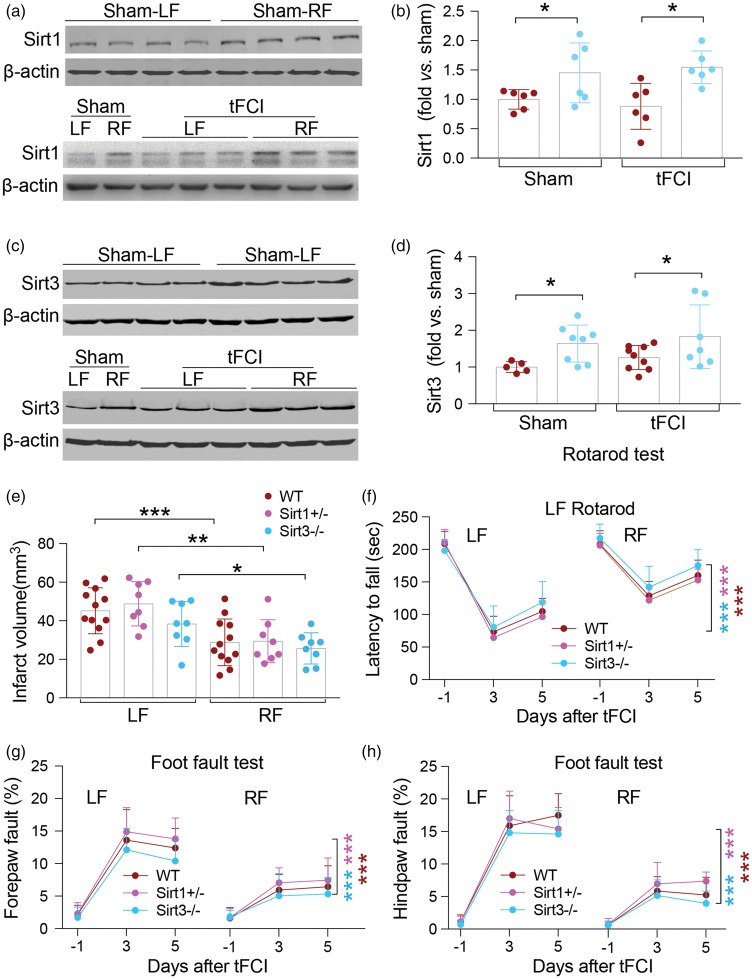
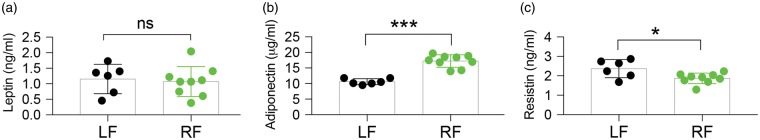
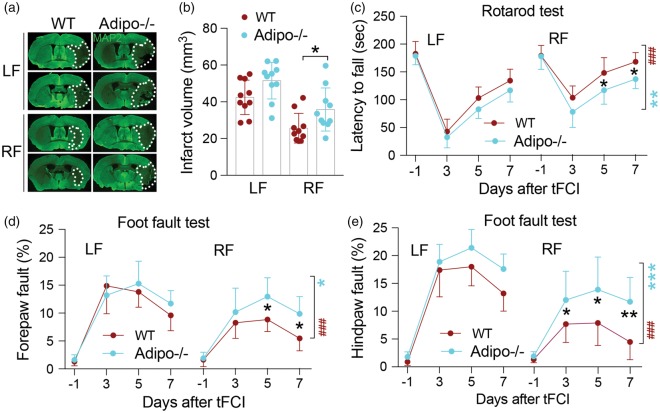
Caloric restriction (CR) has been extensively examined as a preventative strategy against aging and various diseases, but CR effects on cerebral ischemia are largely unknown. We subjected C57BL6/J mice to ad libitum food access (LF) or a diet restricted to 70% of ad libitum food access (RF) for two to four weeks followed by 60 min of transient focal ischemia (tFCI). RF for four weeks protected against subsequent tFCI-induced infarct. RF improved sensorimotor function after stroke in the foot fault and corner tests, as well as performance in the Morris water maze test. In addition, RF preserved ischemic white matter tract integrity assessed by histology and compound action potential. Sirt1 and Sirt3 were both upregulated in RF ischemic brain, but heterozygous deletion of Sirt1 or knockout of Sirt3 did not alter the protection induced by RF against ischemic injury. RF induced significant release of adiponectin, a hormone related to glucose metabolism. Knockout of adiponectin decreased RF-induced protection after tFCI. These data demonstrate the novel finding that white matter, as well as neurons, benefit from CR prior to cerebral ischemic injury, and that adiponectin may contribute to these protective effects.

Keywords: Adiponectin; caloric restriction; cerebral ischemia; sirtuin; stroke.


Figures

Figure 1.
Figure 1.
Food restriction decreases infarct and atrophy volume, and alleviates neurological deficits induced by tFCI. (a) Representative brain images of TTC staining after tFCI of mice maintained on an ad libitum (LF) or restricted diet (RF). (b) Quantification of infarct volume indicating four weeks of RF was required for reduction of infarct volume after tFCI. n = 8 mice/group. **p ≤ 0.01 vs. LF. (c) Representative immunofluorescent images of brain slices stained for MAP2 28 days after tFCI. Dashed lines indicate area of brain atrophy. (d) Quantification of atrophy volume indicating that four weeks of RF-feeding reduces atrophy volume. n = 10 mice/group, **p ≤ 0.01 vs. LF. (e–g) Sensorimotor function and asymmetry as assessed by the corner test (e) and foot fault test (f, g) were improved after tFCI with RF-feeding for four weeks. n = 8 for sham, n = 12 mice/tFCI group. *p ≤ 0.05, **p ≤ 0.01 ***p ≤ 0.001 vs. LF, ###p ≤ 0.001 vs. sham. (h) Representative swim path from each treatment group during the spatial learning (top panel) and memory phase (bottom panel) of the Morris water maze test. (i) Latency in seconds (s) to find the submerged platform assessed during days 23–26 after tFCI shows that learning was improved in mice fed the RF diet. (j) Quantification on day 27 of the number of crossings over the region where the platform used to be indicates that memory was improved in RF-fed mice following tFCI. (k) Swimming speed during the probe test indicating no differences in gross motor function among groups. For i–k: n = 11 mice/sham group, n = 10 mice/ LF group, n = 10 mice/RF group. *p ≤ 0.05, ***p ≤ 0.001 vs. LF group, #p ≤ 0.05, ###p ≤ 0.001 vs. sham. All data are presented as mean ± SD.
Figure 2.
Figure 2.
White matter integrity is better preserved in ischemic mice with food restriction. (a) Representative images of MBP immunofluorescent staining of sham (top row) and tFCI mice given LF or RF (middle and bottom rows, respectively) 28 days after ischemic insult. The ischemia-induced reduction in CC thickness is prevented by RF. The white boxes indicate areas that were enlarged in high-power images (right column, scale bar = 200 µm). Quantification of the width of the CC indicates that RF maintained the width of CC 28 days after tFCI. n = 4–7 for each group. *p ≤ 0.05, ***p ≤ 0.001 vs. LF; #p ≤ 0.05, ###p ≤ 0.001 vs. sham. (b) Representative immunofluorescent images of sections from each treatment group stained with MBP. Dashed line depicts brain infarct. (c) Representative high-power images of regions depicted in white rectangles in (b) from each treatment stained with MBP (green) and SMI32 (red). Dashed line depicts the border of the CC. Scale bar = 100 µm. (d) Quantification of the ratio of SMI32/MBP fluorescence intensity in corpus callosum (CC), cortex (CTX) and striatum (STR) of the ipsilateral hemisphere after tFCI indicates that RF-feeding preserves white matter integrity in ischemic mice. n = 5 mice/group at each time point. *p ≤ 0.05, **p ≤ 0.01, ***p ≤ 0.001 vs. LF. (e) Representative image of Western blot for MBP in corpus callosum of ipsilateral hemisphere (left panel).  β-Actin was used as loading control. Semi-quantification of bands relative to sham mice (right panel) shows that RF prevented ischemia-induced loss of MBP. n = 4–6/group. ***p ≤ 0.001. All data are presented as mean ± SD.
Figure 3.
Figure 3.
RF preserves functional integrity of white matter tracts after tFCI. (a) Illustration of the position of stimulating and recording electrodes in the CC. (b) Representative traces of evoked CAP in CC (stimulus 2.0 mA, 1.0 mm lateral to the stimulating electrode) at 28 days after tFCI. (c) Recording of the N1 amplitudes as a function of stimulus intensity indicates that RF partially restored sensitivity to the stimulus intensity in the myelinated (N1) tracts. (d) Recording of the N1 amplitudes in response to a 2.0-mA stimulus at different distances (1.0 mm and 0.75 mm) lateral to the stimulating electrode in sham and ischemic LF- and RF-fed mice at 28 days post-tFCI shows that RF restored N1 sensitivity as the distance between the recording and stimulating electrode was increased. No significant difference was detected between LF and RF sham group (data not shown). For c, d *p ≤ 0.05, **p ≤ 0.01, ***p ≤ 0.001 vs. LF mice; ##p ≤ 0.01, ###p ≤ 0.001 vs. sham. (e) The amplitude of N1 recorded at 0.75 mm lateral to the stimulating electrode in response to 2.0-mA stimulus was correlated with spatial memory test (number of crossing over the area that formerly contained the platform) at 27 days after tFCI using Pearson linear regression analysis. Data are expressed as mean ± SD. n = 5 mice/group.
Figure 4.
Figure 4.
Sirt1 and Sirt3 are upregulated in RF ischemic mouse brain but are not critical for RF-induced ischemic protection. (a, c) Representative Western blot images of Sirt1 (a) and Sirt3 (c) in sham and ischemic mice fed the LF or RF diet.  β-Actin was used as loading control. (b, d) Semi-quantification of bands shows significant upregulation of Sirt1 (b; n = 6 mice per group) and Sirt3 (d; n = 5–9 mice per group) in sham-operated RF-fed and ischemic RF-fed mice. *p ≤ 0.05 between indicated groups. (e–g) Reduction of either Sirt1 (Sirt1+/−) or knockout of Sirt3 (Sirt3−/−) did not alter protection afforded by RF prior to tFCI as assessed by infarct volume (e), performance on the rotarod (f) or the foot fault test (g, h). No significant differences were detected on latency to fall (rotarod test) or forepaw and hindpaw fault rate (foot fault test) between WT and Sirt1+/−or between WT and Sirt3−/− mice within five days after tFCI in LF and RF mice. *p ≤ 0.05, **p ≤ 0.01, ***p ≤ 0.001 vs. indicated LF group. Brackets indicate comparisons within genotypes between LF and RF treatment (dark red, WT; light red, Sirt1+/−; blue, Sirt3−/−). ***p ≤ 0.001 RF vs. LF in each genotype. Data are expressed as mean ± SD. n = 12 for WT group, and n = 8 for Sirt1+/− and Sirt3−/− mice, respectively.
Figure 5.
Figure 5.
RF alters the levels of adiponectin and resistin in blood circulation. (a–c) Assessment of plasma protein levels of leptin (a), adiponectin (b), and resistin (c) by ELISA after four-week treatment with LF or RF indicates that RF-feeding altered circulating levels of adiponectin and resistin. Data are mean ± SD. n = 6 for LF and n = 9 for RF group. *p ≤ 0.05, ***p ≤ 0.001, vs. LF; ns = no significant difference.
Figure 6.
Figure 6.
Adiponectin contributes to RF-induced neuroprotection against tFCI. (a) Representative immunofluorescent images of MAP2 staining seven days after tFCI in wild-type (WT) and adiponectin knockout (Adipo−/−) mice. Dashed line depicts infarct region. (b) Measurement of infarct volume in WT and Adipo−/− mice indicates that knockout of adiponectin exacerbates ischemic injury in RF-fed mice. No significant difference was detected between WT and Adipo−/− in LF-fed mice. n = 10/group, *p ≤ 0.05 between groups as indicated. (c–e) Sensorimotor deficits induced by tFCI were significantly alleviated in both wild type and Adipo−/− mice pretreated with RF within seven days after ischemic insult. RF-induced improvements in sensorimotor function as assessed in the rotarod (c) and grid walking test (d, e) were partly abolished by knockout of adiponectin. *p ≤ 0.05, **p ≤ 0.01 between groups as indicated. Brackets indicate comparisons within genotypes between LF and RF treatment (red, WT; blue, Adipo−/−). *p ≤ 0.05, **p ≤ 0.01, ***p ≤ 0.001 Adipo−/− RF vs. Adipo−/− LF; ###p ≤ 0.001 WT RF vs. WT LF. Data are mean ± SD. n = 10 mice per group.
Figure 7.
Figure 7.
Adiponectin contributes to the preservation of white matter after tFCI. (a) Representative images of SMI32 and MBP double staining in corpus callosum (CC) and striatum (STR) in wild-type and adiponectin knockout (Adipo−/−) mice, subjected to either LF or RF, then sacrificed following seven days after tFCI. Scale bar = 50 µm. (b) Knockdown of adiponectin abolishes the RF protection of myelination in CC and STR as assessed by quantification of SMI32/MBP ratio. **p < 0.01; n = 10 per group. (c) Representative images of double-labeling of adiponectin receptor 1 (AdipoR1, red) with mature oligodendrocyte (APC, green) markers in CC and STR of LF and RF mice at seven days after tFCI. White boxes indicate areas in high-power images in (e). Scale bar = 25 µm. (d) Representative image of MBP immunofluorescence (green) at seven days after tFCI. The white boxes depict the peri-infarct area in CC and striatum (STR), whereas high-power images were taken in (c) Scale bar = 1 mm. (e) Enlarged areas in CC and STR depicting co-labeling with APC (green), AdipoR1 (red), and DAPI (blue). Arrow: APC+/AdipoR1+ cells. Scale bar = 25 µm. (f) Quantification of APC+/AdipoR1+ cells indicates that RF-fed increases the number of APC+/AdipoR1+ cells in STR in sham-treated mice, and in the CC and STR of ischemic-mice. n = 5 mice per group. Data are represented as mean ± SD, *p ≤ 0.05, **p ≤ 0.01 between groups as indicated; ns means no significant difference.

References

    1. Fontana L, Partridge L. Promoting health and longevity through diet: from model organisms to humans. Cell 2015; 161: 106–118. - PMC - PubMed
    1. Stranahan AM, Mattson MP. Metabolic reserve as a determinant of cognitive aging. J Alzhimers Dis 2012; 30(Suppl 2): S5–S13. - PMC - PubMed
    1. de Lucia C, Gambino G, Petraglia L, et al. Long-term caloric restriction improves cardiac function, remodeling, adrenergic responsiveness, and sympathetic innervation in a model of postischemic heart failure. Circ Heart Fail 2018; 11: e004153. - PMC - PubMed
    1. Kondo M, Shibata R, Miura R, et al. Caloric restriction stimulates revascularization in response to ischemia via adiponectin-mediated activation of endothelial nitric-oxide synthase. J Biol Chem 2009; 284: 1718–1724. - PMC - PubMed
    1. Lanza IR, Zabielski P, Klaus KA, et al. Chronic caloric restriction preserves mitochondrial function in senescence without increasing mitochondrial biogenesis. Cell Metab 2012; 16: 777–788. - PMC - PubMed

Publication types

MeSH terms

LinkOut - more resources