. 2018 Aug;48(4):1976-1989.
doi: 10.1111/ejn.14062. Epub 2018 Jul 26.

A loss of a velocity-duration trade-off impairs movement precision in patients with cerebellar degeneration

Affiliations

A loss of a velocity-duration trade-off impairs movement precision in patients with cerebellar degeneration

Akshay Markanday et al. Eur J Neurosci. 2018 Aug.

Abstract

Current theories discussing the role of the cerebellum have been consistently pointing towards the concept of motor learning. The unavailability of a structure for motor learning able to use information on past errors to change future movements should cause consistent metrical deviations and an inability to correct them; however, it should not boost "motor noise." However, dysmetria, a loss of endpoint precision and an increase in endpoint variability ("motor noise") of goal-directed movements is the central aspect of cerebellar ataxia. Does the prevention of dysmetria or "motor noise" by the healthy cerebellum tell us anything about its normal function? We hypothesize that the healthy cerebellum is able to prevent dysmetria by adjusting movement duration such as to compensate changes in movement velocity. To address this question, we studied fast goal-directed index finger movements in patients with global cerebellar degeneration and in healthy subjects. We demonstrate that healthy subjects are able to maintain endpoint precision despite continuous fluctuations in movement velocity because they are able to adjust the overall movement duration in a fully compensatory manner ("velocity-duration trade-off"). We furthermore provide evidence that this velocity-duration trade-off accommodated by the healthy cerebellum is based on a priori information on the future movement velocity. This ability is lost in cerebellar disease. We suggest that the dysmetria observed in cerebellar patients is a direct consequence of the loss of a cerebellum-based velocity-duration trade-off mechanism that continuously fine-tunes movement durations using information on the expected velocity of the upcoming movement.

Keywords: cerebellar ataxia; duration adjustment; motor noise; precision.


Figures

Figure 1
Figure 1
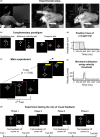
Experimental setup and paradigm used for measuring fast finger movements. (a) A healthy participant seated comfortably on a chair (left) placed in front of a large projection screen with his right (=preferred) hand resting on a customized ergonomic “mouse” allowing up (mid) and down (right) index finger movements. The index finger was stabilized using a cast. A search coil was placed axially around the middle phalanx, as shown by the dotted black line. (b) Complementary behavioural paradigms. (c) The main behavioural paradigm consisted of 1,700 trials that lasted for around 37 min. (d) Experiment for testing the role of cursor feedback. (e) Position trace during a single downward trial (solid dark grey line). The target jump (dashed grey line) times were randomized within a time window (shaded region) of 100–600 ms from the onset of the trial. (f) Movement onset detection (vertical grey lines) was based on a velocity threshold (horizontal dashed line) of 50 cm/s. Velocity profile (solid dark grey line) of the index finger during a downward movement
Figure 2
Figure 2
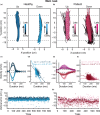
Endpoint precision, movement velocity and movement duration in exemplary subjects. (a,b) Movement trajectories of an exemplary healthy subject and cerebellar patient respectively. (c, e) Mean and standard error of mean (SEM) of the velocity trace for up and down finger movements with higher and lower peak velocity (100 trials each). (d, f) Velocity‐duration trade‐off in the healthy subject and patient, respectively, represented by the dashed regression lines fitted to the peak velocity and duration of all up and down trials. Slopes of regression, healthy: m up = −2.44; m down = −4.32; patient: m up = −0.03; m down = −0.54. (g, h) Endpoint errors in the up and down movements of the healthy subject and cerebellar patient
Figure 3
Figure 3
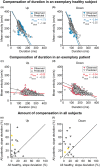
Analysis of relationship of movement velocity and movement duration. (a, b) Slopes of regression (m) of movement velocity as function of movement duration for individual subjects as function of associated coefficient of determination (R 2) for up and down finger movements, respectively. Healthy subjects: solid blue triangles; cerebellar patients: solid red triangles. Yellow arrows indicate the patients (P01 and P12) with additional noncerebellar damage (not included in statistical analysis). (c) Peak velocity distribution for all movements (up and down combined) pooled across all healthy subjects and cerebellar patients. Equal numbers of samples were drawn at random from a matched range of peak velocities (180–250 cm/s, dotted black lines) to compute the regression of peak velocity as function of movement duration shown in panel D. (d) Slopes of regression for matched range peak velocities in healthy subjects (m = −0.44, p = 9.53 × 10−234, R 2=0.16) and patients (m = −0.19, p = 2.13 × 10−79, R = 0.06)
Figure 4
Figure 4
Analysis of duration compensation of velocity fluctuations. (a‐d) Plots of mean velocities as function of observed durations and ideal durations (see main text for explanation) respectively, for the two exemplary subjects (a, b healthy subject; c, d patient) for up and down movements. Scatter plots and resulting regressions for observed durations are distinguished by colour (red for patients, blue for healthy subjects) from those for ideal durations (light grey). (e, f) Plots of slope deviation coefficients of patients as a function of coefficients of healthy controls. Note that patients exhibited significantly larger slope deviations than healthy subjects (healthy subjects: mean m deviation up = 9.9%, mean m deviation down = 14.75%, patients: mean m deviation up = 26.73%, mean m deviation down = 38.47%; Wilcoxon rank‐sum test, up movements: z = −2.03, p = 0.04; down movements: z = −2.40, p = 0.01). Yellow triangles indicate the patients (P01 and P12) with additional noncerebellar damage (not included in statistical analysis)
Figure 5
Figure 5
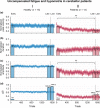
Movement velocity, amplitude, duration and task performance as a function of trial number. (aI, bI, cI, aII, bII, cII) Plots showing the mean (±SEM) of the normalized peak velocity, duration and amplitude of finger movements (up and down combined) of all healthy participants (blue traces) and patients (red traces) respectively, during the main task. The bars represent the mean (±SEM) of the respective kinematic parameter of trials during the “early” (first 120 trials), “late” (120 trials before alarm signal, as indicated by the dotted black line) and “last” phase (120 trials after alarm) of the main task. (dI, dII) The absolute mean score of all healthy participants (blue bars) and cerebellar patients (red bars), respectively, at the end of early, late and last phase of the main task. The average (±SEM) instantaneous ratio (ΔS) of successful trials relative to executed trials of all healthy participants and cerebellar patients is shown by the blue and red traces, respectively
Figure 6
Figure 6
The role of cursor feedback. Mean velocity profiles of all up and down movements in healthy control subjects (solid grey lines) during the four phases of control task. Black solid traces indicate the mean of all velocity profiles of up and down finger movements during the four phases. There was no influence of the cursor feedback on the shape of movement velocity profiles

References

    1. Albus, J. S. (1971). A theory of cerebellar function. Mathematical Biosciences, 10, 25–61. 10.1016/0025-5564(71)90051-4 - DOI
    1. Bahill, A. T. , & Stark, L. (1975). Overlapping saccades and glissades are produced by fatigue in the saccadic eye movement system. Experimental Neurology, 48, 95–106. 10.1016/0014-4886(75)90225-3 - DOI - PubMed
    1. Bechert, K. , & Koenig, E. (1996). A search coil system with automatic field stabilization, calibration, and geometric processing for eye movement recording in humans. Neuro‐Ophthalmology, 16, 163–170. 10.3109/01658109609009677 - DOI
    1. Bhanpuri, N. H. , Okamura, A. M. , & Bastian, A. J. (2014). Predicting and correcting ataxia using a model of cerebellar function. Brain, 137, 1931–1944. 10.1093/brain/awu115 - DOI - PMC - PubMed
    1. Catz, N. , Dicke, P. W. , & Thier, P. (2008). Cerebellar‐dependent motor learning is based on pruning a Purkinje cell population response. Proceedings of the National Academy of Sciences of the United States of America, 105, 7309–7314. 10.1073/pnas.0706032105 - DOI - PMC - PubMed

Publication types