. 2018 Jul 3;24(1):224-237.
doi: 10.1016/j.celrep.2018.06.020.

Regulation of Breast Cancer-Induced Osteoclastogenesis by MacroH2A1.2 Involving EZH2-Mediated H3K27me3

Affiliations

Regulation of Breast Cancer-Induced Osteoclastogenesis by MacroH2A1.2 Involving EZH2-Mediated H3K27me3

Jinman Kim et al. Cell Rep. .

Abstract

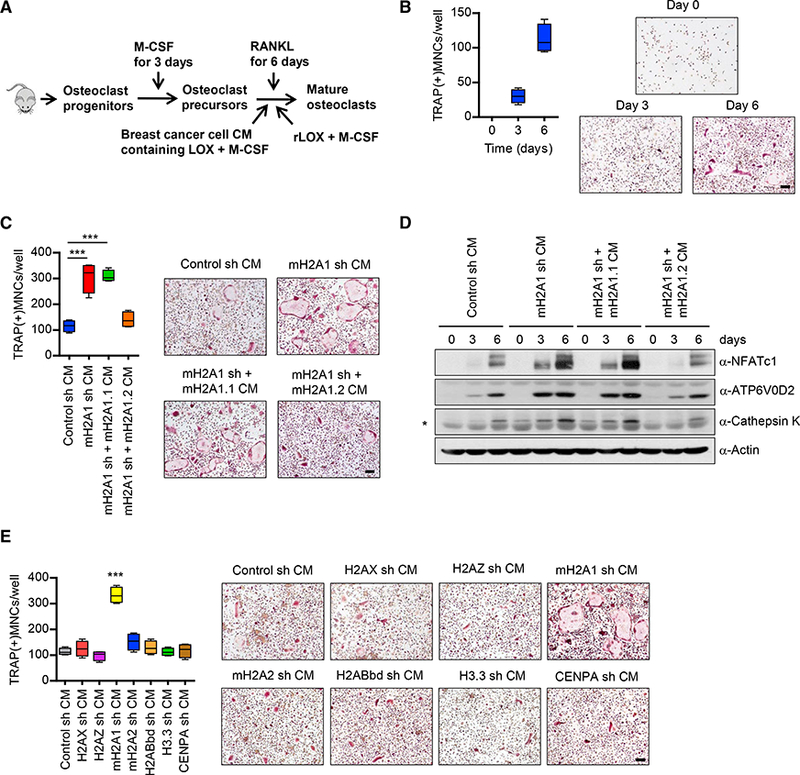
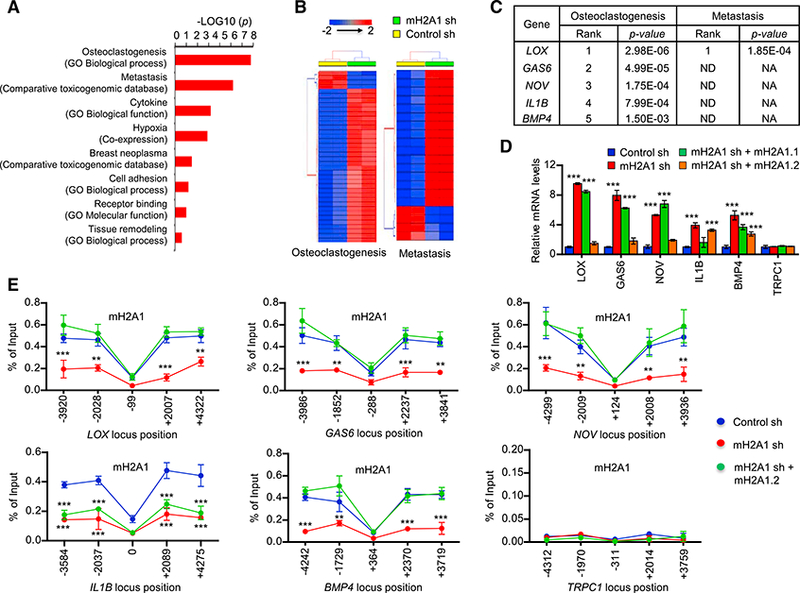
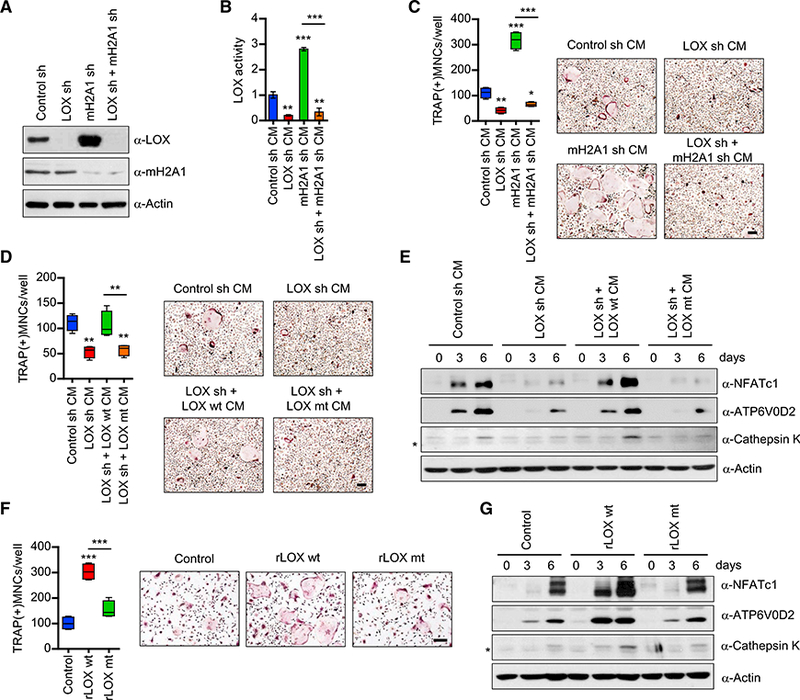
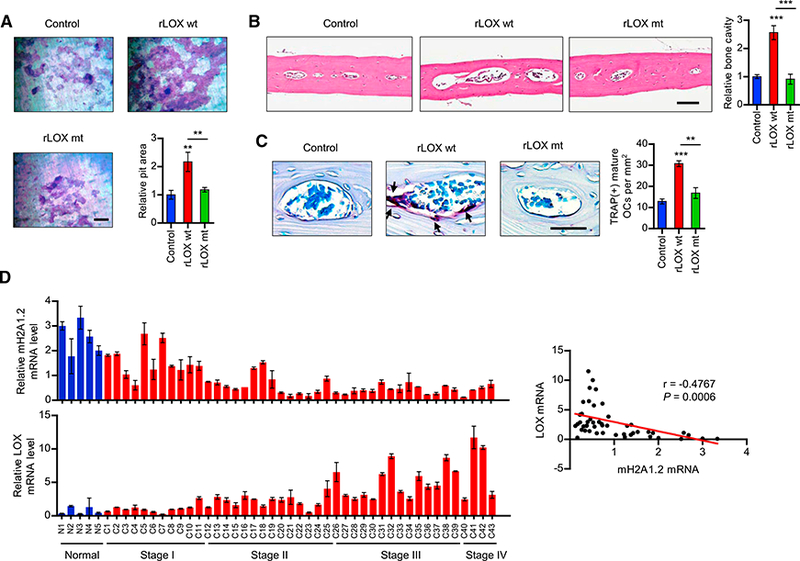
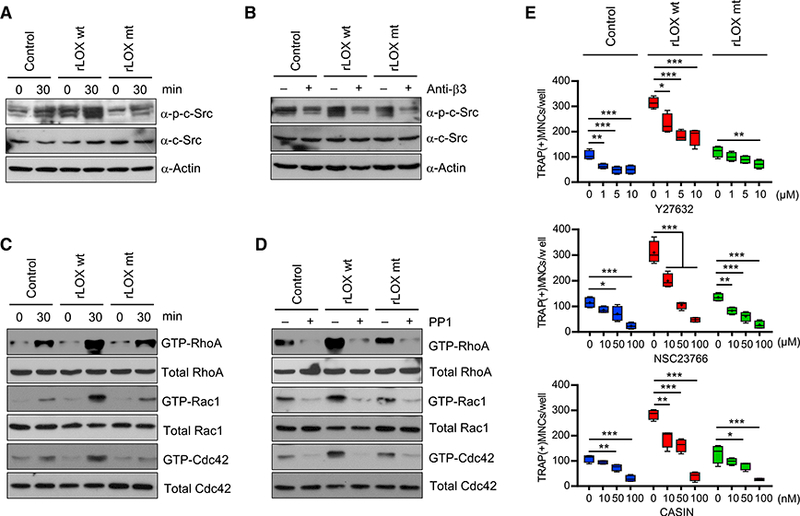
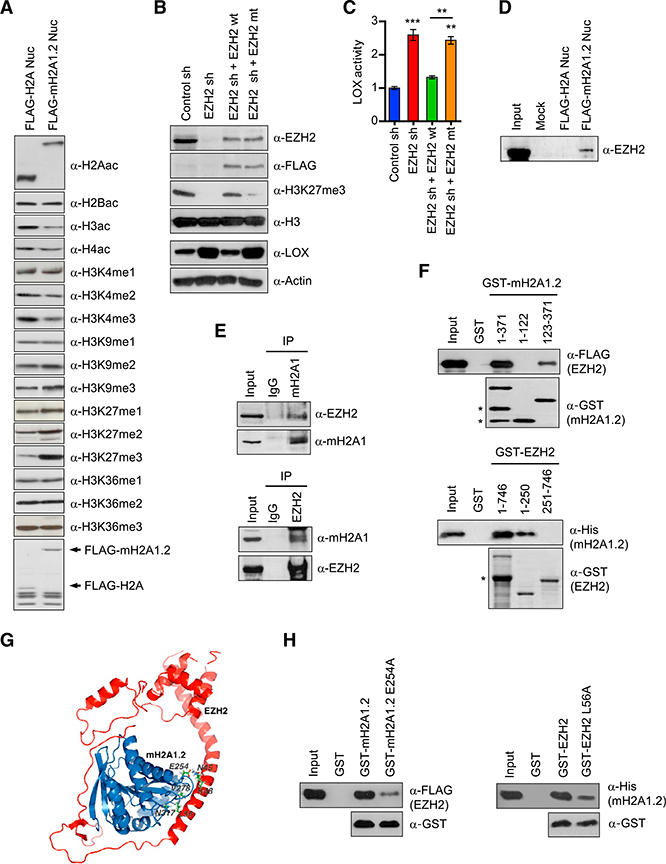
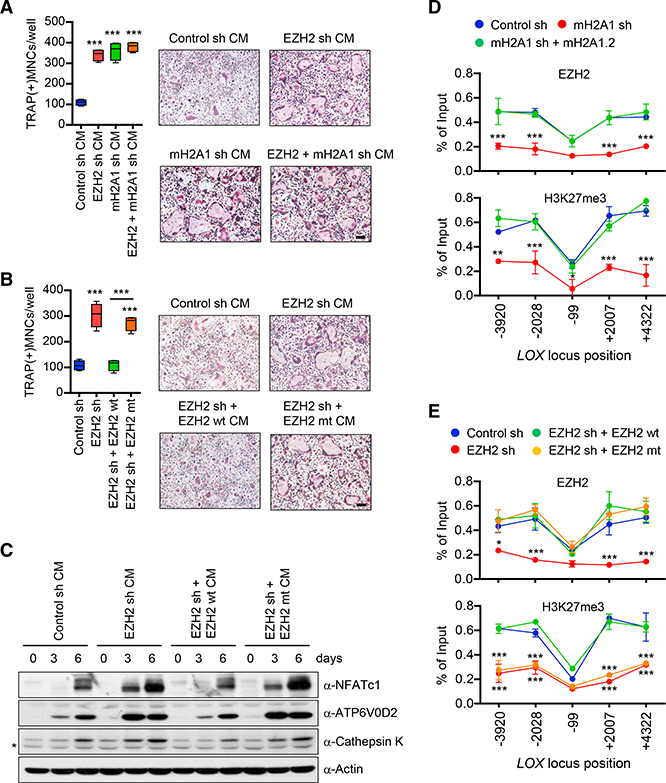
Breast cancer cells relocate to bone and activate osteoclast-induced bone resorption. Soluble factors secreted by breast cancer cells trigger a cascade of events that stimulate osteoclast differentiation in the bone microenvironment. MacroH2A is a unique histone variant with a C-terminal non-histone domain and plays a crucial role in modulating chromatin organization and gene transcription. Here, we show that macroH2A1.2, one of the macroH2A isoforms, has an intrinsic ability to inhibit breast cancer-derived osteoclastogenesis. This repressive effect requires macroH2A1.2-dependent attenuation of expression and secretion of lysyl oxidase (LOX) in breast cancer cells. Furthermore, our mechanistic studies reveal that macroH2A1.2 physically and functionally interacts with the histone methyltransferase EZH2 and elevates H3K27me3 levels to keep LOX gene in a repressed state. Collectively, this study unravels a role for macroH2A1.2 in regulating osteoclastogenic potential of breast cancer cells, suggesting possibilities for developing therapeutic tools to treat osteolytic bone destruction.

Keywords: EZH2; LOX; Src; bone; breast cancer; histone; macroH2A; osteoclast.


Conflict of interest statement

DECLARATION OF INTERESTS

The authors declare no competing interests.

Figures

Figure 1.
Figure 1.. Inhibition of Osteoclastogenic Activity of Breast Cancer Cell CMs by mH2A1.2.
(A) Shown are the steps for analysis of osteoclastogenic properties of breast cancer cell-derived conditioned media (CMs) and recombinant LOX (rLOX). (B) OCP cells were incubated with RANKL and MDA-MB-468 CMs for 0, 3, or6 days, fixed, stained for TRAP, and photographed under a light microscope (10×) (right). Representative images of osteoclasts are shown (scale bar, 100 μm). TRAP positive multinucleated cells (TRAP(+)MNCs) containing three or more nuclei and a full actin ring were counted as osteoclasts (left). Scale bar, 100 μm. (C) CMs were prepared from mH2A1 -depleted MDA-MB-468 cells expressing exogenous shRNA-resistant mH2A1.1 or mH2A1.2 and analyzed for osteoclastogenic activity as in (B). Scale bar, 100 μm. Error bars are the means ± SD (n = 4) of three independent experiments; ***p < 0.001 (ANOVA analysis). (D) Cell lysates were collected from OCP cells after treating with MDA-MB-468 CMs for the indicated time periods and analyzed for the expression of three osteoclast markers (NFATc1, ATP6V0D2, and cathepsin K) by western blot. β-Actin was used as a loading control. Non-specific band was marked by asterisk. (E) OCP cells were cultured with CMs collected from MDA-MB-468 breast cancer cells depleted of the indicated histone variants. At the end of day 6, OCP- induced cells were stained for TRAP (right) to measure osteoclast differentiation (left). Error bars represent the means ± SD (n = 4); ***p < 0.001 versus Control sh CM (ANOVA analysis).
Figure 2.
Figure 2.. Identification of mH2A1.2 Target Genes in Breast Cancer Cells.
(A) Pathway analysis of breast cancer secretome identified the enrichment of pathways related to breast cancer associated bone metastasis and osteoclas- togenesis in 3,948 secretome genes. A ranked p value was computed for each pathway based on hypergeometric distribution along with Benjamini Hochberg correction (p < 0.05). Datasets used to extract the pathway terms are indicated in parentheses. The genes identified in each pathway are listed in Table S3. (B) A two-way hierarchical clustering of two representative pathways—osteoclast differentiation and metastasis-showing distinct signature expression profile in mH2A1 sh knockdown and wild-type MDA-MB-486 cells. Euclidean distance and Average linkage were used for clustering. (C) Prioritization of candidate genes in two important pathways differentially regulated in control and mH2A1-depleted MDA-MB-486 cells. Genes are ranked in the order of their functional statistical significance in a particular pathway. Top five ranked genes in osteoclast differentiation pathway and their corresponding rank in metastatic pathway are shown. (D) qRT-PCR was performed to quantify relative mRNA levels of the top five genes using primers listed in Table S4. Error bars denote the SD from triplicate reactions by real-time PCR; ***p < 0.001 versus Control sh (ANOVA analysis). (E) ChIP assays were performed at five different regions of the five mH2A1.2-repressed and one control genes using mH2A1 antibody and primers listed in Table S4. Error bars denote the means ± SD obtained from triplicate real-time PCR reactions; **p < 0.01, ***p < 0.001 versus Control sh (ANOVA analysis).
Figure 3.
Figure 3.. Dependence of mH2A1.2 Anti-osteoclastogenic Function on LOX.
(A) Western blot analysis of lysates from MDA-MB-468 breast cancer cells expressing a control, LOX, or mH2A1 shRNA using the indicated antibodies. (B) CMs were collected from MDA-MB-468 breast cancer cells depleted of LOX and/or mH2A1 and were used to measure LOX enzymatic activity as described in the Experimental Procedures. (C) OCP cells were treated with CMs from MDA-MB-468 cells depleted of LOX and mH2A1 individually or together for 6 days. TRAP-positive multinucleated osteoclasts were stained (right) and counted (left). Scale bar, 100 μm. (D) Osteoclast differentiation assays were carried out as in (C), but using CMs from LOX-depleted MDA-MB-468 cells expressing shRNA-resistant LOX wild-type (LOX wt) or oxidase-dead mutant (LOX mt). Scale bar, 100 μm. (E) After treating OCP cells with MDA-MB-468 CMs as in (D), altered expression of NFATc1, ATP6V0D2, and cathepsin K was analyzed by western blot. β-Actin was used as a loading control. Non-specific band was marked by asterisk. (F) OCP cells were treated with recombinant LOX (rLOX) wt or rLOX mt for 0, 3, and 6 days. Changes in osteoclast differentiation were assessed by TRAP staining (right) and counting (left). Scale bar, 100 μm. (G) Western blot analyses of expression levels of NFATc1, ATP6V0D2, and cathepsin K after treating OCP cells with rLOX wt or rLOX mt. Error bars in (B)-(D) and (F) represent the means ± SD (n = 4) of three independent experiments; *p < 0.05, **p < 0.01, ***p < 0.001 (ANOVA analysis).
Figure 4.
Figure 4.. LOX-Mediated Stimulation of Osteoclastogenesis and Bone Resorption.
(A) Osteoclasts were placed on dentin slices and cultured with MDA-MB-468 CMs in the presence of vehicle (control), rLOX wt, or rLOX mt for 48 hr. The dentin slices were stained for toluidine blue and analyzed for resorption pit area (lower right). Scale bar, 100 μm. (B and C) Calvarial bones from C57BL/6 mice treated with vehicle (control), rLOX wt or rLOX mt were fixed, embedded, and subjected to sectioning, TRAP staining, and histological analysis. H&E staining analyses of bone lesions in C57BL/6 mice treated with vehicle (control), rLOX wt or rLOX mt are shown in (B). Representative images of TRAP-staining (scale bar, 100 mm) and quantification of TRAP-positive cells are shown in (C). Arrows point to TRAP-positive mature osteoclasts. (D) Breast cancer TissueScan cDNA arrays (OriGene) were analyzed for mH2A1.2 (upper) and LOX (lower) expression by qRT-PCR. The scatterplot diagram on the right shows the Pearson correlation analysis of the relationship between mH2A1.2 and LOX expression. Error bars in (A)-(D) represent the means ± SD (A and D; n = 3, B and C; n = 5); **p < 0.01, ***p < 0.001 versus Control (ANOVA analysis).
Figure 5.
Figure 5.. An Important Role for LOX in Facilitating c-Src Phosphorylation and Function.
(A) OCP cells were seeded onto the culture dishes coated with rLOX wt or mt in MDA-MB-468 CMs for 30 min. Whole cell lysates were prepared and analyzed by western blot using antibodies recognizing c-Src and c-Src phosphorylation. (B) After pretreating with function-blocking antibody against integrin β3 subunit, OCP cells were plated on the culture dishes coated with rLOX wt or rLOX mt in MDA-MB-468 CMs and incubated for 30 min. Whole cell lysates were prepared and analyzed by western blot as in (A). (C) Small GTPase (RhoA/Rac1/Cdc42) assays were performed as in (A), and subjected to western blot analysis with antibodies against RhoA, Rac1, and Cdc42. (D) Small GTPases assays were done as in (B, but using the Src inhibitor PP1. (E) OCP cells were treated with rLOX wt or rLOX mt for 6 days in the presence of the indicated concentrations of RhoA inhibitor Y27632, Rac1 inhibitor NSC23766, or Cdc42 inhibitor CASIN. TRAP-positive multinucleated osteoclasts were stained and counted. Error bars represent the means ± SD (n = 4); *p < 0.05, **p <0.01, ***p < 0.001 (ANOVA analysis).
Figure 6.
Figure 6.. Selective Recognition and Modification of mH2A1.2 Nucleosomes by EZH2.
(A) Mononucleosomes were prepared from MDA- MB-468 cells transfected with FLAG-H2A or FLAG- mH2A1.2 expression vector as described (Kim et al., 2013). FLAG-H2A and FLAG-mH2A1.2 nu- cleosomes were immunoprecipitated and analyzed by western blotting with antibodies specific for the indicated histone modifications. The bottom panel shows a Coomassie-stained gel of the purified nucleosomes. (B) EZH2-depleted MDA-MB-468 cells were complemented with EZH2 wild-type (EZH2 wt) or methyltransferase-dead mutant (EZH2 mt), and relative levels of H3K27me3 and LOX expression were determined by western blot. (C) LOX activity was measured in CMs collected from mock-depleted control or EZH2-depleted MDA-MB-468 cells. The rescue effects of EZH2 wt and mt on LOX activity were also analyzed. Error bars represent the means ± SD (n = 3); **p < 0.01, ***p < 0.001 versus Control sh (ANOVA analysis). (D) Mononucleosomes containing ectopic H2A or mH2A1.2 were purified as in (A) and subjected to western blotting with EZH2 antibody. (E) MDA-MB-468 cell extracts were immunopre- cipitated with mH2A1 and EZH2 antibodies and analyzed by western blot. Ten percent of the input proteins were also examined by western blotting. (F) FLAG-EZH2 and His-mH2A1.2 were incubated with the indicated GST-mH2A1.2 and GST-EZH2 fusions. After extensive washing, bound EZH2 and mH2A1.2 proteins were analyzed by western blot. Non-specific bands were marked by asterisks. (G) The model of mH2A1.2-EZH2 interaction was built on the basis of PDB entries 1zr5 (mH2A1.2) and 5hyn (EZH2) in docking simulations using the program Cluspro 2.0. The chosen docking prediction is shown with the EZH2 (L56) and mH2A1.2 (V278, N317) side chains in ball-and-stick representation. (H) GST pull-down assays were conducted as in(F), except that GST-mH2A1.2 and GST-EZH2 carrying the indicated point mutations were used.
Figure 7.
Figure 7.. mH2A1.2-Dependent Repression of LOX Expression and Osteoclast Differentiation by EZH2.
(A) CMs were harvested from MDA-MB-468 breast cancer cells depleted of EZH2 or/and mH2A1 and analyzed for osteoclastogenic activity. Scale bar, 100 μm. (B) OCP cells were treated with CMs from EZH2- depleted MDA-MB-468 cells expressing shRNA- resistant EZH2 wt or mt. Scale bar, 100 μm. (C) After treating OCP cells with indicated CMs, expression levels of three osteoclast marker genes were analyzed by western blot. β-Actin was used as a loading control. Non-specific band was marked by asterisk. (D) ChIP assays on mock-depleted or mH2A1- depleted MDA-MB-468 cells complemented with shRNA-resistant mH2A1.2 were performed to assess the levels of EZH2 and H3K27me3 at the LOX gene. Primer sets locating at five different regions of the LOX gene were used. (E) ChIP assays were carried out as in (D), but using mock-depleted or EZH2-depleted MDA-MB-468 cells. For rescue experiments, shRNA-resistant EZH2 wt or mt was expressed. Error bars in (A), (B), (D), and (E) represent the means ± SD (A and B; n = 4, D and E; n = 3); *p < 0.05, **p < 0.01, ***p < 0.001 versus Control sh (ANOVA analysis).

Similar articles

Cited by

References

    1. Bild AH, Potti A, and Nevins JR (2006). Linking oncogenic pathways with therapeutic opportunities. Nat. Rev. Cancer 6, 735–741. - PubMed
    1. Boyle WJ, Simonet WS, and Lacey DL (2003). Osteoclast differentiation and activation. Nature 423, 337–342. - PubMed
    1. Buschbeck M, Uribesalgo I, Wibowo I, Rué P, Martin D, Gutierrez A, Morey L, Guigo R, Lopez-Schier H, and Di Croce L (2009). The histone variant macroH2A is an epigenetic regulator of key developmental genes. Nat. Struct. Mol. Biol 16, 1074–1079. - PubMed
    1. Chakravarthy S, Gundimella SK, Caron C, Perche PY, Pehrson JR, Khochbin S, and Luger K (2005). Structural characterization of the histone variant macroH2A. Mol. Cell. Biol 25, 7616–7624. - PMC - PubMed
    1. Chen H, Ruiz PD, Novikov L, Casill AD, Park JW, and Gamble MJ (2014). MacroH2A1.1 and PARP-1 cooperate to regulatetranscription by promoting CBP-mediated H2B acetylation. Nat. Struct. Mol. Biol 21, 981–989. - PMC - PubMed

Publication types

MeSH terms