. 2018 Jul 3;28(1):69-86.e6.
doi: 10.1016/j.cmet.2018.06.006.

Targeting Breast Cancer Stem Cell State Equilibrium through Modulation of Redox Signaling

Affiliations

Targeting Breast Cancer Stem Cell State Equilibrium through Modulation of Redox Signaling

Ming Luo et al. Cell Metab. .

Abstract

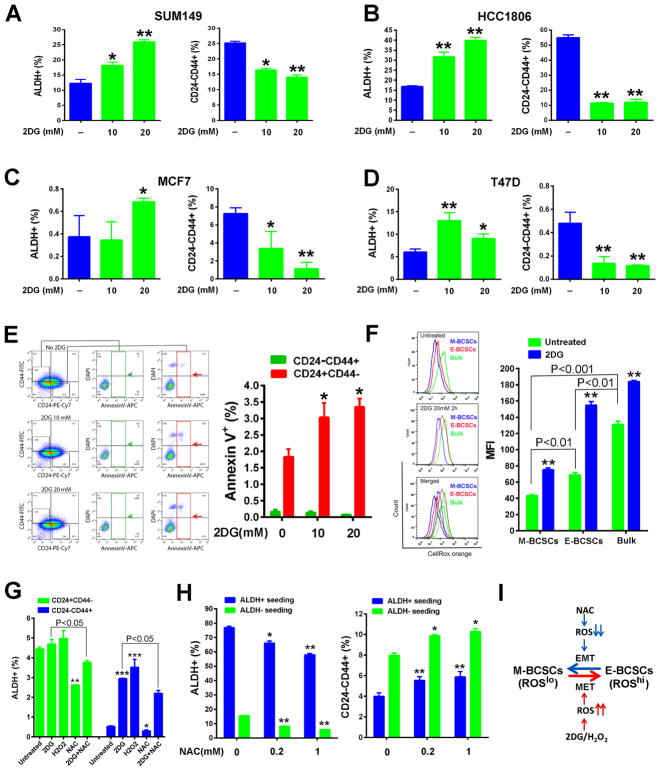
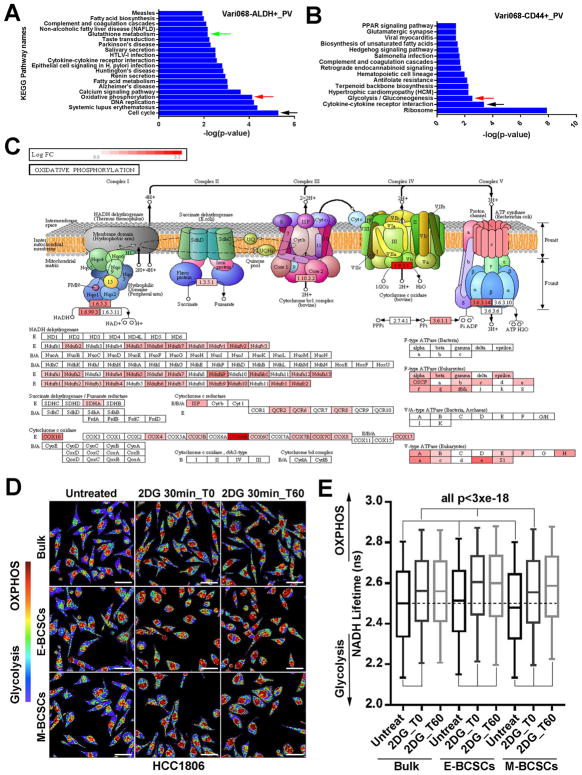
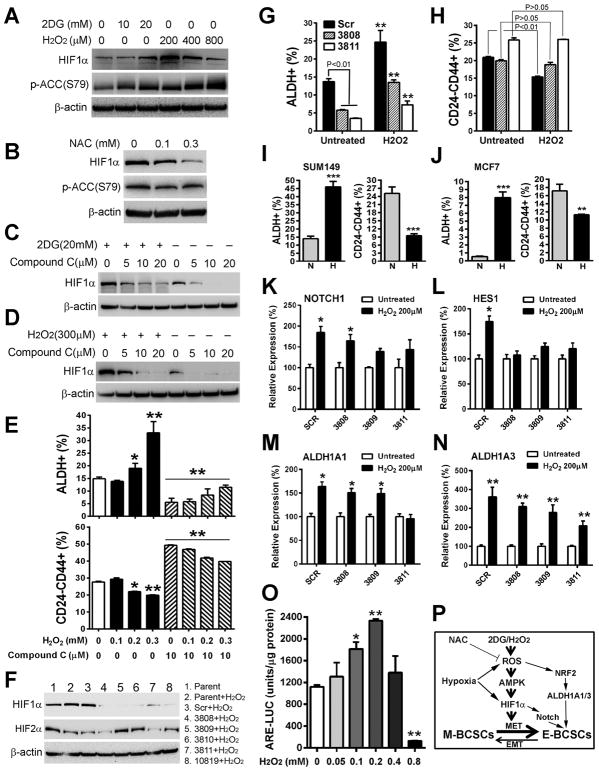
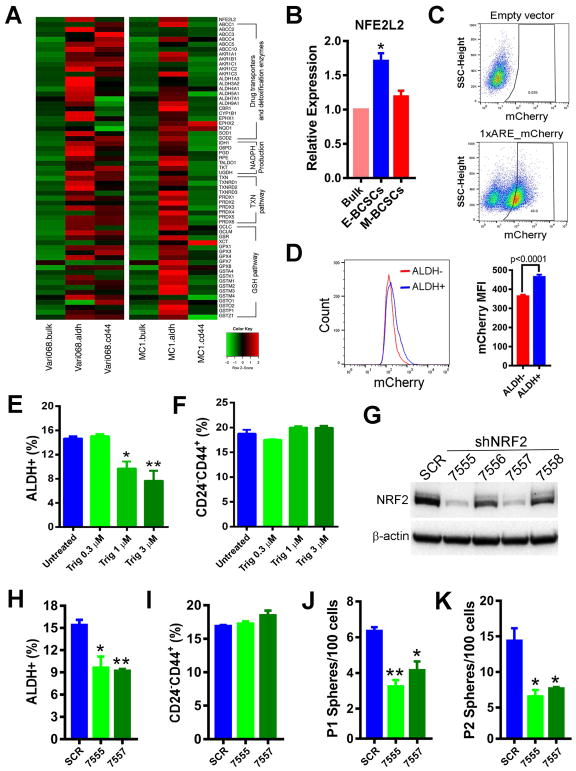
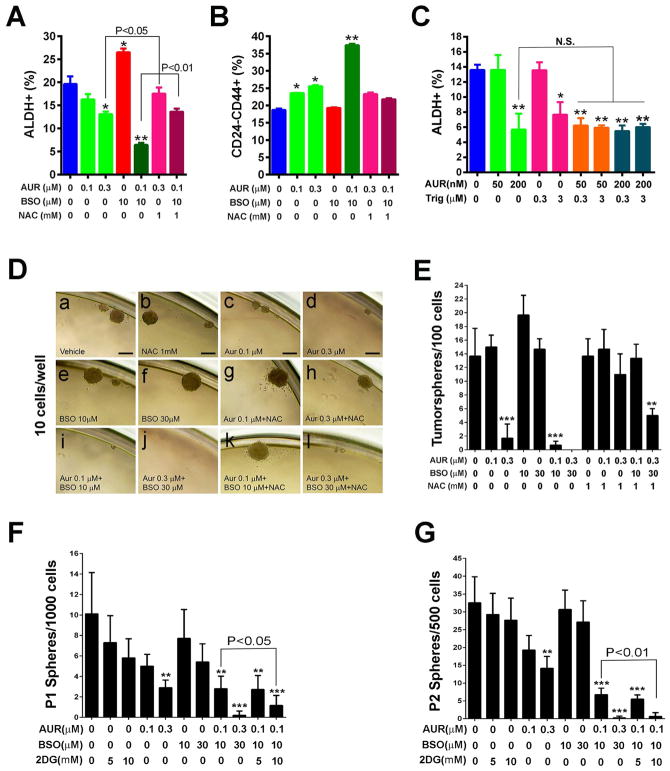
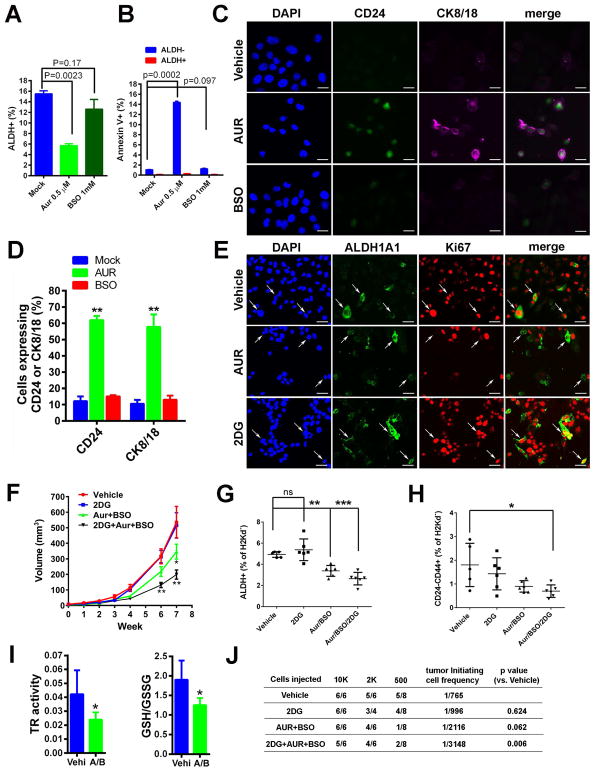
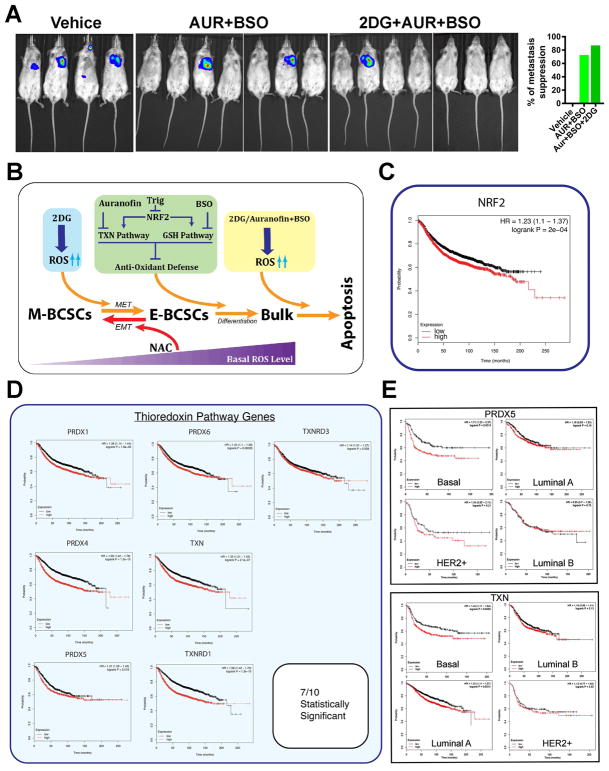
Although breast cancer stem cells (BCSCs) display plasticity transitioning between quiescent mesenchymal-like (M) and proliferative epithelial-like (E) states, how this plasticity is regulated by metabolic or oxidative stress remains poorly understood. Here, we show that M- and E-BCSCs rely on distinct metabolic pathways and display markedly different sensitivities to inhibitors of glycolysis and redox metabolism. Metabolic or oxidative stress generated by 2DG, H2O2, or hypoxia promotes the transition of ROSlo M-BCSCs to a ROShi E-state. This transition is reversed by N-acetylcysteine and mediated by activation of the AMPK-HIF1α axis. Moreover, E-BCSCs exhibit robust NRF2-mediated antioxidant responses, rendering them vulnerable to ROS-induced differentiation and cytotoxicity following suppression of NRF2 or downstream thioredoxin (TXN) and glutathione (GSH) antioxidant pathways. Co-inhibition of glycolysis and TXN and GSH pathways suppresses tumor growth, tumor-initiating potential, and metastasis by eliminating both M- and E-BCSCs. Exploiting metabolic vulnerabilities of distinct BCSC states provides a novel therapeutic approach targeting this critical tumor cell population.

Keywords: HIF1α; NRF2; antioxidant responses; cancer stem cell metabolism; cancer stem cell plasticity; glycolysis; hypoxia; oxidative phosphorylation.


Conflict of interest statement

DECLARATION OF INTERESTS

M.S.W. holds equity in OncoMed Pharmaceuticals.

Figures

Figure 1
Figure 1. BCSC State Equilibrium Is Tightly Controlled by Changes of Redox States
(A–E) E- and M-BCSCs in SUM149 (A), HCC1806 (B), MCF7 (C) and T47D (D) BC cells treated with 2DG (10 and 20 mM, 40h) and effects of 2DG to induce apoptosis in M-BCSCs or bulk tumor cells (E). *, **: P<0.05 or 0.01 (vs. no 2DG). (F) SUM149 treated with or without 2DG (20mM, 2h) were stained with CellROX orange (5 nM, 30min) and MFI of CellROX orange was analyzed in each cell subset. **P<0.01 vs. untreated. (G) CD24CD44+ M-BCSCs and CD24+CD44 bulk cells were plated and treated with 2DG (20mM), H2O2 (200 μM), NAC (1mM), or 2DG+NAC for 40h and analyzed for ALDH+ cell content. *, **, ***: P< 0.05, 0.01 and 0.001 respectively (vs. untreated). (H) ALDH+ and ALDH cells from SUM149 were plated and treated with NAC for 24h and then analyzed for E- and M-BCSCs. *, **: P< 0.05 or 0.01 (vs. no NAC). (I) Schematic model of redox-regulated BCSC state equilibria.
Figure 2
Figure 2. E- and M-BCSCs Exhibit Distinct Metabolic Pathways and Enhanced Metabolic Plasticity
(A–C) Pathways enriched in E- (A) and M- (B) BCSCs and ETC complex genes elevated in E-BCSCs (C) of Vari068. (D, E) E- (ALDH+) and M- (ALDHCD24CD44+) BCSCs and bulk cells (ALDHCD24+CD44) from HCC1806 were plated, treated with or without 2DG and measured by FLIM immediately or after 1h culture (D) and NADH Lifetimes calculated from 400–500K cells in each condition (E). Bar: 40 μm, all p<3×10⁻¹⁸.
Figure 3
Figure 3. The ROS-AMPK-HIF1α Axis Regulates BCSC Phenotypic Plasticity
(A, B) SUM149 BC cells treated with 2DG/H2O2 for 1.5h (A) or NAC for 20h (B) was analyzed by p-ACC (S79) and HIF1α antibodies. (C, D) HIF1α protein expression in SUM149 treated with different doses of compound C alone or with 2DG (C) or H2O2 (D) for 2h. (E) Contents of E- and M-BCSCs in SUM149 after 20h treatment with H2O2 with or without compound C. *, **: P< 0.05 or 0.01 (vs. untreated or corresponding cells without Compound C). (F) Characterization of two HIF1α knockdown (3808 and 3811) lines without apparent HIF2α compensatory responses after H2O2 stimulation. (G, H) E- (G) and M- (H) BCSCs in SCR and HIF1α knockdown cell lines with or without H2O2 treatment. **P< 0.01 (vs. untreated). (I, J) SUM149 (I) and MCF7 (J) BC cells cultured under normoxic (N) or hypoxic (H) conditions for 48h were analyzed for E- and M-BCSCs. **, ***: P<0.01 or 0.001 (vs. N). (K–N) NOTCH1 (K), HES1 (L), ALDH1A1 (M) and ALDH1A3 (N) expression in HIF1α knockdown or SCR control cells induced by H2O2.*, **: P< 0.05 or 0.01 (vs. untreated). (O) Moderate levels of H2O2 (0.1–0.2 mM) stimulate NRF2 reporter activity. *, **: P< 0.05 or 0.01 (vs. no H2O2). (P) Three independent mechanisms for ROS induced propagations of E-BCSCs.
Figure 4
Figure 4. E-BCSCs Are Endowed with Robust NRF2 Antioxidant Responses, which Support their Maintenance and Sphere-forming Capacity
(A) Heat map of NRF2 antioxidant responsive genes in E- and M-BCSCs vs. bulk cells in Vari068 and MC1 PDXs. (B) Relative expression of NRF2 in E- and M-BCSCs vs. bulk cells in SUM149. *: P< 0.05 vs. bulk. (C, D) A NRF2 mCherry reporter in SUM149 indicating 46% cells with NRF2 activity (C) and mCherry MFI in ALDH vs. ALDH+ cells (D). (E, F) ALDH+ E- (E) and CD24CD44+ M- (F) BCSCs treated with various doses of Trig for 40h, *, **: P< 0.05 or 0.01 (vs. untreated). (G–K) NRF2 protein levels in SUM149 BC cells expressing SCR or different shNRF2 sequences (G), and contents of E- (H) and M- (I) BCSCs as well as primary (J) and secondary (K) sphere formation in SCR vs. NRF2 knockdown lines. *, **: P< 0.05 or 0.01 (vs. SCR).
Figure 5
Figure 5. Inhibition of TXN and GSH Antioxidant Pathways downstream of NRF2 Abrogates E- but not M-BCSCs
(A–C) Contents of E- (A) and M- (B) BCSCs in SUM149 treated with AUR, BSO or AUR+BSO with or without NAC for 24h and the effects of Trig to sensitize E-BCSCs to AUR (C). *, **: P<0.05 or 0.01 vs. untreated. NS: not significant. (D–G) Sphere formation of SUM149 (D, E) and H2Kd Vari068 tumor cells (F, G) subjected to various treatments. Scale Bar: 100 μm. **, ***: P< 0.01 or 0.001 vs. untreated.
Figure 6
Figure 6. Inhibition of TXN Pathway Induces Differentiation and Apoptosis of E-BCSCs and Co-inhibition of Glycolysis and TXN/GSH Pathways Additively Suppresses Tumor Growth and Tumor-Initiating Potential by Abrogating both M- and E-BCSCs
(A, B) SUM149 treated with AUR (0.5 μM) or BSO (1mM) for 24h were labeled with Annexin V and examined for the content of E-BCSCs (A) and Annexin V+ cell ratio in ALDH+ and ALDH cell populations (B). (C, D) SUM149 treated with Vehicle, 0.5μM of AUR, or 30μM of BSO for 24h were stained for CD24 and CK8/18 (C) and the ratio of CD24+ or CK8/18+ cells over total DAPI+ cells were plotted (D). Scale Bar: 20 μm. **: P<0.01 vs. Mock. (E) SUM149 treated with Vehicle, 0.5 μM AUR, or 20 mM 2DG were stained with antibodies against human ALDH1A1 and Ki67. Scale Bar: 50 μm. (F–H) Vari068 tumor growth following treatment with Vehicle, 2DG, AUR+BSO, and 2DG+AUR+BSO (F), and contents of E- (G) and M- (H) BCSCs (G) in each cohort of tumors after 7-week treatment. *, **, ***: P<0.05, 0.01 or 0.001 vs. Vehicle. (I) Tumors of Vehicle and AUR+BSO group after 7-week treatment were examined for TR activity and GSH/GSSG ratio. *: P<0.05 vs. Vehicle. (J) Tumor-initiating potential of Vari068 tumor cells in 4 cohorts of tumors after 7-week treatment were examined in secondary NOD/SCID mice.
Figure 7
Figure 7. Co-inhibition of Glycolysis and TXN/GSH Antioxidant Pathways Suppresses Metastasis and Expression of NRF2 or TXN Antioxidant Pathway Is Correlated with Poor Survival of BC Patients
(A) NOD/SCID mice with 100K SUM159-Luc cells injected into the left ventricle were treated for 7 weeks and examined for metastasis formation by bioluminescent imaging. (B) A schematic model illustrating co-inhibition of glycolysis and NRF2 mediated antioxidant responses in disrupting BCSC state equilibrium. (C, D) NRF2 (C) and 7 out of 10 TXN antioxidant pathway genes (D) expression correlate to poor patient survival of BC. (E) The PRDX5 and TXN genes correlate to poor patient survival of basal BC.

References

    1. Arlt A, Sebens S, Krebs S, Geismann C, Grossmann M, Kruse ML, Schreiber S, Schafer H. Inhibition of the Nrf2 transcription factor by the alkaloid trigonelline renders pancreatic cancer cells more susceptible to apoptosis through decreased proteasomal gene expression and proteasome activity. Oncogene. 2013;32:4825–4835. - PubMed
    1. Aykin-Burns N, Ahmad IM, Zhu Y, Oberley LW, Spitz DR. Increased levels of superoxide and H2O2 mediate the differential susceptibility of cancer cells versus normal cells to glucose deprivation. The Biochemical journal. 2009;418:29–37. - PMC - PubMed
    1. Balic M, Lin H, Young L, Hawes D, Giuliano A, McNamara G, Datar RH, Cote RJ. Most early disseminated cancer cells detected in bone marrow of breast cancer patients have a putative breast cancer stem cell phenotype. Clinical cancer research: an official journal of the American Association for Cancer Research. 2006;12:5615–5621. - PubMed
    1. Brabletz T. To differentiate or not--routes towards metastasis. Nature reviews Cancer. 2012;12:425–436. - PubMed
    1. Brooks MD, Burness ML, Wicha MS. Therapeutic Implications of Cellular Heterogeneity and Plasticity in Breast Cancer. Cell stem cell. 2015;17:260–271. - PMC - PubMed

MeSH terms