

Genome variants associated with RNA splicing variations in bovine are extensively shared between tissues
- PMID: 29973141
- PMCID: PMC6032541
- DOI: 10.1186/s12864-018-4902-8
Genome variants associated with RNA splicing variations in bovine are extensively shared between tissues
Abstract
Background: Mammalian phenotypes are shaped by numerous genome variants, many of which may regulate gene transcription or RNA splicing. To identify variants with regulatory functions in cattle, an important economic and model species, we used sequence variants to map a type of expression quantitative trait loci (expression QTLs) that are associated with variations in the RNA splicing, i.e., sQTLs. To further the understanding of regulatory variants, sQTLs were compare with other two types of expression QTLs, 1) variants associated with variations in gene expression, i.e., geQTLs and 2) variants associated with variations in exon expression, i.e., eeQTLs, in different tissues.
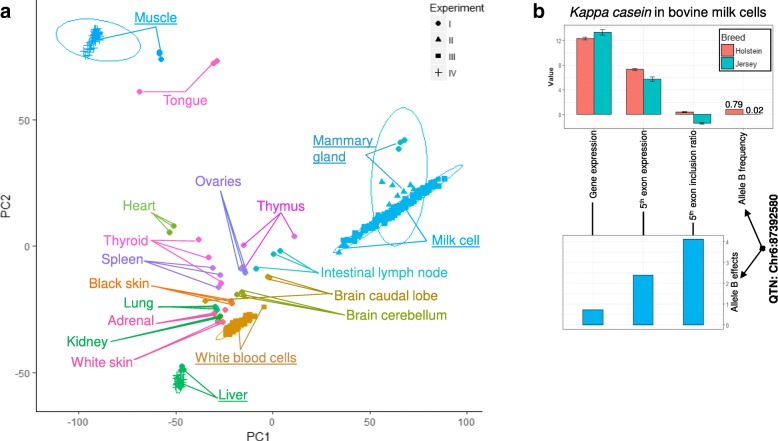
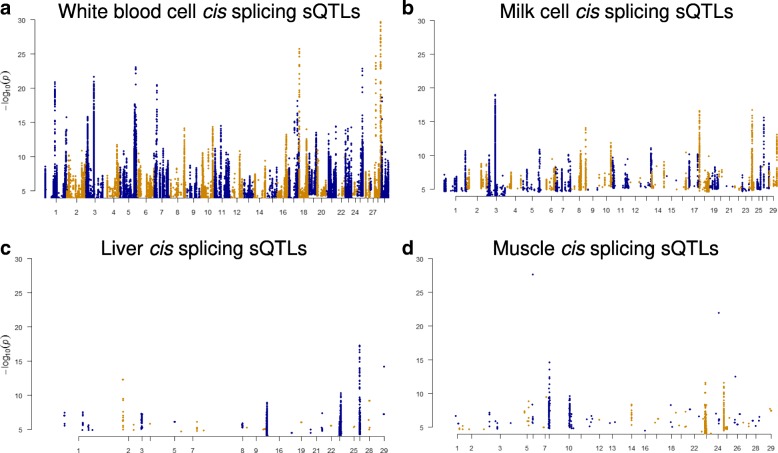
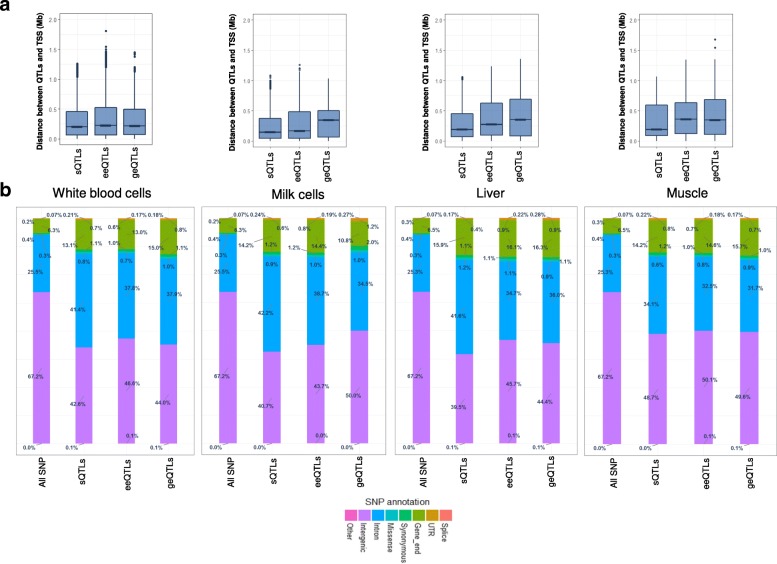
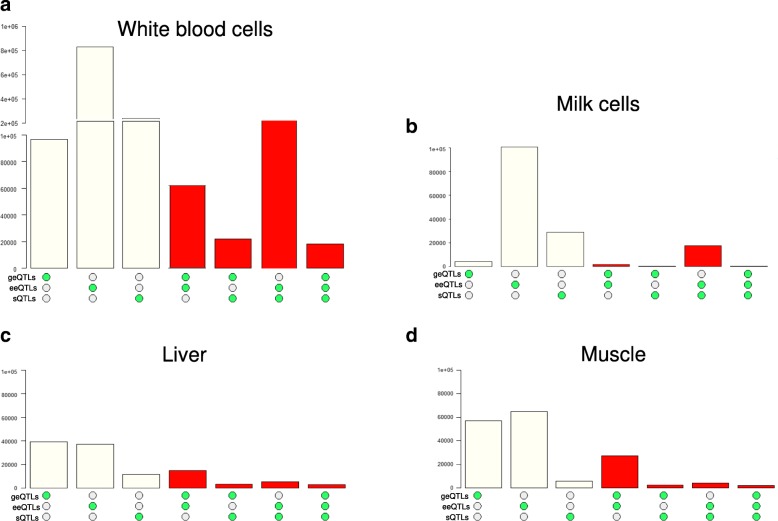
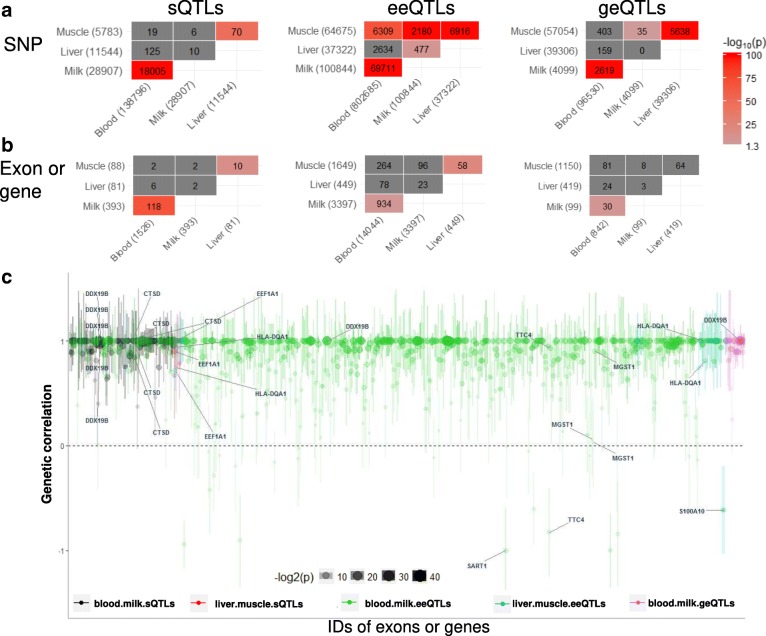
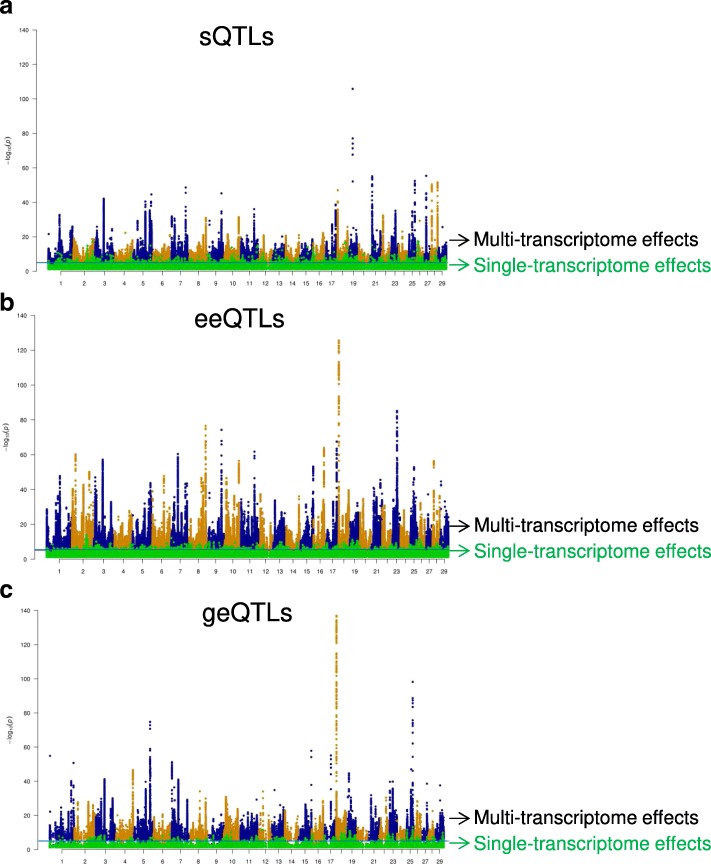
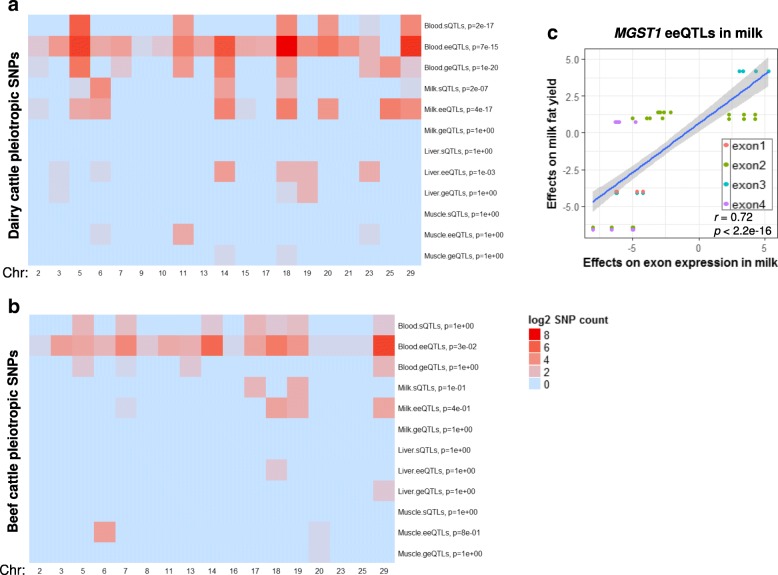
Results: Using whole genome and RNA sequence data from four tissues of over 200 cattle, sQTLs identified using exon inclusion ratios were verified by matching their effects on adjacent intron excision ratios. sQTLs contained the highest percentage of variants that are within the intronic region of genes and contained the lowest percentage of variants that are within intergenic regions, compared to eeQTLs and geQTLs. Many geQTLs and sQTLs are also detected as eeQTLs. Many expression QTLs, including sQTLs, were significant in all four tissues and had a similar effect in each tissue. To verify such expression QTL sharing between tissues, variants surrounding (±1 Mb) the exon or gene were used to build local genomic relationship matrices (LGRM) and estimated genetic correlations between tissues. For many exons, the splicing and expression level was determined by the same cis additive genetic variance in different tissues. Thus, an effective but simple-to-implement meta-analysis combining information from three tissues is introduced to increase power to detect and validate sQTLs. sQTLs and eeQTLs together were more enriched for variants associated with cattle complex traits, compared to geQTLs. Several putative causal mutations were identified, including an sQTL at Chr6:87392580 within the 5th exon of kappa casein (CSN3) associated with milk production traits.
Conclusions: Using novel analytical approaches, we report the first identification of numerous bovine sQTLs which are extensively shared between multiple tissue types. The significant overlaps between bovine sQTLs and complex traits QTL highlight the contribution of regulatory mutations to phenotypic variations.
Keywords: Bovine; Expression QTL; Gene expression; Genetic correlations; Local genomic relationship matrices (LGRM); RNA splicing; Transcriptome meta-analysis; sQTL.
Conflict of interest statement
Ethics approval
For experiment I–III, the animal ethics was approved by the Victoria Animal Ethics Committee (application number 2013-14), Australia. For experiments IV, the animal ethics was approved by the University of New England Animal Ethics Committee (AEC 06/123, NSW, Australia) and Orange Agriculture Institute Ethics Committee (ORA09/015, NSW, Australia).
Consent for publication
Not applicable.
Competing interests
The authors declare that they have no competing interests.
Publisher’s Note
Springer Nature remains neutral with regard to jurisdictional claims in published maps and institutional affiliations.
Figures
Similar articles
-
Identification of eQTLs and sQTLs associated with meat quality in beef.BMC Genomics. 2020 Jan 30;21(1):104. doi: 10.1186/s12864-020-6520-5. BMC Genomics. 2020. PMID: 32000679 Free PMC article.
-
Regional Variation of Splicing QTLs in Human Brain.Am J Hum Genet. 2020 Aug 6;107(2):196-210. doi: 10.1016/j.ajhg.2020.06.002. Epub 2020 Jun 25. Am J Hum Genet. 2020. PMID: 32589925 Free PMC article.
-
Identification and expression pattern of two novel alternative splicing variants of EEF1D gene of dairy cattle.Gene. 2014 Jan 25;534(2):189-96. doi: 10.1016/j.gene.2013.10.061. Epub 2013 Nov 14. Gene. 2014. PMID: 24239553
-
Mammary gland multi-omics data reveals new genetic insights into milk production traits in dairy cattle.PLoS Genet. 2025 Apr 17;21(4):e1011675. doi: 10.1371/journal.pgen.1011675. eCollection 2025 Apr. PLoS Genet. 2025. PMID: 40245050 Free PMC article.
-
Functional Genetics to Understand the Etiology of Autoimmunity.Genes (Basel). 2023 Feb 24;14(3):572. doi: 10.3390/genes14030572. Genes (Basel). 2023. PMID: 36980846 Free PMC article. Review.
Cited by
-
Genome-wide fine-mapping identifies pleiotropic and functional variants that predict many traits across global cattle populations.Nat Commun. 2021 Feb 8;12(1):860. doi: 10.1038/s41467-021-21001-0. Nat Commun. 2021. PMID: 33558518 Free PMC article.
-
A multi-tissue atlas of regulatory variants in cattle.Nat Genet. 2022 Sep;54(9):1438-1447. doi: 10.1038/s41588-022-01153-5. Epub 2022 Aug 11. Nat Genet. 2022. PMID: 35953587 Free PMC article.
-
Analyses of inter-individual variations of sperm DNA methylation and their potential implications in cattle.BMC Genomics. 2019 Nov 21;20(1):888. doi: 10.1186/s12864-019-6228-6. BMC Genomics. 2019. PMID: 31752687 Free PMC article.
-
Identification and characterization of whole blood gene expression and splicing quantitative trait loci during early to mid-lactation of dairy cattle.BMC Genomics. 2024 May 6;25(1):445. doi: 10.1186/s12864-024-10346-7. BMC Genomics. 2024. PMID: 38711039 Free PMC article.
-
Functional impact of splicing variants in the elaboration of complex traits in cattle.Nat Commun. 2025 Apr 24;16(1):3893. doi: 10.1038/s41467-025-58970-5. Nat Commun. 2025. PMID: 40274775 Free PMC article.
References
-
- Meuwissen T, Hayes B, Goddard M. Genomic selection: a paradigm shift in animal breeding. Anim Front. 2016;6:6–14. doi: 10.2527/af.2016-0002. - DOI
MeSH terms
Substances
Grants and funding
LinkOut - more resources
Full Text Sources
Other Literature Sources
Miscellaneous
