Meta-Analysis
. 2018 Jul 4;18(1):70.
doi: 10.1186/s12874-018-0531-9.

Meta-analysis of binary outcomes via generalized linear mixed models: a simulation study

Affiliations
Meta-Analysis

Meta-analysis of binary outcomes via generalized linear mixed models: a simulation study

Ilyas Bakbergenuly et al. BMC Med Res Methodol. .

Abstract

Background: Systematic reviews and meta-analyses of binary outcomes are widespread in all areas of application. The odds ratio, in particular, is by far the most popular effect measure. However, the standard meta-analysis of odds ratios using a random-effects model has a number of potential problems. An attractive alternative approach for the meta-analysis of binary outcomes uses a class of generalized linear mixed models (GLMMs). GLMMs are believed to overcome the problems of the standard random-effects model because they use a correct binomial-normal likelihood. However, this belief is based on theoretical considerations, and no sufficient simulations have assessed the performance of GLMMs in meta-analysis. This gap may be due to the computational complexity of these models and the resulting considerable time requirements.

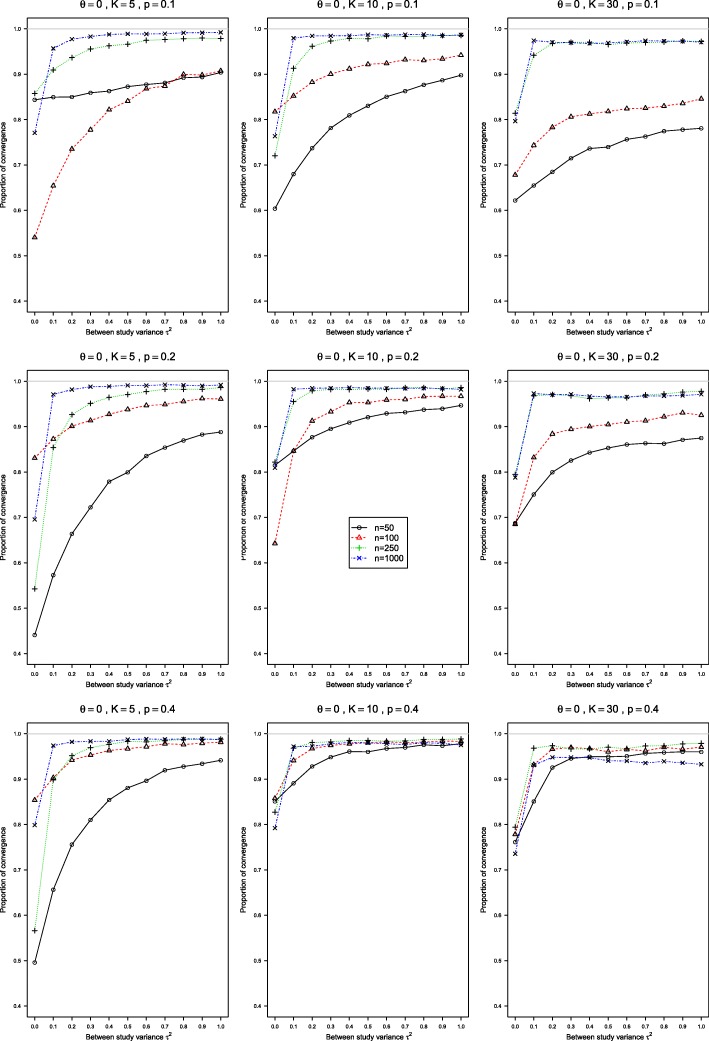
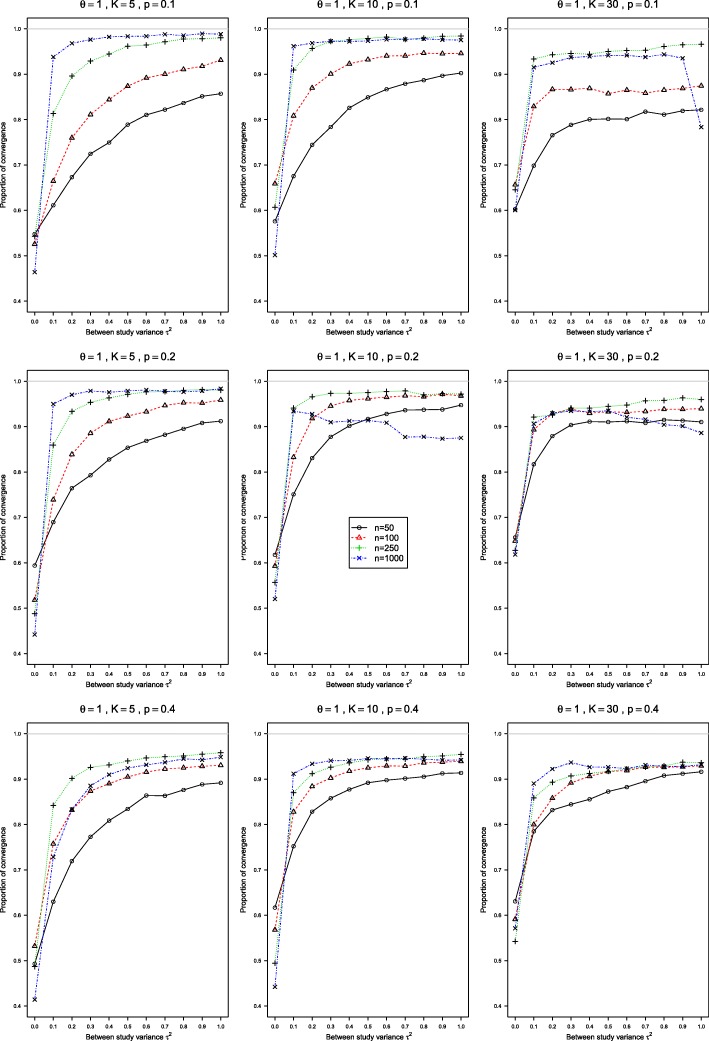
Methods: The present study is the first to provide extensive simulations on the performance of four GLMM methods (models with fixed and random study effects and two conditional methods) for meta-analysis of odds ratios in comparison to the standard random effects model.

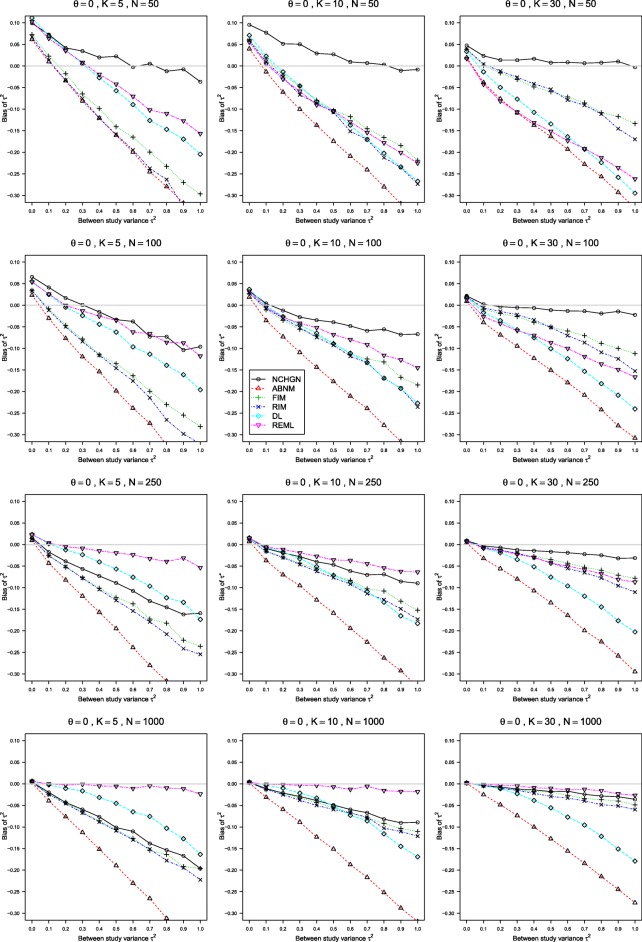
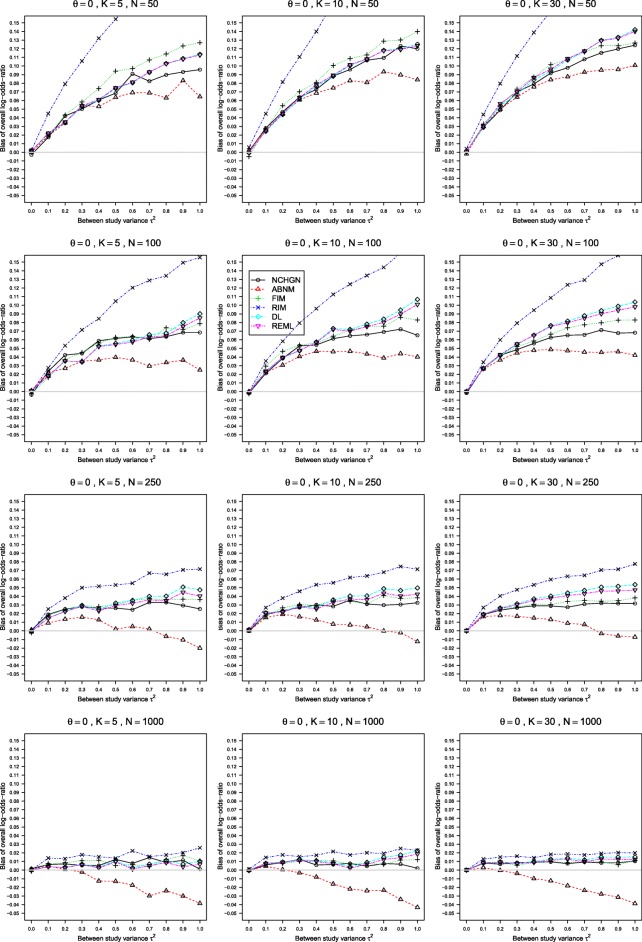
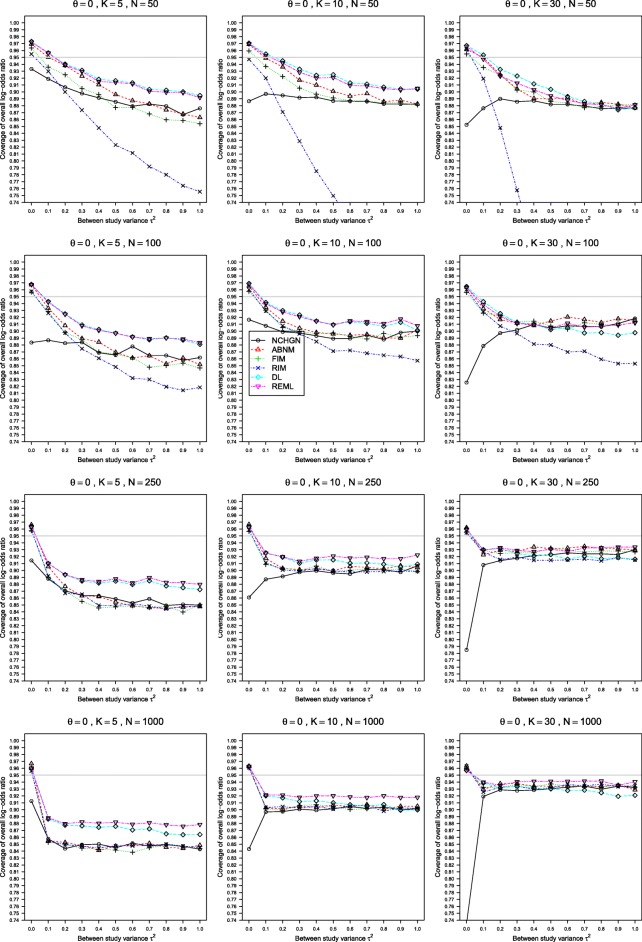
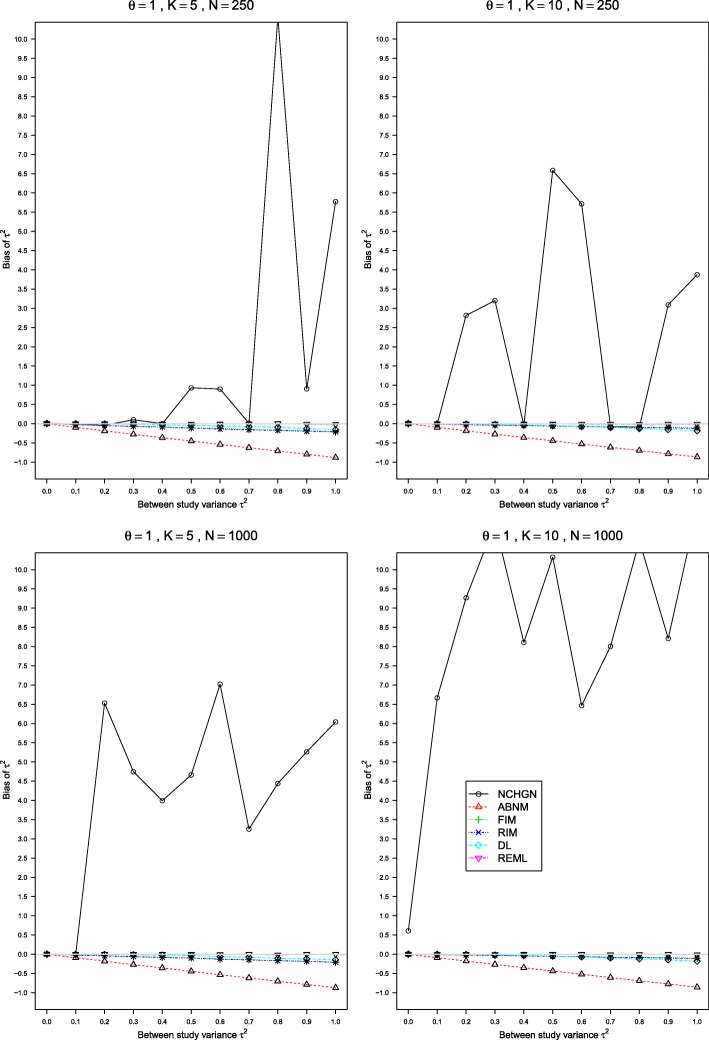
Results: In our simulations, the hypergeometric-normal model provided less biased estimation of the heterogeneity variance than the standard random-effects meta-analysis using the restricted maximum likelihood (REML) estimation when the data were sparse, but the REML method performed similarly for the point estimation of the odds ratio, and better for the interval estimation.

Conclusions: It is difficult to recommend the use of GLMMs in the practice of meta-analysis. The problem of finding uniformly good methods of the meta-analysis for binary outcomes is still open.

Keywords: Generalized linear mixed-effects models; Hypergeometric-normal likelihood; Meta-analysis; Random effects; Transformation bias.


Conflict of interest statement

Ethics approval and consent to participate

Not applicable.

Consent for publication

Not applicable.

Competing interests

The authors declare that they have no competing interests.

Publisher’s Note

Springer Nature remains neutral with regard to jurisdictional claims in published maps and institutional affiliations.

Figures

Fig. 1
Fig. 1
Bias of τ2 in the REM when pi2=0.1, θ=0, 0≤τ2≤1 and n=50,100,250,1000. Estimation methods are: pluses - unconditional generalized linear mixed-effects model with fixed study effects (FIM), crosses - unconditional generalized linear mixed-effects model with random study effects (RIM), circles - a conditional generalized linear mixed-effects model with exact likelihood (NCHGN), triangles - a conditional generalized linear mixed-effects model with approximate likelihood (ABNM), rhombs - DerSimonian and Laird method (DL) and reverse triangles - restricted maximum likelihood method (REML). Light grey line at 0
Fig. 2
Fig. 2
Bias of θ in the REM when pi2=0.1, θ=0, 0≤τ2≤1 and n=50,100,250,1000. Estimation methods are: pluses - unconditional generalized linear mixed-effects model with fixed study effects (FIM), crosses - unconditional generalized linear mixed-effects model with random study effects (RIM), circles - a conditional generalized linear mixed-effects model with exact likelihood (NCHGN), triangles - a conditional generalized linear mixed-effects model with approximate likelihood (ABNM), rhombs - DerSimonian and Laird method (DL) and reverse triangles - restricted maximum likelihood method (REML). Light grey line at 0
Fig. 3
Fig. 3
Estimated coverage of θ in the REM when pi2=0.1, θ=0, 0≤τ2≤1 and n=50,100,250,1000. The coverages are given at the nominal 95% level. Estimation methods are: pluses - unconditional generalized linear mixed-effects model with fixed study effects (FIM), crosses - unconditional generalized linear mixed-effects model with random study effects (RIM), circles - a conditional generalized linear mixed-effects model with exact likelihood (NCHGN), triangles - a conditional generalized linear mixed-effects model with approximate likelihood (ABNM), rhombs - DerSimonian and Laird method (DL) and reverse triangles - restricted maximum likelihood method (REML). Light grey line at 0.95
Fig. 4
Fig. 4
Bias of τ2 in the REM when pi2=0.4, θ=1, 0≤τ2≤1 and n=50,100,250,1000. Estimation methods are: pluses - unconditional generalized linear mixed-effects model with fixed study effects (FIM), crosses - unconditional generalized linear mixed-effects model with random study effects (RIM), circles - a conditional generalized linear mixed-effects model with exact likelihood (NCHGN), triangles - a conditional generalized linear mixed-effects model with approximate likelihood (ABNM), rhombs - DerSimonian and Laird method (DL) and reverse triangles - restricted maximum likelihood method (REML). Light grey line at 0.95
Fig. 5
Fig. 5
Proportion of convergence in the conditional generalized linear mixed-effects model with exact likelihood. These proportions of convergence are for pi2=0.1, pi2=0.2, pi2=0.4, θ=0, and 0≤τ2≤1 for sample sizes n=50,100,250,1000 in each arm
Fig. 6
Fig. 6
Proportion of convergence in the conditional generalized linear mixed-effects model with exact likelihood. These proportions of convergence are for pi2=0.1, pi2=0.2, pi2=0.4, θ=1, and 0≤τ2≤1 for sample sizes n=50,100,250,1000 in each arm

Similar articles

Cited by

References

    1. Higgins J, Thompson SG, Spiegelhalter DJ. A re-evaluation of random-effects meta-analysis. J R Stat Soc Ser A (Stat Soc) 2009;172(1):137–59. doi: 10.1111/j.1467-985X.2008.00552.x. - DOI - PMC - PubMed
    1. Mosteller F, Colditz GA. Understanding research synthesis (meta-analysis) Annu Rev Public Health. 1996;17(1):1–23. doi: 10.1146/annurev.pu.17.050196.000245. - DOI - PubMed
    1. Stijnen T, Hamza TH, Özdemir P. Random effects meta-analysis of event outcome in the framework of the generalized linear mixed model with applications in sparse data. Stat Med. 2010;29(29):3046–67. doi: 10.1002/sim.4040. - DOI - PubMed
    1. Kulinskaya E, Morgenthaler S, Staudte RG. Combining statistical evidence. Int Stat Rev. 2014;82(2):214–42. doi: 10.1111/insr.12037. - DOI
    1. Hoaglin DC. Misunderstandings about Q and ’Cochran’s Q test’ in meta-analysis. Stat Med. 2016;35(4):485–95. doi: 10.1002/sim.6632. - DOI - PubMed

Publication types

LinkOut - more resources