. 2018 Jul 4;11(1):39.
doi: 10.1186/s13041-018-0383-6.

Interleukin-1 beta promotes neuronal differentiation through the Wnt5a/RhoA/JNK pathway in cortical neural precursor cells

Affiliations

Interleukin-1 beta promotes neuronal differentiation through the Wnt5a/RhoA/JNK pathway in cortical neural precursor cells

Shin-Young Park et al. Mol Brain. .

Abstract

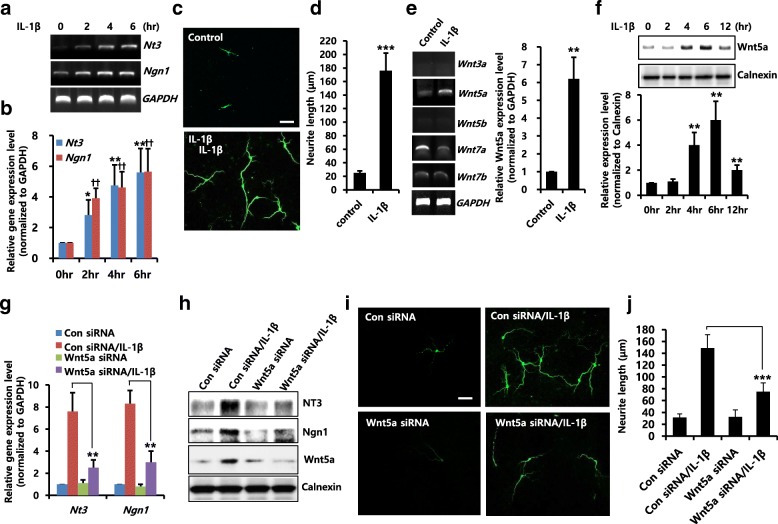
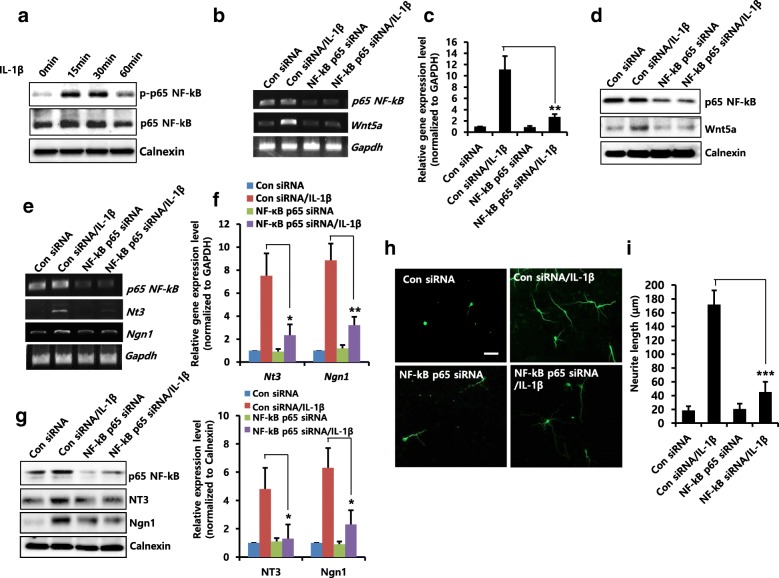
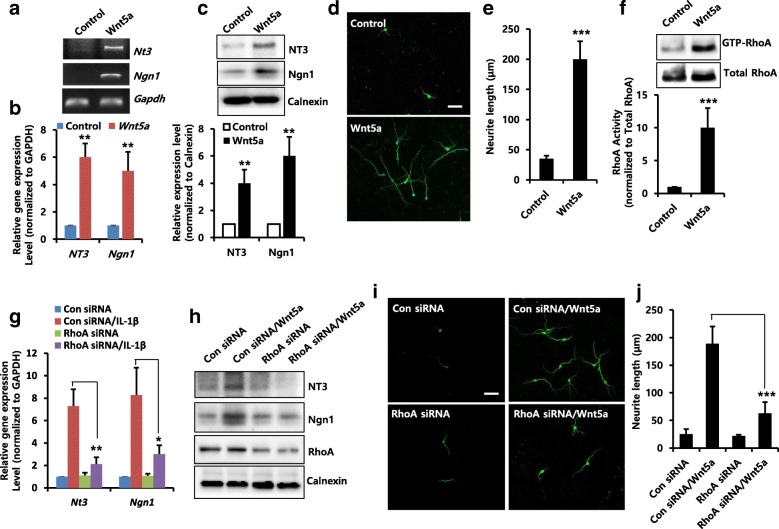
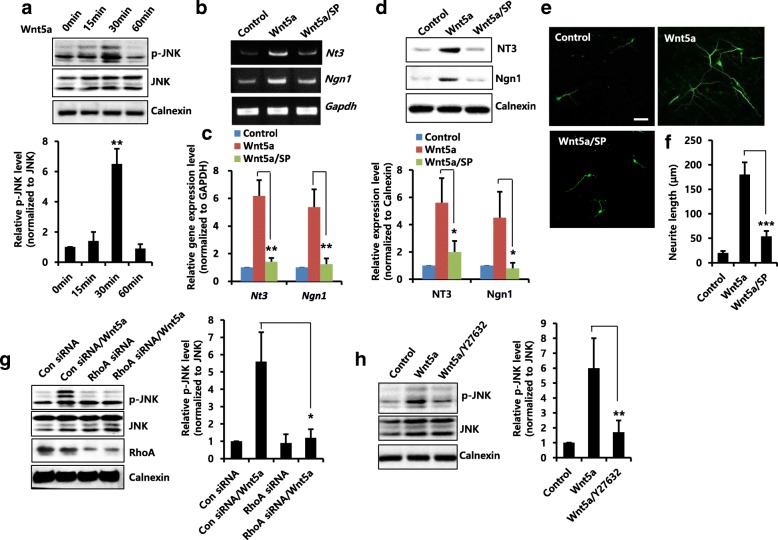
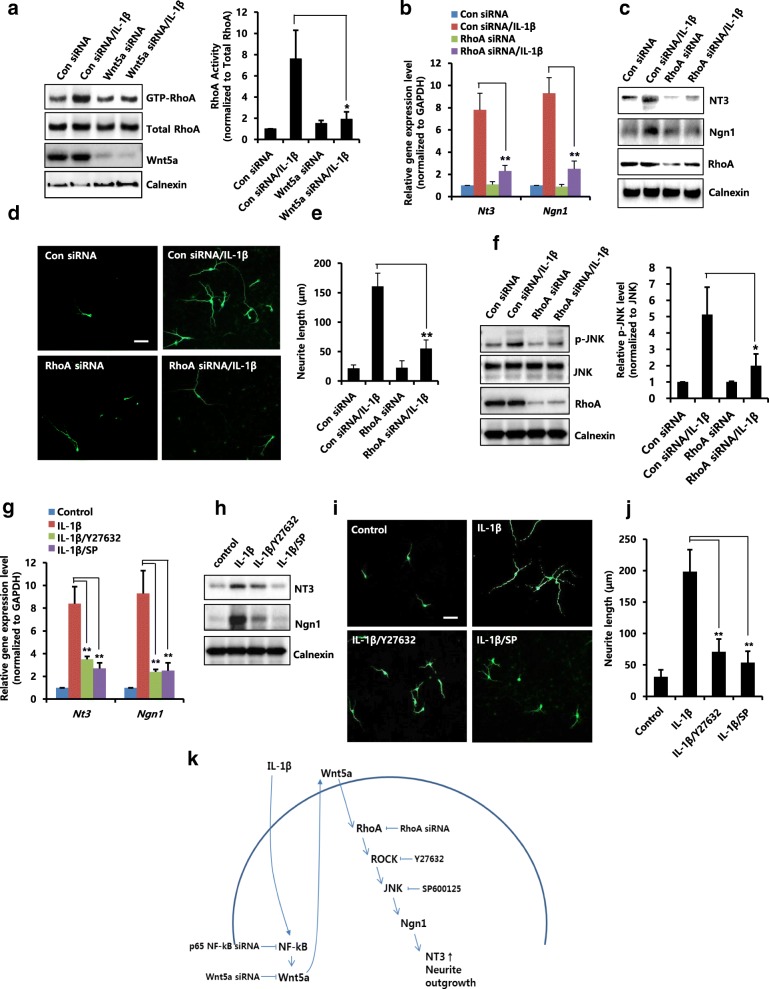
Pro-inflammatory cytokine interleukin-1 beta (IL-1β) is a key mediator of inflammation and stress in the central nervous system (CNS), and is highly expressed in the developing brain. In this study, we investigated the possible role of IL-1β in neuronal differentiation of cortical neural precursor cells (NPCs). We showed that stimulation with IL-1β increased expression levels of neurotrophin-3 (NT3) and neurogenin 1 (Ngn1) and promoted neurite outgrowth. We also found that IL-1β increased mRNA and protein levels of Wnt5a. Knockdown of Wnt5a by transfection with Wnt5a siRNA inhibited IL-1β-induced neuronal differentiation. Moreover, IL-1β-induced Wnt5a expression was regulated by nuclear factor kappa B (NF-κB) activation, which is involved in IL-1β-mediated neuronal differentiation. To examine the role of Wnt5a in neuronal differentiation of NPCs, we exogenously added Wnt5a. We found that exogenous Wnt5a promotes neuronal differentiation, and activates the RhoA/Rho-associated kinase (ROCK)/c-jun N-terminal kinase (JNK) pathway. In addition, Wnt5a-induced neuronal differentiation was blocked by RhoA siRNA, as well as by a specific Rho-kinase inhibitor (Y27632) or a SAPK/JNK inhibitor (SP600125). Furthermore, treatment with RhoA siRNA, Y27632, or SP600125 suppressed the IL-1β-induced neuronal differentiation. Therefore, these results suggest that the sequential Wnt5a/RhoA/ROCK/JNK pathway is involved in IL-1β-induced neuronal differentiation of NPCs.

Keywords: C-jun N-terminal kinase (JNK); Interleukin-1 beta (IL-1β); Neuronal differentiation; RhoA; Wnt5a.


Conflict of interest statement

Ethics approval

All experimental animal procedures (Sprague-Dawley rats) were approved by the Institutional Animal Care and Use Committee (IACUC) at Hanyang College of Medicine under approval number HY-IACUC-17-0035. Experiments were performed in accordance with the NIH guidelines.

Consent for publication

Not applicable.

Competing interests

The authors declare that they have no competing interests.

Publisher’s Note

Springer Nature remains neutral with regard to jurisdictional claims in published maps and institutional affiliations.

Figures

Fig. 1
Fig. 1
Effects of IL-1β-induced Wnt5a expression on neuronal differentiation. NPCs were treated with IL-1β (10 ng/ml) for the indicated time durations and mRNA levels of Nt3, Ngn1 were analyzed by RT-PCR (a) and real-time RT-PCR (b). n = 3. Data are mean ± SD; Student’s t test. * p < 0.05, ** p < 0.01, ††p < 0.01 compared with 0 h control, for Nt3 and Ngn1 respectively. c and d NPCs were treated with IL-1β (10 ng/ml) for 3 days, and they were stained with anti-Tuj1 to visualize neurite extensions. Scale bar, 20 μm. d Neurite lengths were measured in randomly selected fields using three independent experiments. n = 3 per group. Data are mean ± SD; Student’s t test. *** p < 0.001 compared with untreated control. e NPCs were treated with IL-1β (10 ng/ml) for 2 h. mRNA levels of Wnt3a, Wnt5a, Wnt5b, Wnt7a, and Wnt7b were analyzed by RT-PCR (left). mRNA level of Wnt5a was analyzed by real-time RT-PCR (right). n = 3. Data are mean ± SD; Student’s t test. ** p < 0.01 compared with control. f NPCs were treated with IL-1β (10 ng/ml) for the indicated time durations, and cells were lysed. Western blotting was performed using anti-Wnt5a or anti-calnexin antibodies to detect the respective protein bands. Graphs show mean densities as percentage change for three independent experiments (n = 3). Band intensity was quantified with Quantity Ones® software. Data are mean ± SD; Student’s t test. ** p < 0.01 compared with 0 h control. g and h Cells were transiently transfected with control siRNA or Wnt5a siRNA for 48 h, and then treated for 6 h (g) or 2 days (h) with IL-1β (10 ng/ml). g mRNA levels of Nt3 and Ngn1 were analyzed by real-time RT-PCR. The results are based on three independent experiments (n = 3). Data are mean ± SD; Student’s t test. ** p < 0.01 compared with control siRNA/IL-1β. h Western blotting was performed using anti-NT3, anti-Ngn1, anti-Wnt5a or anti-calnexin antibodies to detect the respective protein bands (i). Cells were transiently transfected with control siRNA or Wnt5a siRNA for 48 h, and then treated for 3 days with IL-1β (10 ng/ml). They were then stained with anti-Tuj1. Scale bar, 20 μm. j Neurite lengths were measured in randomly selected fields using four independent experiments. n = 4 per group. Data are mean ± SD; Student’s t test. *** p < 0.001 compared with control siRNA/IL-1β
Fig. 2
Fig. 2
Effects of NF-κB on IL-1β–induced Wnt5a expression and neuronal differentiation. a NPCs were treated with IL-1β (10 ng/ml) for the indicated time durations, lysed, and harvested. Western blotting was performed using anti-p-p65 NF-κB, anti-p65 NF-κB, or anti-calnexin antibodies to detect the respective protein bands. b-d Cells were transiently transfected with control siRNA or NF-κB p65 siRNA for 48 h, and then treated for 2 h (b and c) or 6 h (d) with IL-1β (10 ng/ml). mRNA levels of Wnt5a were estimated by RT-PCR (b) and real-time RT-PCR (c). n = 3. Data are mean ± SD; Student’s t test. ** p < 0.01 compared with control siRNA/IL-1β. d Western blotting was performed using anti-p65 NF-κB, anti-Wnt5a, or anti-calnexin antibodies to detect the respective protein bands. e and f Cells were transiently transfected with control siRNA or NF-κB p65 siRNA for 48 h, and then treated for 6 h with IL-1β (10 ng/ml). mRNA levels of Nt3 and Ngn1 were analyzed by RT-PCR (e) and real-time RT-PCR (f). n = 3. Data are mean ± SD; Student’s t test. * p < 0.05, ** p < 0.01 compared with control siRNA/IL-1β. g Cells were transiently transfected with control siRNA or NF-κB p65 siRNA for 48 h, and then treated for 2 days with IL-1β (10 ng/ml). Western blotting was performed using anti-p65 NF-κB, anti-NT3, anti-Ngn1, or anti-calnexin antibodies to detect the respective protein bands. Graphs show mean densities as fold change for three independent experiments (n = 3). Band intensity was quantified with Quantity Ones® software. Data are mean ± SD; Student’s t test. p < 0.05 compared with control siRNA/IL-1β. h and i Cells were transiently transfected with control siRNA or NF-κB p65 siRNA for 48 h, and then treated for 3 days with IL-1β (10 ng/ml). They were then stained with anti-Tuj1. Scale bar, 20 μm. i Neurite lengths were measured in randomly selected fields using four independent experiments. n = 4 per group. Data are mean ± SD; Student’s t test. *** p < 0.001 as compared to control siRNA/IL-1β
Fig. 3
Fig. 3
Effects of exogenous Wnt5a on Rho A activity and neuronal differentiation. NPCs were stimulated with Wnt5a (20 ng/ml) for 6 h, and mRNA levels of Nt3 and Ngn1 were analyzed by RT-PCR (a) and real time-RT-PCR (b). n = 3. Data are mean ± SD; Student’s t test. ** p < 0.01 compared with the untreated control. c Cells were treated with Wnt5a (20 ng/ml) for 2 days, and then lysed and harvested. Western blotting was performed using anti-NT3, anti-Ngn1, or anti-calnexin to detect respective protein bands. Graphs show mean densities as fold change for three independent experiments (n = 3). Band intensity was quantified with Quantity Ones® software. Data are mean ± SD; Student’s t test. ** p < 0.01 compared with untreated cells. d and e NPCs were treated with Wnt5a (20 ng/ml) for 3 days, and were stained with anti-Tuj1 to visualize neurite extensions. Scale bar, 20 μm. e Neurite lengths were measured in randomly selected fields using three independent experiments. n = 3 per group. Data are mean ± SD; Student’s t test. ** p < 0.01 compared with untreated control. f GTP-loaded RhoA activity was measured using a pull-down assay, as described in the Materials and Methods section, after treatment of cells for 15 min with Wnt5a (20 ng/ml). The data were normalized to the amount of total RhoA. Graphs show mean densities as fold change for four independent experiments (n = 4). Band intensity was quantified with Quantity Ones® software. Data are mean ± SD; Student’s t test. *** p < 0.001 compared with the untreated control. g and h Cells were transiently transfected with control siRNA or RhoA siRNA for 48 h, and then treated for 6 h (g) or 2 days (h) with Wnt5a (20 ng/ml). g mRNA levels of Nt3 and Ngn1 were analyzed by real-time RT-PCR. n = 3. Data are mean ± SD; Student’s t test. * p < 0.05, ** p < 0.01 compared with control siRNA/Wnt5a. h Western blotting was performed using anti-NT3, anti-Ngn1, anti-RhoA, or anti-calnexin to detect the respective protein bands. i and j Cells were transiently transfected with control siRNA or RhoA siRNA for 48 h, and then treated for 3 days with Wnt5a (20 ng/ml). They were then stained with anti-Tuj1. Scale bar, 20 μm. j Neurite lengths were measured in randomly selected fields using five independent experiments. n = 5 per group. Data are mean ± SD; Student’s t test. *** p < 0.001 compared with control siRNA/Wnt5a
Fig. 4
Fig. 4
Effects of Wnt5a/RhoA/ROCK pathway on JNK activation and neuronal differentiation. a NPCs were treated with Wnt5a (20 ng/ml) for the indicated time duration, lysed and harvested. Western blotting was performed using anti-p-JNK, anti-JNK, or anti-calnexin to detect the respective protein bands. Graphs show mean densities as fold change for three independent experiments (n = 3). Band intensity was quantified with Quantity Ones® software. Data are mean ± SD; Student’s t test. ** p < 0.01 compared with 0 min. b and c Cells were pretreated with 2 μM SP600125 (SP) for 1 h and stimulated with Wnt5a (20 ng/ml) for 6 h. mRNA levels of NT3 and Ngn1 were analyzed by RT-PCR (b) and real-time RT-PCR (c). n = 3. Data are mean ± SD; Student’s t test. ** p < 0.01 as compared to Wnt5a-treated cells. d Cells were pretreated with 2 μM SP for 1 h and treated with Wnt5a (20 ng/ml) for 2 days. Western blotting was performed using an anti-NT3, anti-Ngn1, or anti-calnexin to detect the respective protein bands. Graphs show mean densities as fold change from three independent experiments (n = 3). Band intensity was quantified with Quantity Ones® software. Data are mean ± SD; Student’s t test. * p < 0.05 compared with Wnt5a-treated cells. e and f Cells were pretreated with 2 μM SP for 1 h and treated with Wnt5a (20 ng/ml) for 3 days. They were then stained with anti-Tuj1. Scale bar, 20 μm. f Neurite lengths were measured in randomly selected fields using four independent experiments. n = 4 per group. Data are mean ± SD; Student’s t test. *** p < 0.001 compared with Wnt5a-treated cells. g Cells were transiently transfected with control siRNA or RhoA siRNA for 48 h, and then treated for 30 min with Wnt5a (20 ng/ml). Western blotting was performed using anti-p-JNK, anti-JNK, anti-RhoA, or anti-calnexin to detect the respective protein bands. Graphs show mean densities as fold change from three independent experiments (n = 3). Band intensity was quantified with Quantity Ones® software. Data are mean ± SD; Student’s t test. * p < 0.05 as compared to control siRNA/Wnt5a. h Cells were pretreated with 5 μM Y27632 for 1 h and stimulated with Wnt5a (20 ng/ml) for 30 min. Western blotting was performed using anti-p-JNK, anti-JNK, or anti-calnexin to detect the respective protein bands. Graphs show mean densities as fold change from three independent experiments (n = 3). Band intensity was quantified with Quantity Ones® software. Data are mean ± SD; Student’s t test. ** p < 0.01 compared with Wnt5a-treated cells
Fig. 5
Fig. 5
Effects of IL-1β on Wnt5a-mediated signaling and neuronal differentiation. a NPCs were transiently transfected with control siRNA or Wnt5a siRNA for 48 h, and then incubated for 15 min with IL-1β (10 ng/ml). GTP-loaded RhoA activity was measured using a pull-down assay, as described in the Materials and Methods section. The data were normalized to the amount of total RhoA. Graphs show mean densities as fold change from three independent experiments (n = 3). Band intensity was quantified with Quantity Ones® software. Data are mean ± SD; Student’s t test. * p < 0.05 compared with control siRNA/IL-1β. b and c Cells were transiently transfected with control siRNA or RhoA siRNA for 48 h, and then incubated for 6 h (B) or 2 days (c) with IL-1β (10 ng/ml). b mRNA levels of Nt3 and Ngn1 were analyzed by real-time RT-PCR. n = 3. Data are mean ± SD; Student’s t test. ** p < 0.01 as compared to control siRNA/IL-1β. c Cells were transiently transfected with control siRNA or RhoA siRNA for 48 h, and then treated for 2 days with IL-1β (10 ng/ml). Western blotting was performed using anti-NT3, anti-Ngn1, anti-RhoA, or anti-calnexin antibodies to detect the respective protein bands. d and e Cells were transiently transfected with control siRNA or RhoA siRNA for 48 h, and then incubated for 3 days with IL-1β (10 ng/ml). They were then stained with anti-Tuj1. Scale bar, 20 μm. e Neurite lengths were measured in randomly selected fields using three independent experiments. n = 3 per group. Data are mean ± SD; Student’s t test. ** p < 0.01 compared with control siRNA/IL-1β. f Cells were transiently transfected with control siRNA or RhoA siRNA for 48 h, and then treated for 30 min with IL-1β (10 ng/ml). Western blotting was performed using anti-p-JNK, anti-JNK, anti-RhoA or anti-calnexin antibodies to detect the respective protein bands. Graphs show mean densities as fold change for three independent experiments (n = 3). Band intensity was quantified with Quantity Ones® software. Data are mean ± SD; Student’s t test. * p < 0.05 compared with control siRNA/IL-1β. g and h Cells were pretreated with 5 μM Y27632 or 2 μM SP for 1 h, and then treated with IL-1β (10 ng/ml) for 6 h (g) or 2 days (h). g mRNA levels of Nt3 and Ngn1 were analyzed by real-time RT-PCR. n = 3. Data are mean ± SD; Student’s t test. ** p < 0.01 compared with IL-1β-treated cells. h Cells were pretreated with 5 μM Y27632 or 2 μM SP for 1 h, and then treated with IL-1β (10 ng/ml) for 2 days. Western blotting was performed using anti-NT3, anti-Ngn1 or anti-calnexin antibodies to detect the respective protein bands. (I and J) Cells were pretreated with 5 μM Y27632 or 2 μM SP for 1 h, and then treated with IL-1β (10 ng/ml) for 3 days. They were then stained with anti-Tuj1. Scale bar, 20 μm. j Neurite lengths were measured in randomly selected fields using three independent experiments. n = 3 per group. Data are mean ± SD; Student’s t test. ** p < 0.01 as compared to IL-1β-treated cells. k Proposed model for the signaling pathway in IL-1β-mediated neurite outgrowth of cortical NPCs. The model suggests that IL-1β-induced Wnt5a plays a major stimulatory role in neuronal differentiation and that it acts through the RhoA/ROCK/JNK pathway, leading to neurite outgrowth

Similar articles

Cited by

References

    1. Boato F, Hechler D, Rosenberger K, Ludecke D, Peters EM, Nitsch R, Hendrix S. Interleukin-1 beta and neurotrophin-3 synergistically promote neurite growth in vitro. J Neuroinflammation. 2011;8:183. doi: 10.1186/1742-2094-8-183. - DOI - PMC - PubMed
    1. O'Leime CS, Cryan JF, Nolan YM. Nuclear deterrents: intrinsic regulators of IL-1beta-induced effects on hippocampal neurogenesis. Brain Behav Immun. 2017;66:394–412. doi: 10.1016/j.bbi.2017.07.153. - DOI - PubMed
    1. Sims JE, Gayle MA, Slack JL, Alderson MR, Bird TA, Giri JG, Colotta F, Re F, Mantovani A, Shanebeck K, et al. Interleukin 1 signaling occurs exclusively via the type I receptor. Proc Natl Acad Sci U S A. 1993;90:6155–6159. doi: 10.1073/pnas.90.13.6155. - DOI - PMC - PubMed
    1. Loddick SA, Rothwell NJ. Neuroprotective effects of human recombinant interleukin-1 receptor antagonist in focal cerebral ischaemia in the rat. J Cereb Blood Flow Metab. 1996;16:932–940. doi: 10.1097/00004647-199609000-00017. - DOI - PubMed
    1. Huang FP, Wang ZQ, Wu DC, Schielke GP, Sun Y, Yang GY. Early NFkappaB activation is inhibited during focal cerebral ischemia in interleukin-1beta-converting enzyme deficient mice. J Neurosci Res. 2003;73:698–707. doi: 10.1002/jnr.10654. - DOI - PubMed

Publication types

MeSH terms