. 2018 Jul 4;37(1):136.
doi: 10.1186/s13046-018-0781-8.

Up-regulation of FGF15/19 signaling promotes hepatocellular carcinoma in the background of fatty liver

Affiliations

Up-regulation of FGF15/19 signaling promotes hepatocellular carcinoma in the background of fatty liver

Guozhen Cui et al. J Exp Clin Cancer Res. .

Abstract

Background: Upregulated fibroblast growth factor 19 (FGF19) expression in human hepatocellular carcinoma (HCC) specimens is associated with tumor progression and poor prognosis. Nonalcoholic steatohepatitis (NASH) patients are at high risk for malignant transformation into HCC.

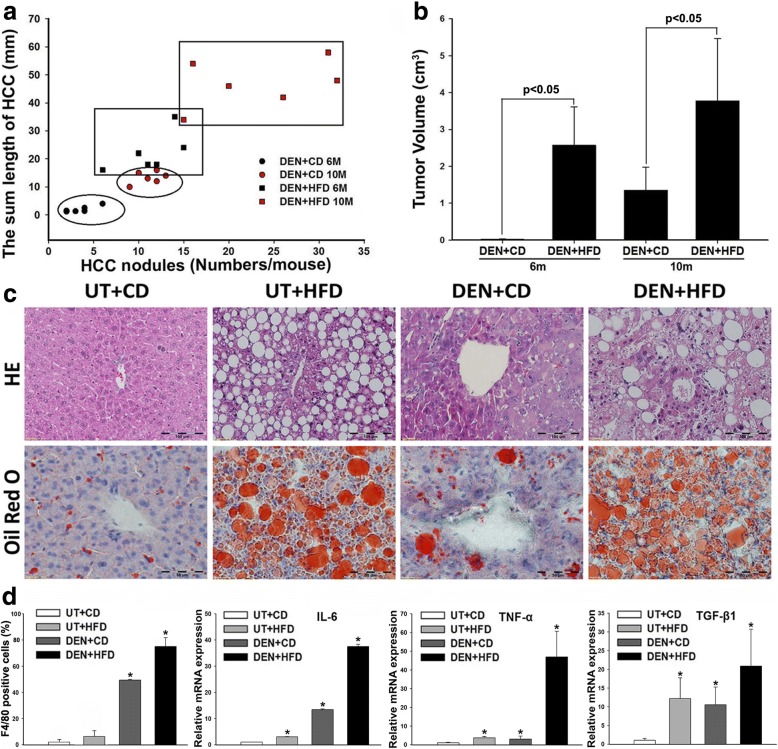
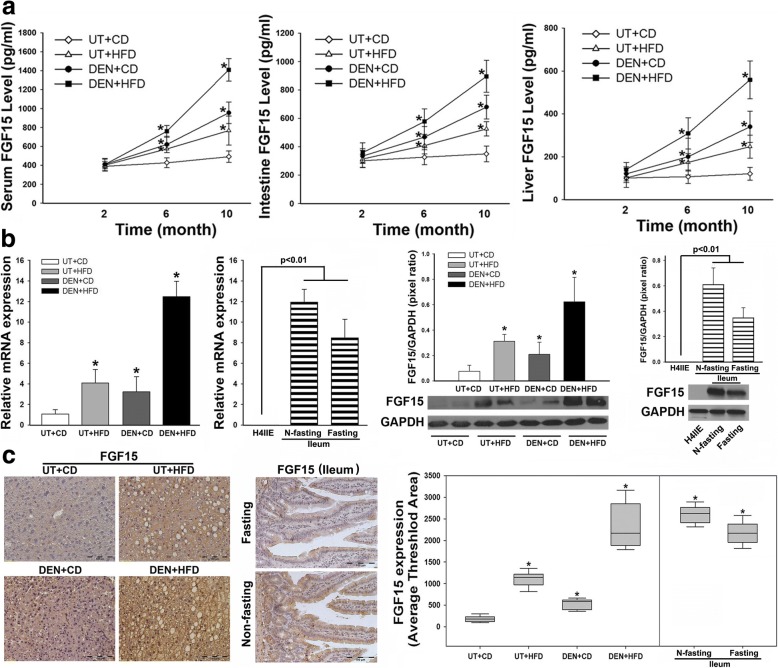
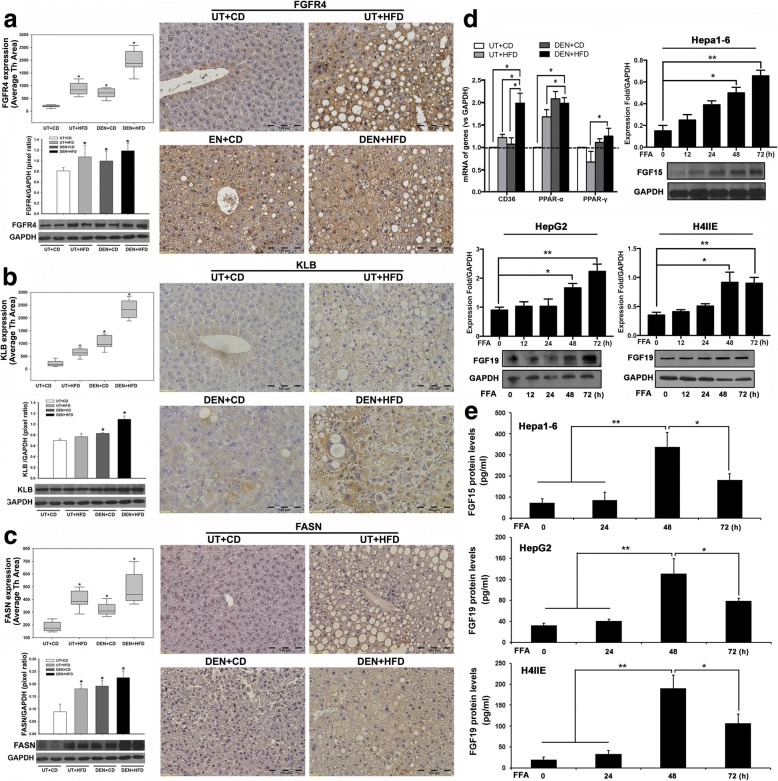
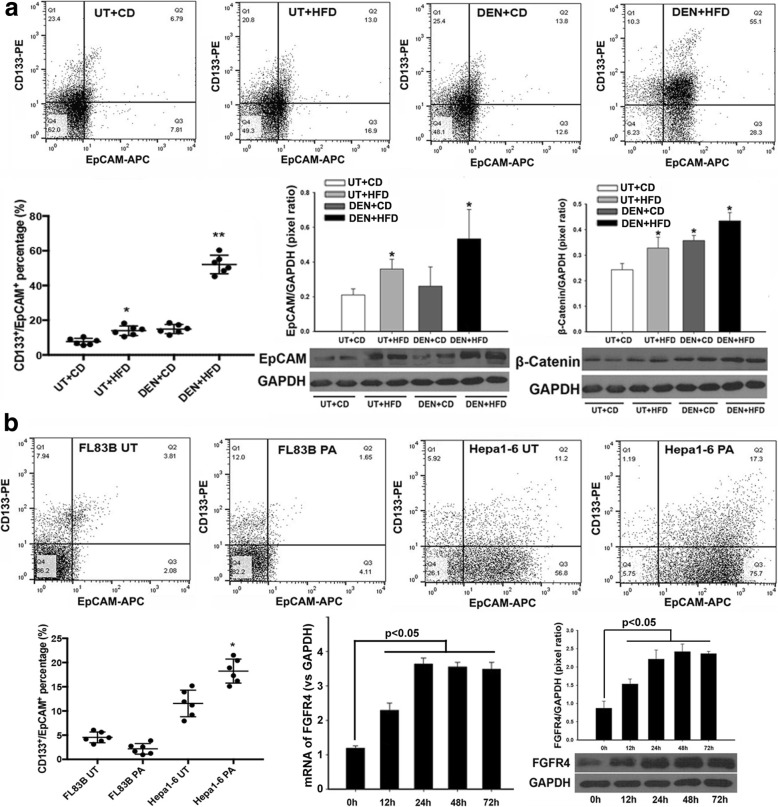
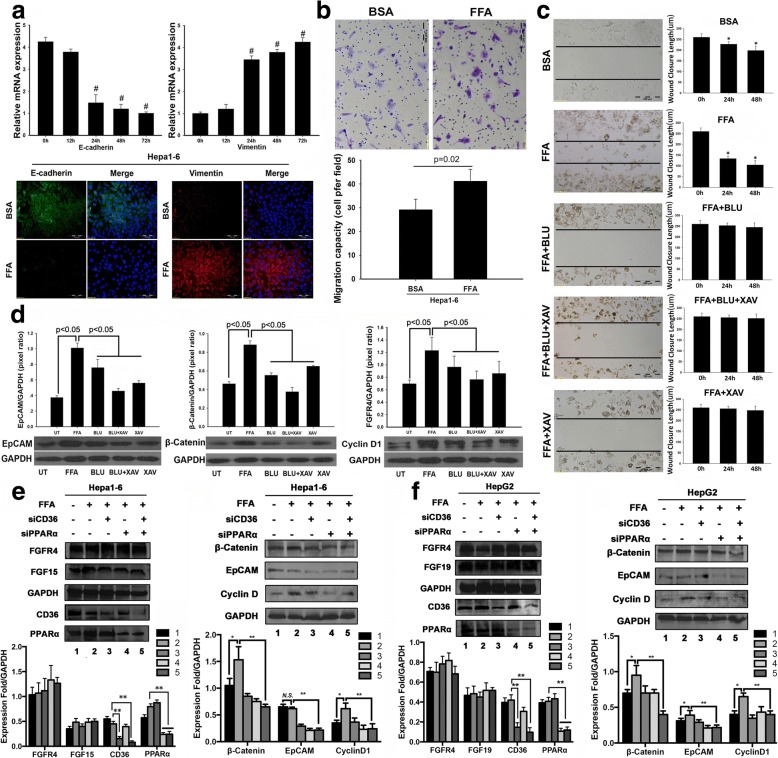
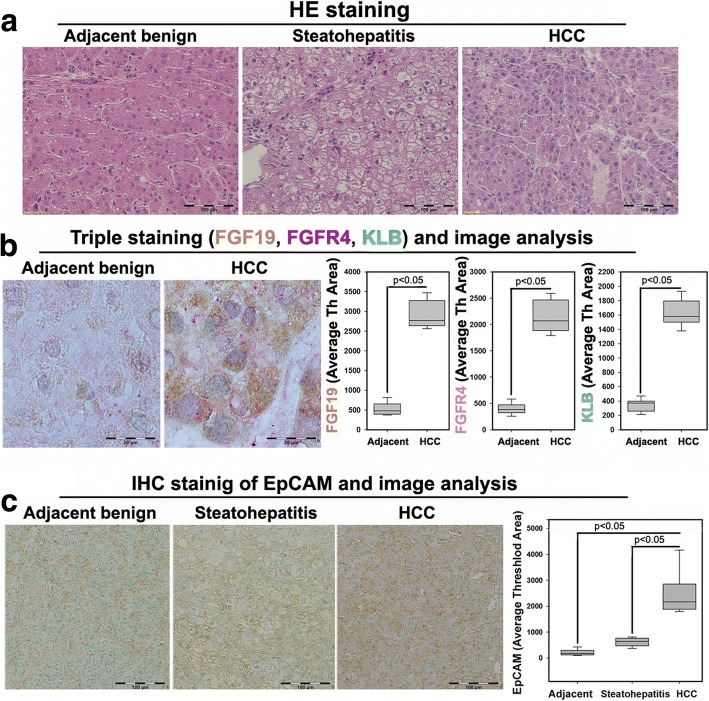
Methods: A steatohepatitis-HCC model was established in male C57L/J mice treated with N-nitrosodiethylamine (DEN) and high-fat diet (HFD). A mouse HCC cell line (Hepa1-6) and a mouse hepatocyte line (FL83B) were used to elucidate the mechanism by free fatty acids (FFA) treatment. FGF15, the mouse orthologue of FGF19, and it receptor fibroblast growth factor receptor4 (FGFR4) as well as co-receptor β-klotho were studied. FGF19 signaling was also studied in human samples of HCC with steatohepatitis.

Results: HCC incidence and tumor volume were significantly increased in the DEN+HFD group compared to that in the DEN+control diet (CD) group. Increased levels of FGF15/FGFR4/β-klotho, aberrant epithelial-mesenchymal transition (EMT) and Wnt/β-catenin signaling were detected in DEN+HFD mice. Blockage of the FGF15 signal can attenuate cell migration ability and aberrant EMT and Wnt/β-catenin signaling.

Conclusions: Up-regulated FGF15/FGFR4 signaling promoted the development of HCC by activation of EMT and Wnt/β-catenin signaling in the lipid metabolic disorder microenvironment. Further investigation of FGF19/FGFR4 signaling is important for potential early diagnosis and therapeutic targeting in HCC patients.

Keywords: Fibroblast growth factor 15/19; Hepatocellular carcinoma; Steatohepatitis.


Conflict of interest statement

Ethics approval

The animal procedures were approved by the Institutional Animal Care and Use Committee of University of Louisville, which is certified by the American Association for Accreditation of Laboratory Animal Care.

Competing interests

The authors declare that they have no competing interests.

Publisher’s Note

Springer Nature remains neutral with regard to jurisdictional claims in published maps and institutional affiliations.

Figures

Fig. 1
Fig. 1
a The HCC tumor growth pattern represented as the regression of HCC nodule length and HCC nodule numbers in individual HCC mouse. b Tumor volume from 4 groups at month 6 and month 10. c Representative histological changes from all 4 experimental groups at month 10. Histological changes of NASH-HCC in DEN+HFD mice were identified in tissue sections by H&E staining. Lipid drops were identified in tissue sections by Oil red O staining. NASH was found typically affecting the liver parenchyma with macrovesicular changes presented in a predominantly perivenular distribution. In addition to fatty change, many hepatocytes in acinar showed ballooning and contain Mallory’s hyaline, and mixed infiltrate of inflammatory cells. UT: untreated; CD: control diet; HFD: high fat diet; DEN: N-nitrosodiethylamine. d Positive F4/80 cells and mRNA expressions (IL-6, TNF-α and TGF-β1) in the liver tissues from 4 groups at month 6 and month 10. *, P < 0.05 vs UT + CD
Fig. 2
Fig. 2
a The protein levels of FGF15 in serum, ileum and liver tissue by ELISA assays. b the FGF15 mRNA levels and protein levels from 4 groups at month 10. The lysates of ileal tissues from fasting and non-fasting wild type mice are used as positive controls for FGF15, while the lysate of H4IIE cells, a rat hepatoma cell line, is used as a negative control because rats do not express FGF15. N-fasting: non-fasting. c Representative images of FGF15 protein distribution in hepatic parenchyma and computer image-quantification in all 4 experimental groups at month 10 by immunohistochemical staining. Ileal tissues from fasting and non-fasting wild type mice are used as positive controls for FGF15 IHC staining. N-fasting: non-fasting. UT: untreated; CD: control diet; HFD: high fat diet; DEN: N-nitrosodiethylamine. *, P < 0.05 vs UT + CD
Fig. 3
Fig. 3
a-c Representative images of IHC for FGFR4, β-klotho, and FASN in hepatic tissues and protein expression by computer image-quantification, and Western blot analysis of protein levels in the 4 experimental groups at month 10. The protein expression by computer image-quantification presented as Average Threshold Area (Average Th Area). The protein levels of Western blot analysis were quantified by image analysis and presented as pixel ratio over the control GAPDH. KLB: β-klotho; UT: untreated; CD: control diet; HFD: high fat diet; DEN: N-nitrosodiethylamine. *, P < 0.05 vs UT + CD. d mRNA expressions (CD36, PPAR-α and PPAR-γ) in the liver tissues from 4 groups at month 6 and month 10. Western blot analysis of FGF15 protein levels in three HCC cell lines (Hepal-6, HepG2 and H4IIE) challenged by FFA 0–72 h. Western blot analysis were quantified by image analysis and presented as pixel ratio over the control GAPDH. e The protein levels of FGF15 and FGF19 in the supernatant of Hepa1–6, H4IIE, and HepG2 cells by ELISA assays. *, P < 0.05; **, P < 0.01
Fig. 4
Fig. 4
a EpCAM-positive and CD133-positive cells were evaluated by flow cytometry in the “benign tissues” adjacent to tumor mass as well as in non-tumor tissue. Western blot analysis of EpCAM and β-catenin protein levels in liver tissues from 4 experimental groups at month 10. b EpCAM-positive and CD133-positive cells were evaluated by flow cytometry in FL83B and Hepal-6 cells treated by FFA for 48 h. Time-course study of FGFR4 mRNA and protein levels by qPCR and Western blot in Hepal-6 cells challenged by FFA 0–72 h. Analysis for qPCR and Western blot was presented as the fold ratio over GAPDH control. UT: untreated; CD: control diet; HFD: high fat diet; DEN: N-nitrosodiethylamine; h: hour. *, P < 0.05 vs UT + CD
Fig. 5
Fig. 5
a Time-course study of relative mRNA levels of E-Cadherin and vimentin in hepal-1 cells treated by FFA. The representative images of E-Cadherin and vimentin in hepal-1 cells treated by FFA at 72 h. b A trans-well migration assay to study the migratory ability of Hepal-6 cells in response to FFA treatment. Migration cell number was calculated. c A scratch-wound healing assay to study the migratory ability of Hepal-6 cells in response to FFA treatment. A 250 μm scratch-wound was made on 90% confluent cells in each treatment group. Average length of scratch-wound was calculated in each treatment group and the migratory ability of cells was represented as wound closure length. *: P < 0.05 vs 0 h. d Western blot analysis of EpCAM, β-catenin, FGFR4 and FASN in hepal-1 cells treated by FFA. The protein levels were quantified by image analysis and presented as pixel ratio over the control GAPDH. #: P < 0.05 vs 0 h. FFA: free fatty acid; h: hour. UT: untreated; BLU: BLU9931; XAV: XAV 939. e-f siPPARa and siCD36 as well as the scrambled siRNA were applied to the Hapal-6 and HepG2 cells for 48 h to silence the mRNA of PPAR-α and CD36, and the cells were challenged by FFA for 48 h. Western blot analysis was performed to determine the protein levels of FGF15, FGF19, FGFR4, EpCAM, β-catenin, andcyclin D. 1: scrambled siRNA; 2: FFA; 3: FFA+ siCD36; 4: FFA+ siPPARa; 5: FFA+ siCD36 + siPPARa. N.S.: no significant importance; *, P < 0.05; **, P < 0.01
Fig. 6
Fig. 6
a Representative histology by H&E staining for HCC patients’ hepatic tissues including adjacent benign, steatohepatitis and HCC. b Representative triple staining for FGF19, FGFR4 and β-klotho in HCC patients’ hepatic tissues of adjacent benign and HCC. Brown color: FGF19; Pink color: FGFR4; Green color: β-klotho. The computer quantification of the expression was presented as Average of Threshold Area (Average Th Area). KLB: β-klotho; adjacent: adjacent benign. c Representative immunohistochemical staining of EpCAM and image analysis in HCC patients’ hepatic tissues including adjacent benign, steatohepatitis and HCC

Similar articles

Cited by

References

    1. Miura S, Mitsuhashi N, Shimizu H, Kimura F, Yoshidome H, Otsuka M, Kato A, Shida T, Okamura D, Miyazaki M. Fibroblast growth factor 19 expression correlates with tumor progression and poorer prognosis of hepatocellular carcinoma. BMC Cancer. 2012;12:56. doi: 10.1186/1471-2407-12-56. - DOI - PMC - PubMed
    1. Li Y, Zhang W, Doughtie A, Cui G, Li X, Pandit H, Yang Y, Li S, Martin R. Up-regulation of fibroblast growth factor 19 and its receptor associates with progression from fatty liver to hepatocellular carcinoma. Oncotarget. 2016;7:52329–52339. - PMC - PubMed
    1. Choi M, Moschetta A, Bookout AL, Peng L, Umetani M, Holmstrom SR, Suino-Powell K, Xu HE, Richardson JA, Gerard RD, Mangelsdorf DJ, Kliewer SA. Identification of a hormonal basis for gallbladder filling. Nat Med. 2006;12:1253–1255. doi: 10.1038/nm1501. - DOI - PubMed
    1. Wu X, Li Y. Understanding the structure-function relationship between FGF19 and its mitogenic and metabolic activities. Adv Exp Med Biol. 2012;728:195–213. doi: 10.1007/978-1-4614-0887-1_13. - DOI - PubMed
    1. Kir S, Kliewer SA, Mangelsdorf DJ. Roles of FGF19 in liver metabolism. Cold Spring Harb Symp Quant Biol. 2011;76:139–144. doi: 10.1101/sqb.2011.76.010710. - DOI - PubMed

MeSH terms

Substances