

Predicting Social Anxiety From Global Positioning System Traces of College Students: Feasibility Study
- PMID: 29973337
- PMCID: PMC6053606
- DOI: 10.2196/10101
Predicting Social Anxiety From Global Positioning System Traces of College Students: Feasibility Study
Abstract
Background: Social anxiety is highly prevalent among college students. Current methodologies for detecting symptoms are based on client self-report in traditional clinical settings. Self-report is subject to recall bias, while visiting a clinic requires a high level of motivation. Assessment methods that use passively collected data hold promise for detecting social anxiety symptoms and supplementing self-report measures. Continuously collected location data may provide a fine-grained and ecologically valid way to assess social anxiety in situ.
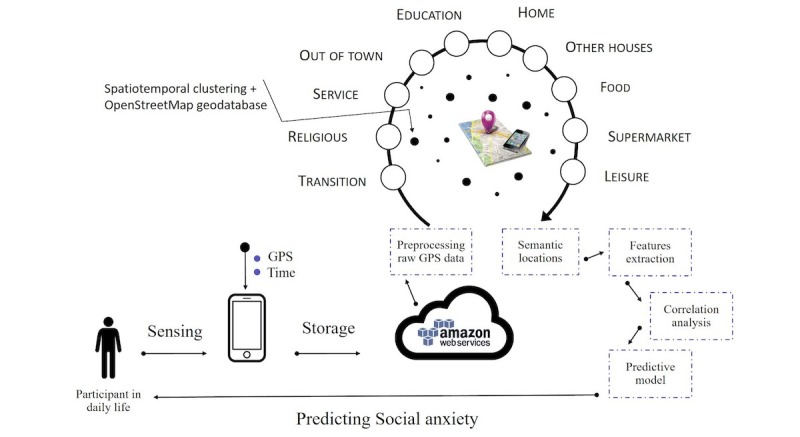
Objective: The objective of our study was to examine the feasibility of leveraging noninvasive mobile sensing technology to passively assess college students' social anxiety levels. Specifically, we explored the different relationships between mobility and social anxiety to build a predictive model that assessed social anxiety from passively generated Global Positioning System (GPS) data.
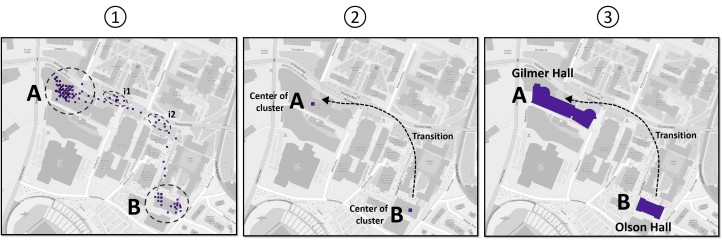
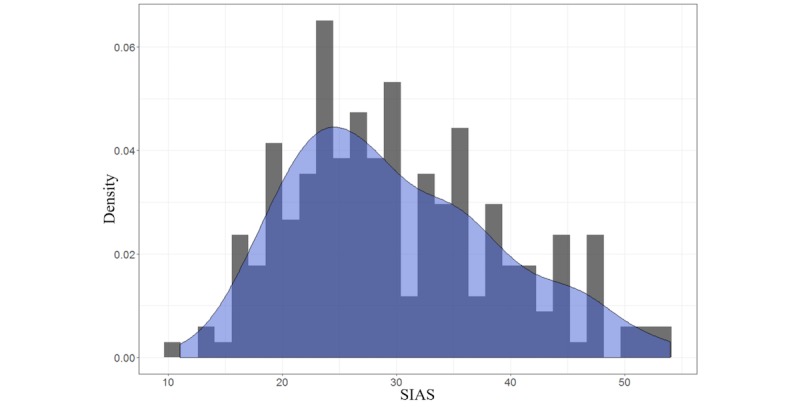
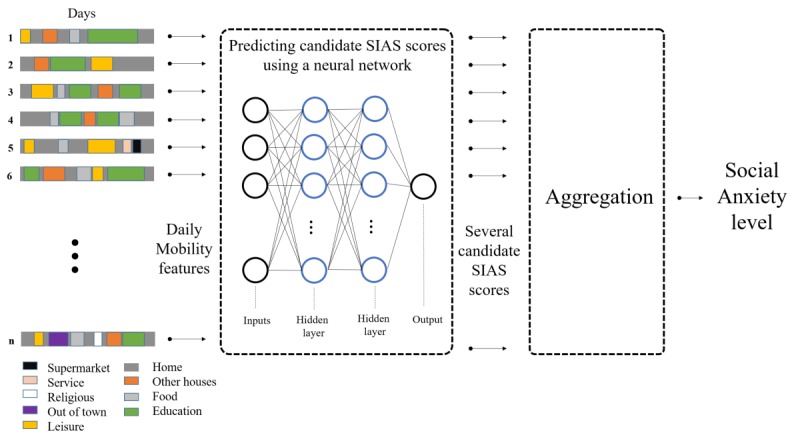
Methods: We recruited 228 undergraduate participants from a Southeast American university. Social anxiety symptoms were assessed using self-report instruments at a baseline laboratory session. An app installed on participants' personal mobile phones passively sensed data from the GPS sensor for 2 weeks. The proposed framework supports longitudinal, dynamic tracking of college students to evaluate the relationship between their social anxiety and movement patterns in the college campus environment. We first extracted the following mobility features: (1) cumulative staying time at each different location, (2) the distribution of visits over time, (3) the entropy of locations, and (4) the frequency of transitions between locations. Next, we studied the correlation between these features and participants' social anxiety scores to enhance the understanding of how students' social anxiety levels are associated with their mobility. Finally, we used a neural network-based prediction method to predict social anxiety symptoms from the extracted daily mobility features.
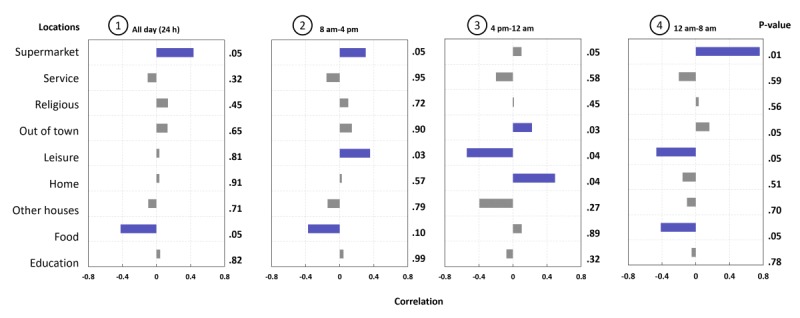
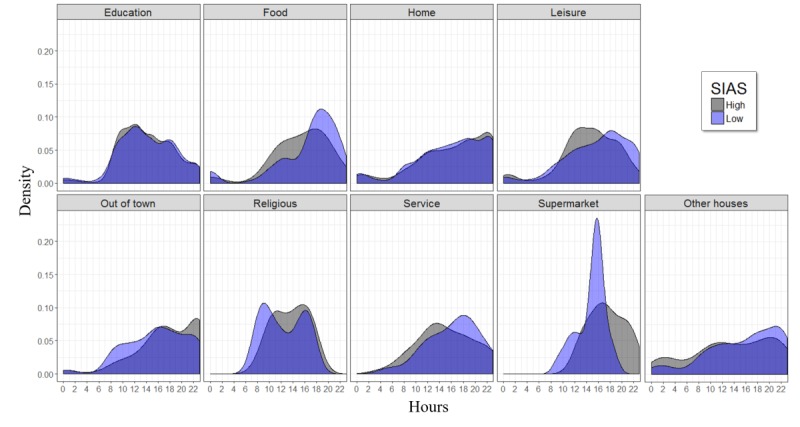
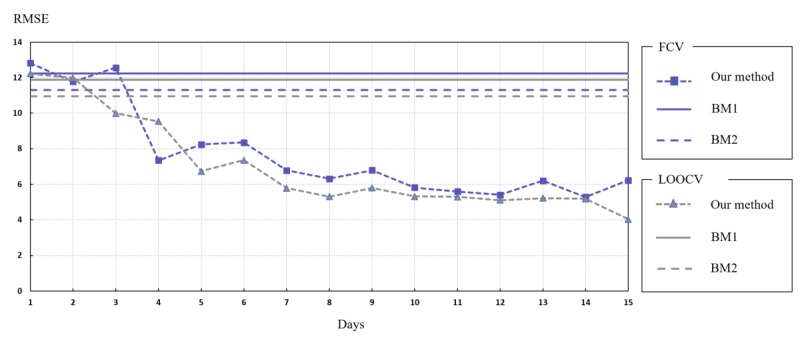
Results: Several mobility features correlated with social anxiety levels. Location entropy was negatively associated with social anxiety (during weekdays, r=-0.67; and during weekends, r=-0.51). More (vs less) socially anxious students were found to avoid public areas and engage in less leisure activities during evenings and weekends, choosing instead to spend more time at home after school (4 pm-12 am). Our prediction method based on extracted mobility features from GPS trajectories successfully classified participants as high or low socially anxious with an accuracy of 85% and predicted their social anxiety score (on a scale of 0-80) with a root-mean-square error of 7.06.
Conclusions: Results indicate that extracting and analyzing mobility features may help to reveal how social anxiety symptoms manifest in the daily lives of college students. Given the ubiquity of mobile phones in our society, understanding how to leverage passively sensed data has strong potential to address the growing needs for mental health monitoring and treatment.
Keywords: GPS; mHealth; mental health; mobility; social anxiety disorder.
©Mehdi Boukhechba, Philip Chow, Karl Fua, Bethany A Teachman, Laura E Barnes. Originally published in JMIR Mental Health (http://mental.jmir.org), 04.07.2018.
Conflict of interest statement
Conflicts of Interest: None declared.
Figures
References
-
- Stein M, Walker J. Triumph Over Shyness Conquering Social Anxiety Disorder Second Edition. New York: McGraw-Hill; 2009.
-
- American College Health Association . National College Health Assessment II: Reference Group Executive Summary. Hanover, MD: American College Health Association (ACHA); 2014.
LinkOut - more resources
Full Text Sources
Other Literature Sources
Medical
