

P2X4 receptor controls microglia activation and favors remyelination in autoimmune encephalitis
- PMID: 29973381
- PMCID: PMC6079537
- DOI: 10.15252/emmm.201708743
P2X4 receptor controls microglia activation and favors remyelination in autoimmune encephalitis
Abstract
Microglia survey the brain microenvironment for signals of injury or infection and are essential for the initiation and resolution of pathogen- or tissue damage-induced inflammation. Understanding the mechanism of microglia responses during pathology is hence vital to promote regenerative responses. Here, we analyzed the role of purinergic receptor P2X4 (P2X4R) in microglia/macrophages during autoimmune inflammation. Blockade of P2X4R signaling exacerbated clinical signs in the experimental autoimmune encephalomyelitis (EAE) model and also favored microglia activation to a pro-inflammatory phenotype and inhibited myelin phagocytosis. Moreover, P2X4R blockade in microglia halted oligodendrocyte differentiation in vitro and remyelination after lysolecithin-induced demyelination. Conversely, potentiation of P2X4R signaling by the allosteric modulator ivermectin (IVM) favored a switch in microglia to an anti-inflammatory phenotype, potentiated myelin phagocytosis, promoted the remyelination response, and ameliorated clinical signs of EAE Our results provide evidence that P2X4Rs modulate microglia/macrophage inflammatory responses and identify IVM as a potential candidate among currently used drugs to promote the repair of myelin damage.
Keywords: P2X4 receptor; microglia; myelin phagocytosis; remyelination.
© 2018 The Authors. Published under the terms of the CC BY 4.0 license.
Figures
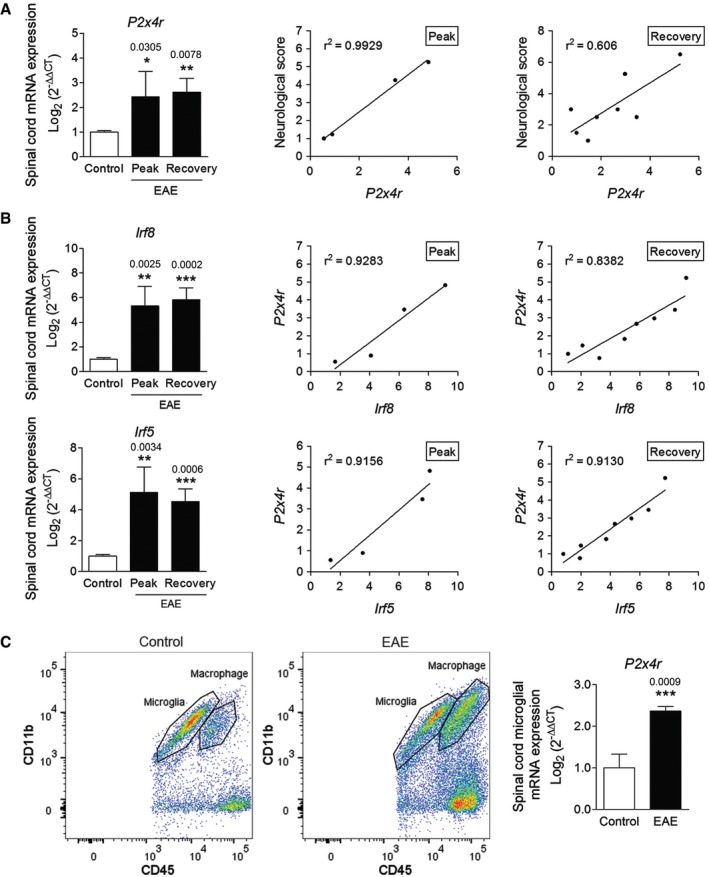
- A
Expression of P2x4r in the spinal cord of control (n = 7) and of EAE mice at the peak (n = 4) and recovery (n = 8) phases as analyzed using qPCR. Right, correlation of P2x4r expression with neurological score at EAE peak and recovery.
- B
Expression of Irf8 and Irf5 in the spinal cord of control (n = 7) and of EAE mice at the peak (n = 4) and recovery (n = 8) phases. Right, correlation of P2x4r expression with Irf5 and Irf8 expression at EAE peak and recovery.
- C
Plots depicting the strategy to distinguish resident microglia (CD11b+/CD45low) from invading macrophages (CD11b+/CD45high) in naïve and EAE mouse spinal cords. Right, P2x4r expression in microglia from naïve mice (n = 4) and from EAE mice at the recovery phase (n = 6).
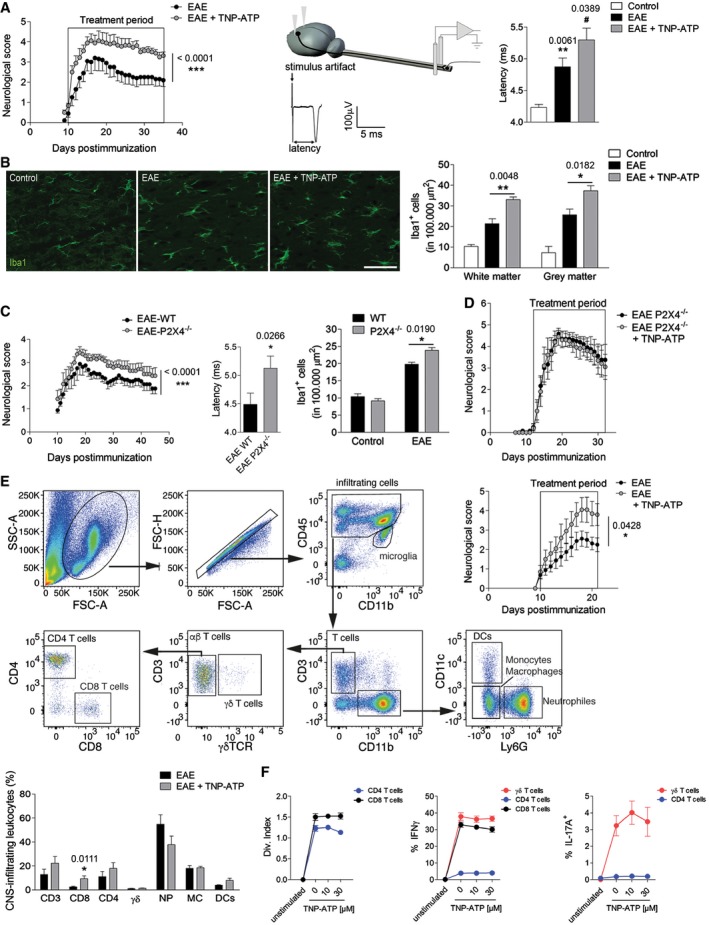
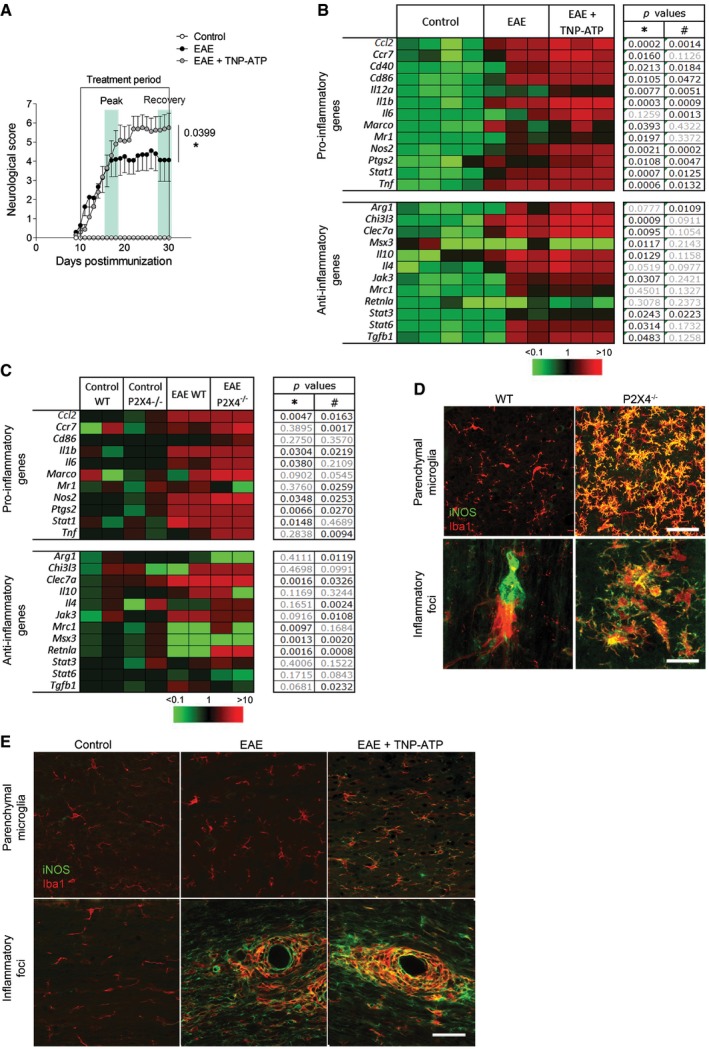
- A
Clinical score of vehicle (n = 10)‐ and TNP‐ATP (10 mg/kg)‐treated mice (n = 10) after EAE induction. Right, scheme, raw data, and histogram showing axon conduction latency in the corticospinal tract of control (n = 4), EAE (n = 10), and TNP‐ATP‐treated EAE mice (n = 10). Symbols indicate significance versus control (*) or versus EAE (#).
- B
Histology of spinal cord sections using Iba1 antibodies shows a significant increase in microglia/macrophage cell number in control mice (n = 3), in TNP‐ATP‐treated EAE mice (n = 4), and in non‐treated EAE mice (n = 5). Scale bar = 50 μm.
- C
Neurological score, axon conduction latency, and microglia/macrophage quantification in control WT (n = 3) and P2X4−/− mice (n = 3) and after EAE induction in WT (n = 10) and P2X4−/− mice (n = 10).
- D
Neurological score after EAE induction in P2X4−/− mice treated with vehicle (n = 4) or TNP‐ATP (n = 5).
- E
Left, flow cytometry gating strategy for analysis of infiltrates in the spinal cord of EAE mice at peak (18–21 dpi). Right, graph showing the neurological score of the mice used for the analysis (top) (n = 8). Histogram showing flow cytometric quantification of CD3+, CD8+, CD4+, and γδ T cells, neutrophils (NP), macrophages (MC), and dendritic cells (DC) in the spinal cord at EAE peak (bottom).
- F
Immune response analysis in vitro. T‐cell proliferation assay and flow cytometric quantification of cytokine expression in T cells after PMA/ionomycin stimulation in the absence or presence of TNP‐ATP (10–30 μm, 3 days; n = 3 independent experiments).
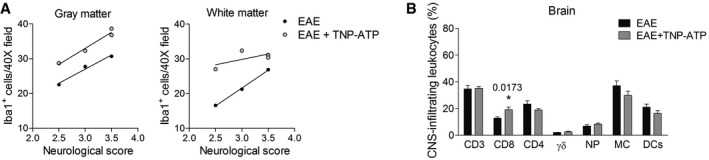
- A
Correlation between the neurological score and the number of Iba1+ cells in gray matter and white matter of the spinal cord.
- B
Flow cytometric quantification of immune cell infiltrates (gating as in Fig 2E) in the brain of TNP‐ATP‐treated or non‐treated mice analyzed at the peak of symptoms after EAE induction (n = 8). Data are presented as mean ± s.e.m. and were analyzed by Student's t‐test. *P < 0.05.
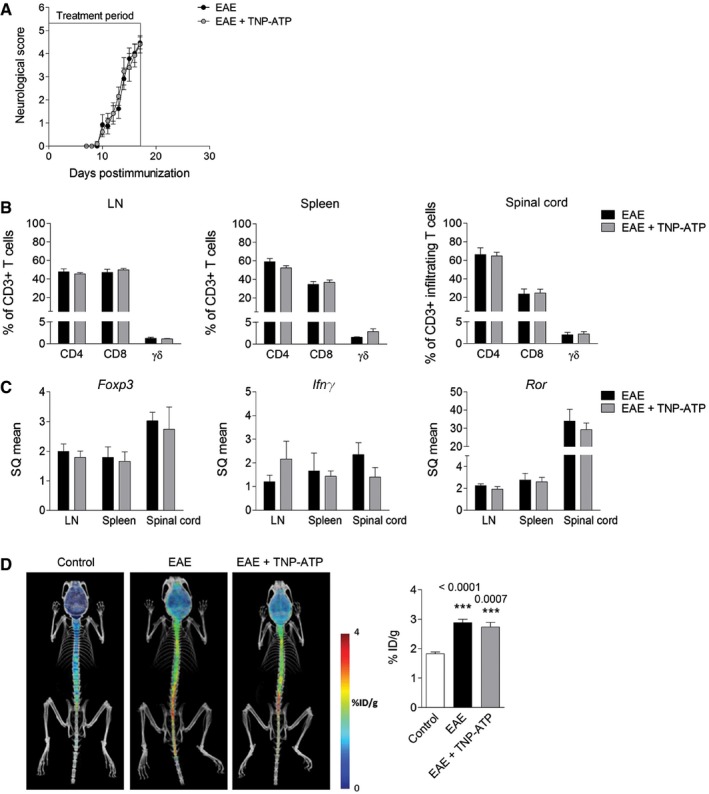
- A
Neurological score of vehicle (n = 23 from three independent experiments)‐ and TNP‐ATP‐treated (n = 21 from three independent experiments) mice after EAE. Mice were treated daily with TNP‐ATP from 0 dpi to EAE peak.
- B
Flow cytometric quantification of CD8+, CD4+, and γδ T cells in lymph nodes (LN), spleen, and spinal cord at EAE peak of vehicle (n = 7)‐ and TNP‐ATP‐treated mice (n = 5) (gating strategy as described in Fig 2E).
- C
Relative mRNA expression of Foxp3, Ifng, and Ror in LN, spleen, and spinal cord at EAE peak of vehicle (n = 6)‐ and TNP‐ATP‐treated mice (n = 7).
- D
Representative images of 18F‐MMPi PET imaging in control mice (n = 6), EAE mice (n = 10), and EAE mice treated with TNP‐ATP (n = 9) as described in (A). 18F‐MMPi signal in the lumbar spinal cord was expressed as %ID/g.
- A
Neurological score of EAE (n = 4) or TNP‐ATP‐treated EAE mice (n = 4) used for gene expression analysis. Mice were treated from the onset to the end of the experiment. Data are presented as mean ± s.e.m. and were analyzed by Mann–Whitney U‐test. *P < 0.05.
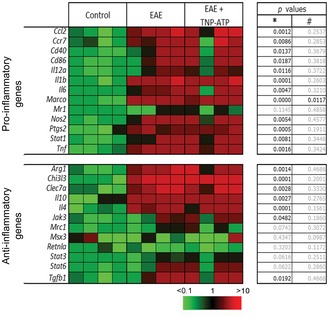
- B
Heatmap showing significant changes in pro‐inflammatory and anti‐inflammatory mRNA expression in the spinal cord at the EAE recovery phase in the presence or absence of TNP‐ATP (n = 3). The expression levels of genes are presented using fold‐change values transformed to Log2 format compared to control. The Log2 (fold‐change values) and the color scale are shown at the bottom of the heatmap. Tables indicate statistical significance between control and EAE (*) and between EAE and EAE + TNP‐ATP (#). Data were analyzed by Student's t‐test.
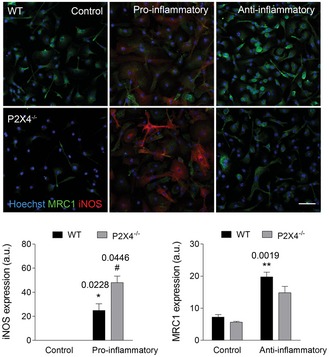
- C
Heatmap showing changes in pro‐inflammatory and anti‐inflammatory markers in FACS‐isolated microglia from control, EAE WT, and EAE P2X4−/− mice at the recovery phase (n = 2 in duplicate). Tables indicate statistical significance between control WT and EAE WT (*) and between EAE WT and EAE P2X4−/− (#). Data were analyzed by Student's t‐test.
- D, E
iNOS (green) expression was increased in Iba1+ cells (red) in the spinal cord of P2X4−/− mice versus WT mice (D) and in TNP‐ATP‐treated mice versus non‐treated mice after EAE induction (E) (n = 3). Analysis was performed at the recovery phase of the EAE. Scale bar = 50 (D, top; E) and 25 (D, bottom) μm.
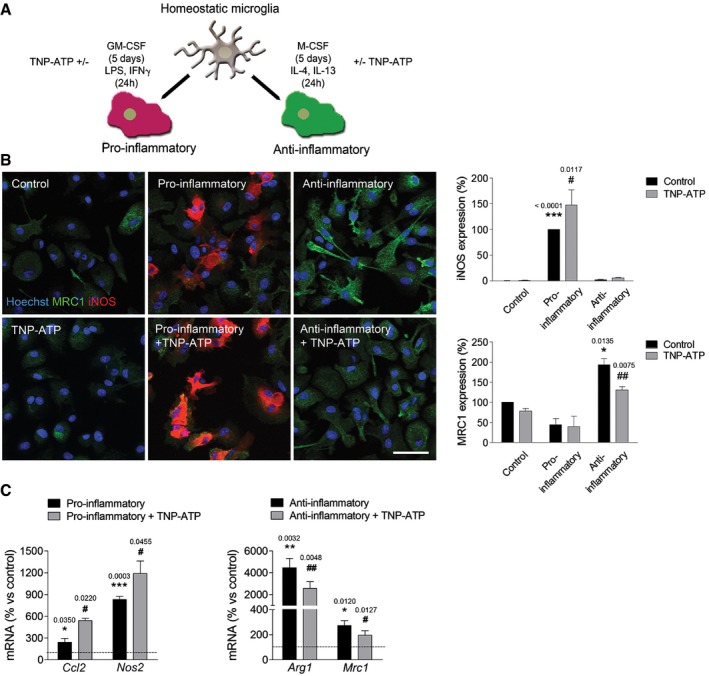
- A
Schematic representation of microglia polarization protocol.
- B
Staining for iNOS (red) (n = 7) and mannose receptor (MRC1, green) (n = 4) in different activated microglia in the absence or presence of TNP‐ATP (10 μM). Scale bar = 50 μm.
- C
qPCR quantification of pro‐inflammatory genes (Ccl2 and Nos2) and anti‐inflammatory genes (Arg1 and Mrc1) in different activated microglia in the absence or presence of TNP‐ATP (10 μM) (n = 3).
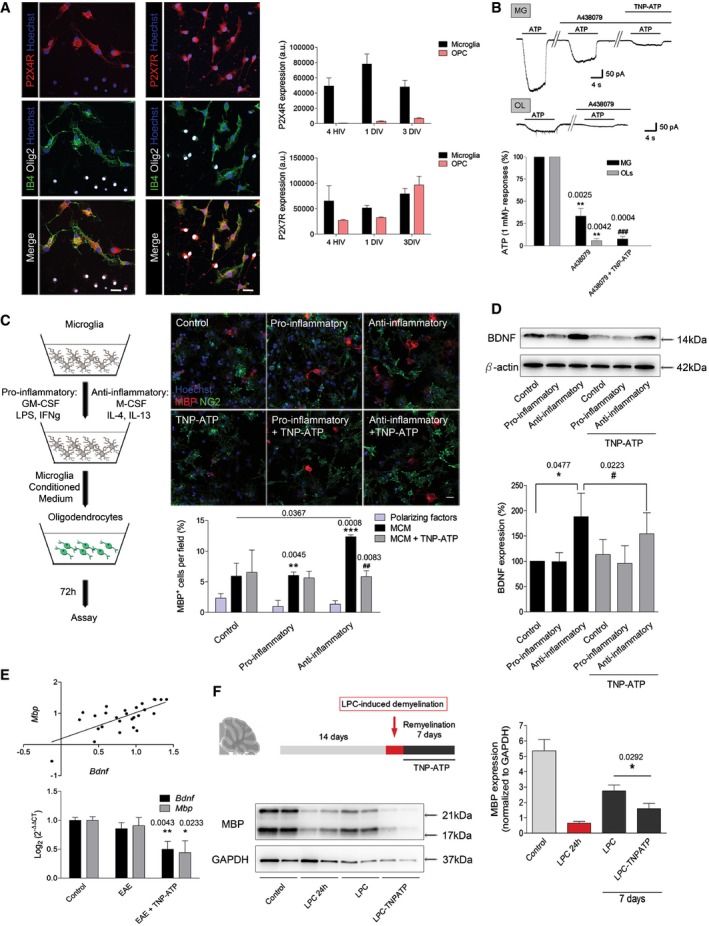
- A
Microglia–OPC coculture stained for P2X4R (left column) or P2X7R (right column) (red), Olig2 (white), isolectin B4 (IB4; green), and Hoechst (blue). Scale bar = 20 μm. Notice the presence of P2X4R on isolectin B4+ microglial cells and the absence in Olig2+ cells. Histograms (right) show quantification of P2X4R and P2X7R at different stages of oligodendrocyte development, 4 h in vitro (HIV), 1 day in vitro (DIV), and 3 DIV in cocultures (n = 3).
- B
Microglia (MG) express functional P2X7R (blocked with A438079) and P2X4R (blocked with TNP‐ATP), whereas oligodendrocytes (OL) only express functional P2X7 receptors. Representative traces showing ATP (100 μM)‐evoked inward, non‐desensitizing currents in microglia and oligodendrocytes in acute slices in the absence or presence of P2X7R antagonist A438079 (1 μM) or of P2X4R antagonist TNP‐ATP (10 μM) (n = 9 cells from three different mice). Symbols indicate significance versus ATP currents (*) or versus ATP+A438079 currents (#).
- C
OPCs were treated with control, anti‐inflammatory, and pro‐inflammatory microglia‐conditioned media (MCM) or with fresh media ± polarizing factors and stained for NG2 (green) and MBP (red). Scale bar = 20 μm (n = 3). Symbols indicate significance versus polarizing factors (*) or versus MCM (#).
- D
Representative immunoblots of BDNF levels in microglia in vitro and densitometry quantification (n = 10).
- E
Bdnf and Mbp mRNA expression (bottom) and correlation of the expression (top) at the EAE recovery phase in control mice, EAE mice, and TNP‐ATP‐treated EAE mice (n = 10 mice/group).
- F
Sagittal sections of cerebellum (300 μm) were treated with lysolecithin (LPC) to induce demyelination and allowed to remyelinate ± TNP‐ATP (10 μM) during 7 days. Representative immunoblots of MBP and GAPDH and densitometry quantification (n = 5).
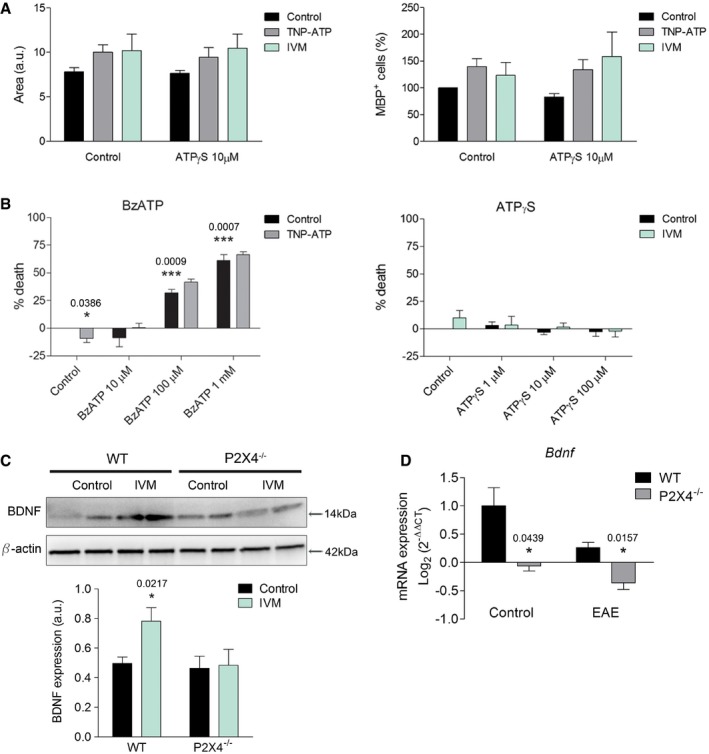
- A
Effect of ATPγS (10 μM) ± ivermectin or TNP‐ATP (10 μM) on oligodendrocyte differentiation quantified on the basis of the number of MBP+ cells/total cell number and the area of the cells. Area was calculated with ImageJ software (n = 3).
- B
Oligodendrocyte cell viability after 24‐h incubation with BzATP, a broad‐spectrum agonist of purinergic receptors, in the absence or presence of TNP‐ATP (10 μM) (left) or ATPγS (right) in the absence or presence of IVM (3 μM) (n = 3).
- C
Western blot analysis of BDNF in control and IVM‐treated wild‐type and P2X4−/− microglia (n = 3).
- D
Bdnf mRNA levels in the spinal cord of WT and P2X4−/− mice in control and after EAE induction (n = 4 mice/group).
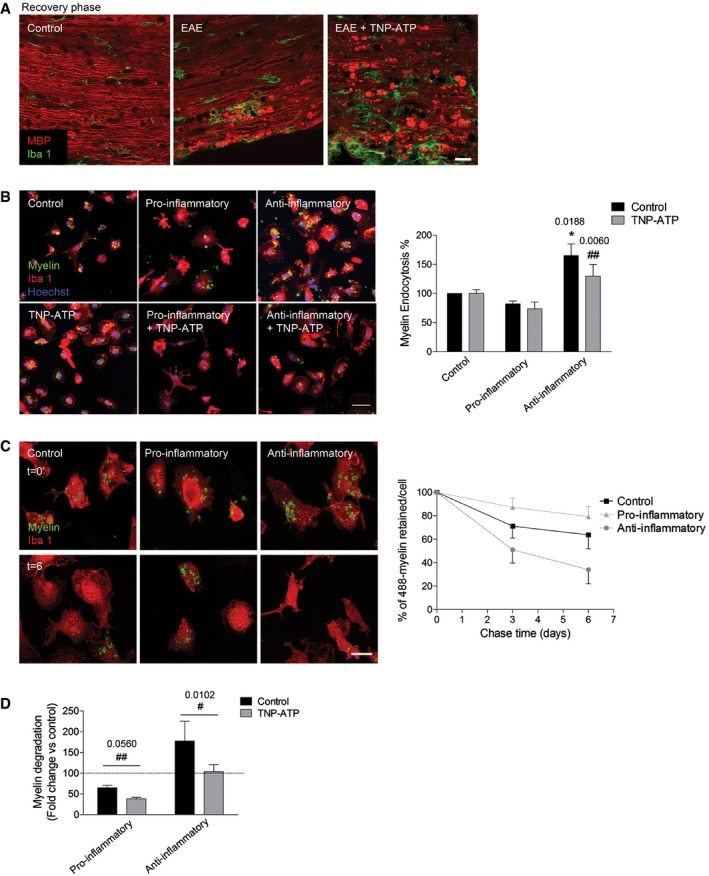
- A
Spinal cord sections of control mice, EAE mice, and EAE mice treated with TNP‐ATP at the recovery phase stained for MBP (red) and Iba1 (green). Scale bar = 50 μm. Representative images from n = 6 mice/group from two independent experiments.
- B
Alexa 488‐labeled myelin endocytosis (1 h, 37°C) in Iba1+ microglia polarized in the absence or presence of TNP‐ATP (10 μM). Scale bar = 50 μm.
- C
Degradation of Alexa 488‐labeled myelin by control, pro‐inflammatory, and anti‐inflammatory microglia at chase time 0, 3, and 6 days. Left, representative images at 0 and 6 days. Scale bar = 50 μm. Right, histogram shows the percentage of 488‐myelin retained in the cells after the 3‐ and 6‐day chase periods with respect to the 488‐myelin at 0‐h chase time.
- D
Histogram represents the effect of TNP‐ATP (10 μM), applied during differentiation and chase time (6 days), on myelin degradation. Myelin degradation at 6 days was expressed as fold change versus control microglia at the same chase time.
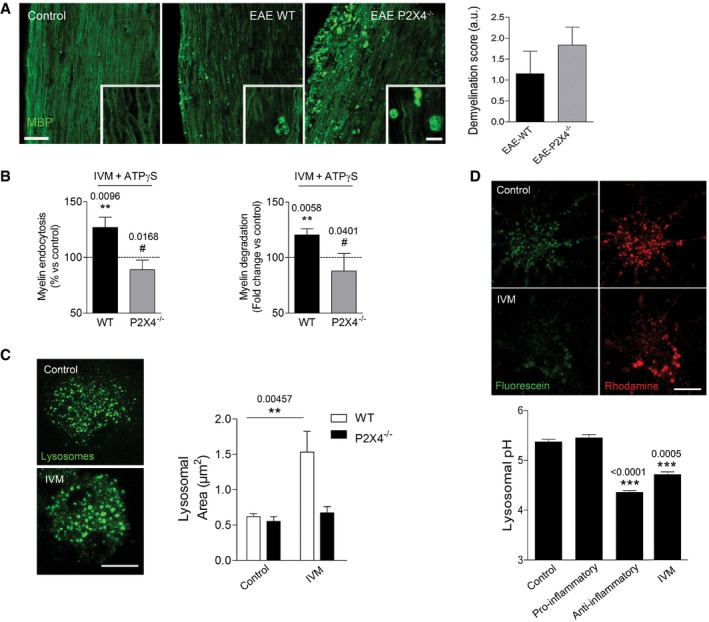
- A
Spinal cord sections of wild‐type (n = 6) and P2X4−/− mice (n = 7) 35 days after EAE induction stained for MBP. Scale bar = 50 and 10 (inset) μm. Inset images come from different fields at higher magnification. Right, demyelination score analyzed in MBP‐stained sections.
- B
Effect of IVM (3 μM) on myelin endocytosis (1 h) and degradation (3 days) in microglia from wild‐type and P2X4−/− mice (n = 3).
- C
Treatment with IVM (3 μM; 16 h) increased late endosome–lysosome (LEL) size in microglia from wild‐type and P2X4−/− mice. Representative images and histogram for LEL size distributions under the conditions indicated (n = 20 cells from two independent experiments). Scale bar = 10 μm.
- D
IVM‐treated microglia (3 μM) and anti‐inflammatory microglia showed an acidic shift in lysosomal pH, as analyzed on the basis of fluorescein/rhodamine–dextran ratio (n = 20 cells from two independent experiments). Scale bar = 10 μm.
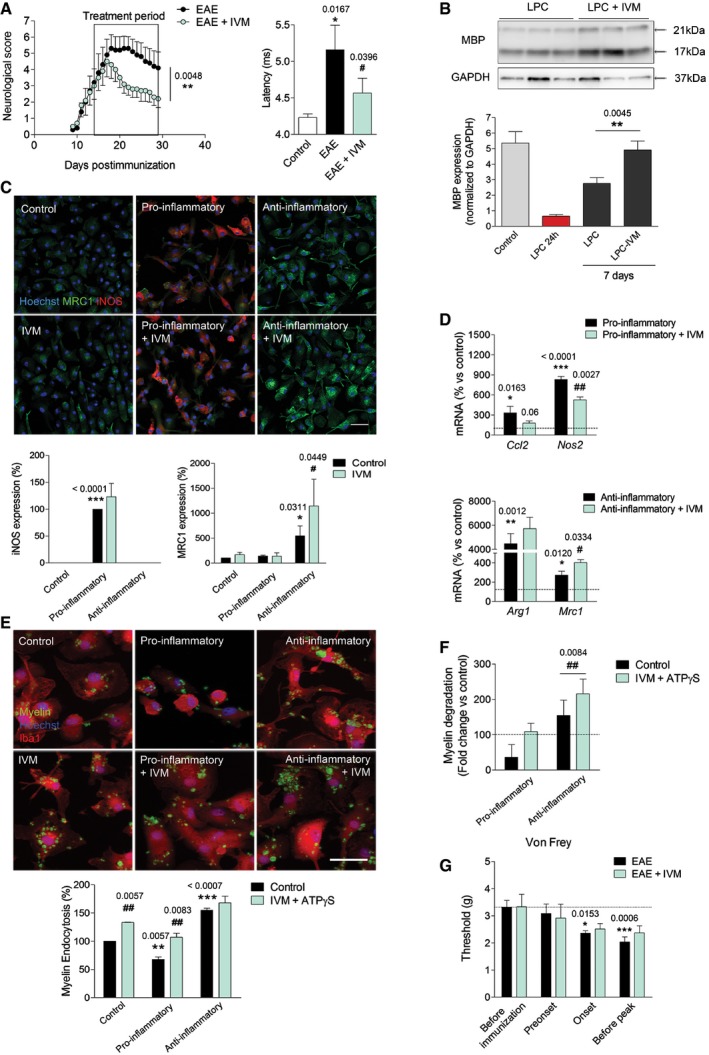
- A
Left, neurological score of EAE (n = 5) and ivermectin (IVM)‐treated EAE mice (1 mg/kg) (n = 5 mice/group; one representative experiment of two independent experiments). Right, axon conduction latency in the corticospinal tract of control and vehicle‐ and IVM‐treated EAE mice. Symbols indicate significance versus control (*) or versus EAE (#).
- B
Effect of IVM (3 μM)‐ on lysolecithin (LPC)‐induced demyelination in cerebellum organotypic slices, as analyzed by MBP densitometry (n = 5).
- C
Staining for iNOS (red) and MRC1 (green) in control and differently activated microglia in the absence or presence of IVM (3 μM) (n = 3). Scale bar = 50 μm. Symbols indicate significance versus control (*) or versus anti‐inflammatory microglia (#).
- D
qPCR quantification of pro‐inflammatory genes (Ccl2 and Nos2) and anti‐inflammatory genes (Arg1 and Mrc1) in different activated microglia in the absence or presence of IVM (3 μM) (n = 3). Symbols indicate significance versus control (*) or versus pro‐/anti‐inflammatory microglia (#).
- E
Control, pro‐inflammatory, and anti‐inflammatory microglia endocytosis (1 h) of Alexa 488‐labeled myelin in the absence or presence of IVM (3 μM) plus ATPγS (10 μM) (n = 4). Scale bar = 40 μm. Symbols indicate significance versus control (*) or between IVM + ATPγS‐treated and non‐treated cells (#).
- F
Myelin degradation at 6 days, expressed as fold change versus control microglia at the same chase time, in the absence and in the presence of IVM (3 μM) + ATPγS (10 μM) (n = 4).
- G
Withdrawal threshold (grams) of mechanical stimulation by von Frey filaments applied to the mouse hind paw in non‐treated (n = 6) and IVM‐treated mice (n = 7) at specific stages of EAE progression.
Comment in
-
Microglia P2X4 receptors as pharmacological targets for demyelinating diseases.EMBO Mol Med. 2018 Aug;10(8):e9369. doi: 10.15252/emmm.201809369. EMBO Mol Med. 2018. PMID: 30037978 Free PMC article.
References
-
- Ajami B, Bennett JL, Krieger C, McNagny KM, Rossi FM (2011) Infiltrating monocytes trigger EAE progression, but do not contribute to the resident microglia pool. Nat Neurosci 14: 1142–1149 - PubMed
-
- Bartholomäus I, Kawakami N, Odoardi F, Schläger C, Miljkovic D, Ellwart JW, Klinkert WE, Flügel‐Koch C, Issekutz TB, Wekerle H et al (2009) Effector T cell interactions with meningeal vascular structures in nascent autoimmune CNS lesions. Nature 462: 94–98 - PubMed
-
- Bitsch A, Schuchardt J, Bunkowski S, Kuhlmann T, Brück W (2000) Acute axonal injury in multiple sclerosis. Correlation with demyelination and inflammation. Brain 123: 1174–1183 - PubMed
-
- Bleriot C, Dupuis T, Jouvion G, Eberl G, Disson O, Lecuit M (2015) Liver‐resident macrophage necrosis orchestrates type 1 microbicidal inflammation and type‐2 mediated tissue repair during bacterial infection. Immunity 42: 145–158 - PubMed
Publication types
MeSH terms
Substances
LinkOut - more resources
Full Text Sources
Other Literature Sources
Molecular Biology Databases
