. 2018 Jul 4;10(448):eaat0381.
doi: 10.1126/scitranslmed.aat0381.

The human naive B cell repertoire contains distinct subclasses for a germline-targeting HIV-1 vaccine immunogen

Affiliations

The human naive B cell repertoire contains distinct subclasses for a germline-targeting HIV-1 vaccine immunogen

Colin Havenar-Daughton et al. Sci Transl Med. .

Abstract

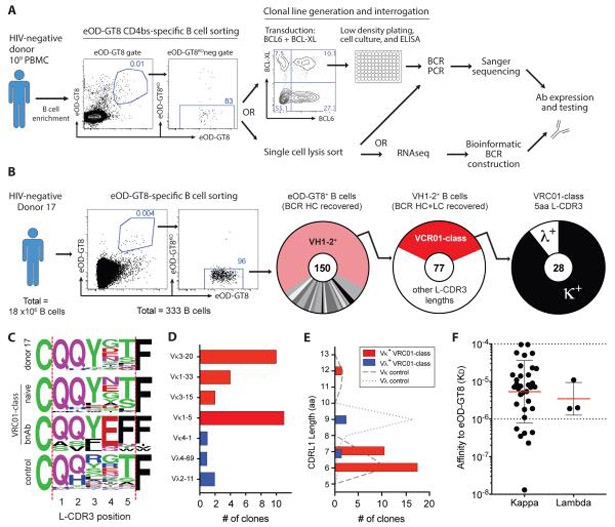
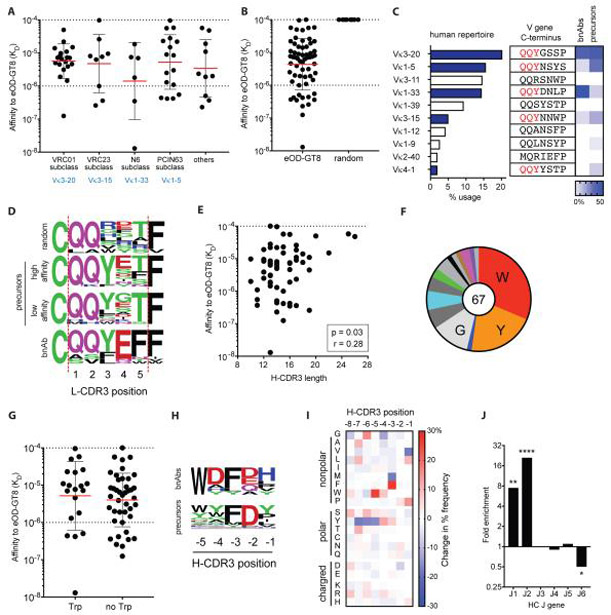
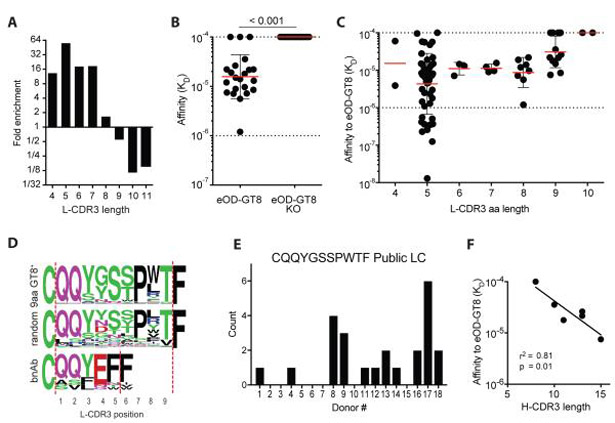
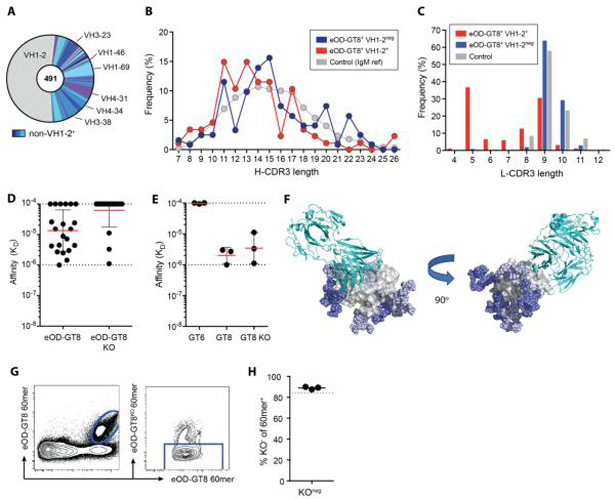
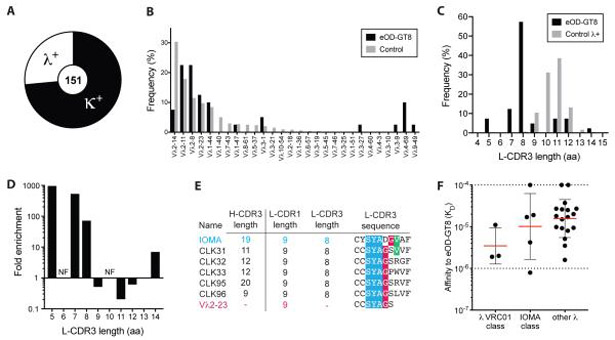
Traditional vaccine development to prevent some of the worst current pandemic diseases has been unsuccessful so far. Germline-targeting immunogens have potential to prime protective antibodies (Abs) via more targeted immune responses. Success of germline-targeting vaccines in humans will depend on the composition of the human naive B cell repertoire, including the frequencies and affinities of epitope-specific B cells. However, the human naive B cell repertoire remains largely undefined. Assessment of antigen-specific human naive B cells among hundreds of millions of B cells from multiple donors may be used as pre-phase 1 ex vivo human testing to potentially forecast B cell and Ab responses to new vaccine designs. VRC01 is an HIV broadly neutralizing Ab (bnAb) against the envelope CD4-binding site (CD4bs). We characterized naive human B cells recognizing eOD-GT8, a germline-targeting HIV-1 vaccine candidate immunogen designed to prime VRC01-class Abs. Several distinct subclasses of VRC01-class naive B cells were identified, sharing sequence characteristics with inferred precursors of known bnAbs VRC01, VRC23, PCIN63, and N6. Multiple naive B cell clones exactly matched mature VRC01-class bnAb L-CDR3 sequences. Non-VRC01-class B cells were also characterized, revealing recurrent public light chain sequences. Unexpectedly, we also identified naive B cells related to the IOMA-class CD4bs bnAb. These different subclasses within the human repertoire had strong initial affinities (KD) to the immunogen, up to 13 nM, and represent encouraging indications that multiple independent pathways may exist for vaccine-elicited VRC01-class bnAb development in most individuals. The frequencies of these distinct eOD-GT8 B cell specificities give insights into antigen-specific compositional features of the human naive B cell repertoire and provide actionable information for vaccine design and advancement.


Figures

Figure 1.
Figure 1.. eOD-GT8-binding VRC01-class naive B cells from an individual donor.
A) Schematic of isolation and characterization of eOD-GT8-specific naive human B cells using biotinylated eOD-GT8 monomers tetramerized via fluorescent streptavidin. PBMCs, peripheral blood mononuclear cells; RNA-seq, RNA sequencing. B) Isolation of eOD-GT8+ VRC01-class naive B cells from an individual HIV-seronegative donor (donor 17). Frequency of VH1-2+ cells (pink) among eOD-GT8+ B cells, VRC01-class naive cells (VH1-2+ + 5 aa L-CDR3, red) among total VH1-2+ B cells, and VRC01-class naive B cells expressing kappa (κ) or lambda (λ) LCs among total VRC01-class naive B cells. Total B cell clones are indicated at the center of each donut plot. C) L-CDR3 sequence of κ+ VRC01-class naive B cells from donor 17 compared to L-CDR3 sequences from previously isolated VRC01-class naive B cells (16), VRC01-class bnAbs, and unsorted control B cells expressing a L-CD3 of 5 aa. D) LC V gene usage of VRC01-class naive B cells from donor 17 (n = 28). Red indicates use of V genes observed in VRC01-class bnAbs. E) L-CDR1 sequence length (International Immunogenetics Information System, IMGT) of VRC01-class naive B cells from donor 17, n =28. Dashed (Vκ) and dotted (Vλ) lines show L-CDR1 lengths of control B cells. F) SPR determined monovalent affinities (KD) to eOD-GT8 of VRC01-class Abs derived from VRC01-class naive B cells (n=37). Bars represent geometric mean (red) with geometric SD (black). Horizontal dotted line at 10−4 is the limit of detection; the line at 10−6 indicates a reference affinity of 1 μM.
Figure 2.
Figure 2.. Subclasses and sequence requirements of eOD-GT8+ VRC01-class naive B cells.
Characterization and subclass assignment of VRC01-class B cells [n=18 donors, including VRC01-class naive B cells from (16)]. A) Monovalent affinities of VRC01-class Abs derived from eOD-GT8+ VRC01-class naive B cells separated by bnAb subclass (LC V gene usage), n = 62. Bars represent geometric mean (red) with geometric SD (black). B) Monovalent affinities of VRC01-class Abs derived from eOD-GT8+ VRC01-class naive B cells (n = 62) and Abs derived from random VH1-2+ + 5-aa L-CDR3 B cells (n = 8). C) κ V gene usage among the human B cell repertoire (blue bars indicate the presence of a QQYxx motif) and the terminus of the V gene sequence (beginning of the L-CDR3) with the QQYxx motif highlighted in red. The heat map (right) indicates the relative frequency of κ V gene usage among VRC01-class bnAbs or eOD-GT8+VRC01-class naive B cells (n = 66). D) L-CDR3 sequence of 8 randomly selected VH1-2+ + 5 aa L-CDR3 B cells (eOD-GT8neg), the 12 highest-affinity eOD-GT8+ VRC01-class naive B cells, the 12 lowest-affinity eOD-GT8+ VRC01-class naive B cells, and VRC01-class bnAbs. E) Pearson correlation analysis of VRC01-class Ab eOD-GT8 affinities and H-CDR3 length (IMGT). n = 62. F) Amino acid usage at the −5 position from the C-terminal end of the H-CDR3 (also known as Trp100B in VRC01) of VRC01-class naive B cells. Single amino acid letter abbreviations. n = 67. G) Monovalent affinities of VRC01-class Abs derived from eOD-GT8+ VRC01-class naive B cells that do and do not contain a Trp at the −5 position of H-CDR3 (n = 62). Bars represent geometric mean (red) with geometric SD (black). H) Amino acid sequence at the C-terminal end of the H-CDR3 of bnAbs used to guide design of eOD-GT8 compared to VRC01-class naive B cells. I) Heat map of the difference in amino acid usage at the C-terminal end of the H-CDR3 of VRC01-class naive B cells (n = 67) with control (eOD-GT8+ VRC01-class B cells, n = 119). The % aa usage among VRC01-class naive B cells minus % aa usage among non-VRC01-class naive B cells. J) Fold enrichment of HC J gene usage among eOD-GT8+ VRC01-class naive B cells versus control B cells. Fisher’s exact test (*P < 0.05; **P < 0.005; and ****P < 0.0001).
Figure 3.
Figure 3.. Non-VRC01-class eOD-GT8-specific VH1-2+ naive human B cells
A) Fold enrichment of eOD-GT8+ VH1-2+ κ+ naive B cells with varying L-CDR3 lengths (IMGT) in comparison to control B cells. B) Monovalent affinities to eOD-GT8 and eOD-GT8-KO of Abs derived from non-VRC01-class eOD-GT8+ VH1-2+ naive B cells (n = 19). Bars represent geometric mean (red) with geometric SD (black). C) Monovalent affinities to eOD-GT8 of Abs derived from eOD-GT8+ VH1-2+ naive B cells. Abs were categorized by L-CDR3 length. VRC01-class naive B cells from (16) were included. Bars represent geometric mean (red) with geometric SD (black). D) L-CDR3 sequences of eOD-GT8+ VH1-2+ naive B cells with a 9 aa L-CDR3, control B cells with a 9 aa L-CDR3, and VRC01-class bnAbs. E) Number of B cells with a Vκ3-20+ CQQYGSSPWTF L-CDR3 public LC among eOD-GT8+ B cells in multiple donors (n =18). F) Correlation analysis of H-CDR3 length and eOD-GT8 affinity for VH1-2+ Abs paired with the Vκ3-20+CQQYGSSPWTF L-CDR3 public LC sequence (n = 6).
Figure 4.
Figure 4.. Non-VH1-2 eOD-GT8-specific naive human B cells
A) VH usage of eOD-GT8+ naive human B cells. B) Frequencies of H-CDR3 lengths (IMGT) of VH1-2+ eOD-GT8+ naive B cells, non-VH1-2 eOD-GT8+ naive B cells, and control B cells. C) κ L-CDR3 lengths (IMGT) of VH1-2+ eOD-GT8+ naive B cells, non-VH1-2 eOD-GT8+ naive B cells, and control B cells. Panels A to C include VRC01-class naive B cells from (16). D) Monovalent affinities to eOD-GT8 and eOD-GT8-KO of Abs derived from non-VH1-2 eOD-GT8+ naive B cells. Bars represent geometric mean (red) with geometric SD (black). E) Monovalent affinities to eOD-GT6, eOD-GT8, and eOD-GT8KO of Abs derived from eOD-GT8KO-binding non-VH1-2 eOD-GT8+ naive B cells. Bars represent geometric mean (red) with geometric standard deviation (black). F) Site-specific occupancy and composition of glycosylation motifs in free eOD-GT8 monomers compared to eOD-GT8 protomers within the 60-mer nanoparticle. Model of the crystal structure [Protein Data Bank (PDB) ID: 5IES] of VRC01c-HuGL2 Fab (cyan) in complex with eOD-GT8 (gray), in which Man9 glycans (blue and light blue) have been built at every position with >50% occupancy in eOD-GT8 monomer using RosettaCarbohydrate (46). Glycans with >50% occupancy on eOD-GT8 60-mer are light blue. G) Flow cytometric analysis of naive human B cells with eOD-GT8 60mer and eOD-GT8-KO 60-mer fluorescently labeled B cell probes. Double positive eOD-GT8 60-mer binding cells (eOD-GT8-60-mer-Alexa Fluor 488+ eOD-GT8-60-mer-Alexa Fluor 647+) in the left plot were gated and shown in the right plot. H) Frequency of eOD-GT8-KO-60-merneg cells among eOD-GT8-60-mer+ cells. Black bar indicates mean (n=3). Red dotted line indicates average frequency of eOD-GT8-KOneg cells among eOD-GT8+ cells when probed with eOD-GT8 streptavidin tetramers instead of eOD-GT8 60-mers.
Figure 5.
Figure 5.. IOMA-class naive B cells revealed by eOD-GT8
A) Frequency of Vλ+ and Vκ+ BCRs among eOD-GT8+ naive B cells (n = 151; N = 3). B) Vλ usage among eOD-GT8+ naive B cells versus control B cells (n = 40; N = 3). Control B cell sequences from (24). C) L-CDR3 lengths (IMGT) of Vλ+ eOD-GT8+ naive B cells versus λ+ control B cells (n = 40, N = 3). D) Fold enrichment of eOD-GT8+ VH1-2+ λ+ naive B cells with varying L-CDR3 lengths in comparison to control B cells. NF, not found. E) CDR lengths and sequences of IOMA bnAb, IOMA-class naive B cells, and the λ2-23 V gene. F) Monovalent affinities of Abs derived from Vλ+ eOD-GT8+ naive B cells to eOD-GT8. (n = 26). Bars represent geometric mean (red) with geometric SD (black).
Figure 6.
Figure 6.. Structure of a naive B cell antibody similar to IOMA.
A) Crystal structure of the IOMA-related Ab CLK31 from a naive B cell in complex with eOD-GT8 at 2.6 Å resolution (HC: blue, LC: yellow, eOD-GT8: red). B) Similarity between the variable regions of CLK31 and IOMA Abs and their CDRs. Right: Detailed comparison of the structural positions of the L-CDR3 residues in CLK31 and IOMA. C) Comparison of the binding modes of CLK31 and IOMA combining with eOD-GT8 and BG505 SOSIP (PDB ID: 5T3Z), respectively, at the CD4bs. D) Rotational angle of approach of CLK31, IOMA bnAb, and VRC01-HuGL2 (naive VRC01-class). Side and top views are shown.
Figure 7.
Figure 7.. The human naive B cell repertoire specific for eOD-GT8.
The frequencies and affinities of classes and subclasses of eOD-GT8-specific human naive B cells. Box and whisker plots of affinities show mean, quartiles, minimum and maximum range. The inverse of naive B cell frequency is plotted (that is, 1 in x number of B cells). Non-VH1-2 B cells are the most common eOD-GT8-specific B cells; Kymab VRC01-class B cells are the rarest. Gray shading represents the continuum between “unlikely to respond” (darker) and “likely to respond” (lighter) based on tested affinities (KD’s of 0.5, 14, and 40 μM) (12). VRC01-class naive B cells subsets categorized by affinity (green) are shown as high (KD < 3 μM; the geometric mean of in vivo tested B cells with KD’s of 0.5 and 14 μM) (12), intermediate (KD’s between 3 and 40 μM), and weak affinity (KD >40 μM). Subclasses of VRC01-class naive B cells are highlighted in blue. VRC01-class naive B cells with L-CDR3 sequences matching mature bnAbs are indicated with “QQYEF” and “QQYET.” λ+ VRC01-class naive B cells are indicated. VRC01-class naive B cells containing a Trp at the −5 position of the H-CDR3 (also known as Trp100B in VRC01) are indicated as “CDR3 Trp+.” Human VRC-PG19 (λ2-14+) subclass naive human B cells are yet to be identified and denoted with a dashed box containing a “?.” “Kymab” indicates frequencies and affinities of VRC01-class B cells isolated from Kymab mice after one immunization (13). Box width is constant and acknowledges some uncertainty in the frequency calculations. Some boxes were slightly offset for clarity. LOD, limit of detection.

Similar articles

Cited by

References

    1. Plotkin SA, Correlates of protection induced by vaccination, Clin. Vaccine Immunol 17, 1055–1065 (2010). - PMC - PubMed
    1. Koff WC, Burton DR, Johnson PR, Walker BD, King CR, Nabel GJ, Ahmed R, Bhan MK, Plotkin SA, Accelerating next-generation vaccine development for global disease prevention, Science 340, 1232910–1232910 (2013). - PMC - PubMed
    1. Burton DR, What Are the Most Powerful Immunogen Design Vaccine Strategies? Reverse Vaccinology 2.0 Shows Great Promise, Cold Spring Harb Perspect Biol 9, a030262 (2017). - PMC - PubMed
    1. Kwong PD, What Are the Most Powerful Immunogen Design Vaccine Strategies? A Structural Biologist's Perspective, Cold Spring Harb Perspect Biol 9, a029470 (2017). - PMC - PubMed
    1. Rappuoli R, Bottomley MJ, D'Oro U, De Gregorio O, Finco E, Reverse vaccinology 2.0: Human immunology instructs vaccine antigen design, Journal of Experimental Medicine 213, 469–481 (2016). - PMC - PubMed

Publication types