. 2018 Jul 4;10(448):eaan4470.
doi: 10.1126/scitranslmed.aan4470.

MEK inhibition induces MYOG and remodels super-enhancers in RAS-driven rhabdomyosarcoma

Affiliations

MEK inhibition induces MYOG and remodels super-enhancers in RAS-driven rhabdomyosarcoma

Marielle E Yohe et al. Sci Transl Med. .

Abstract

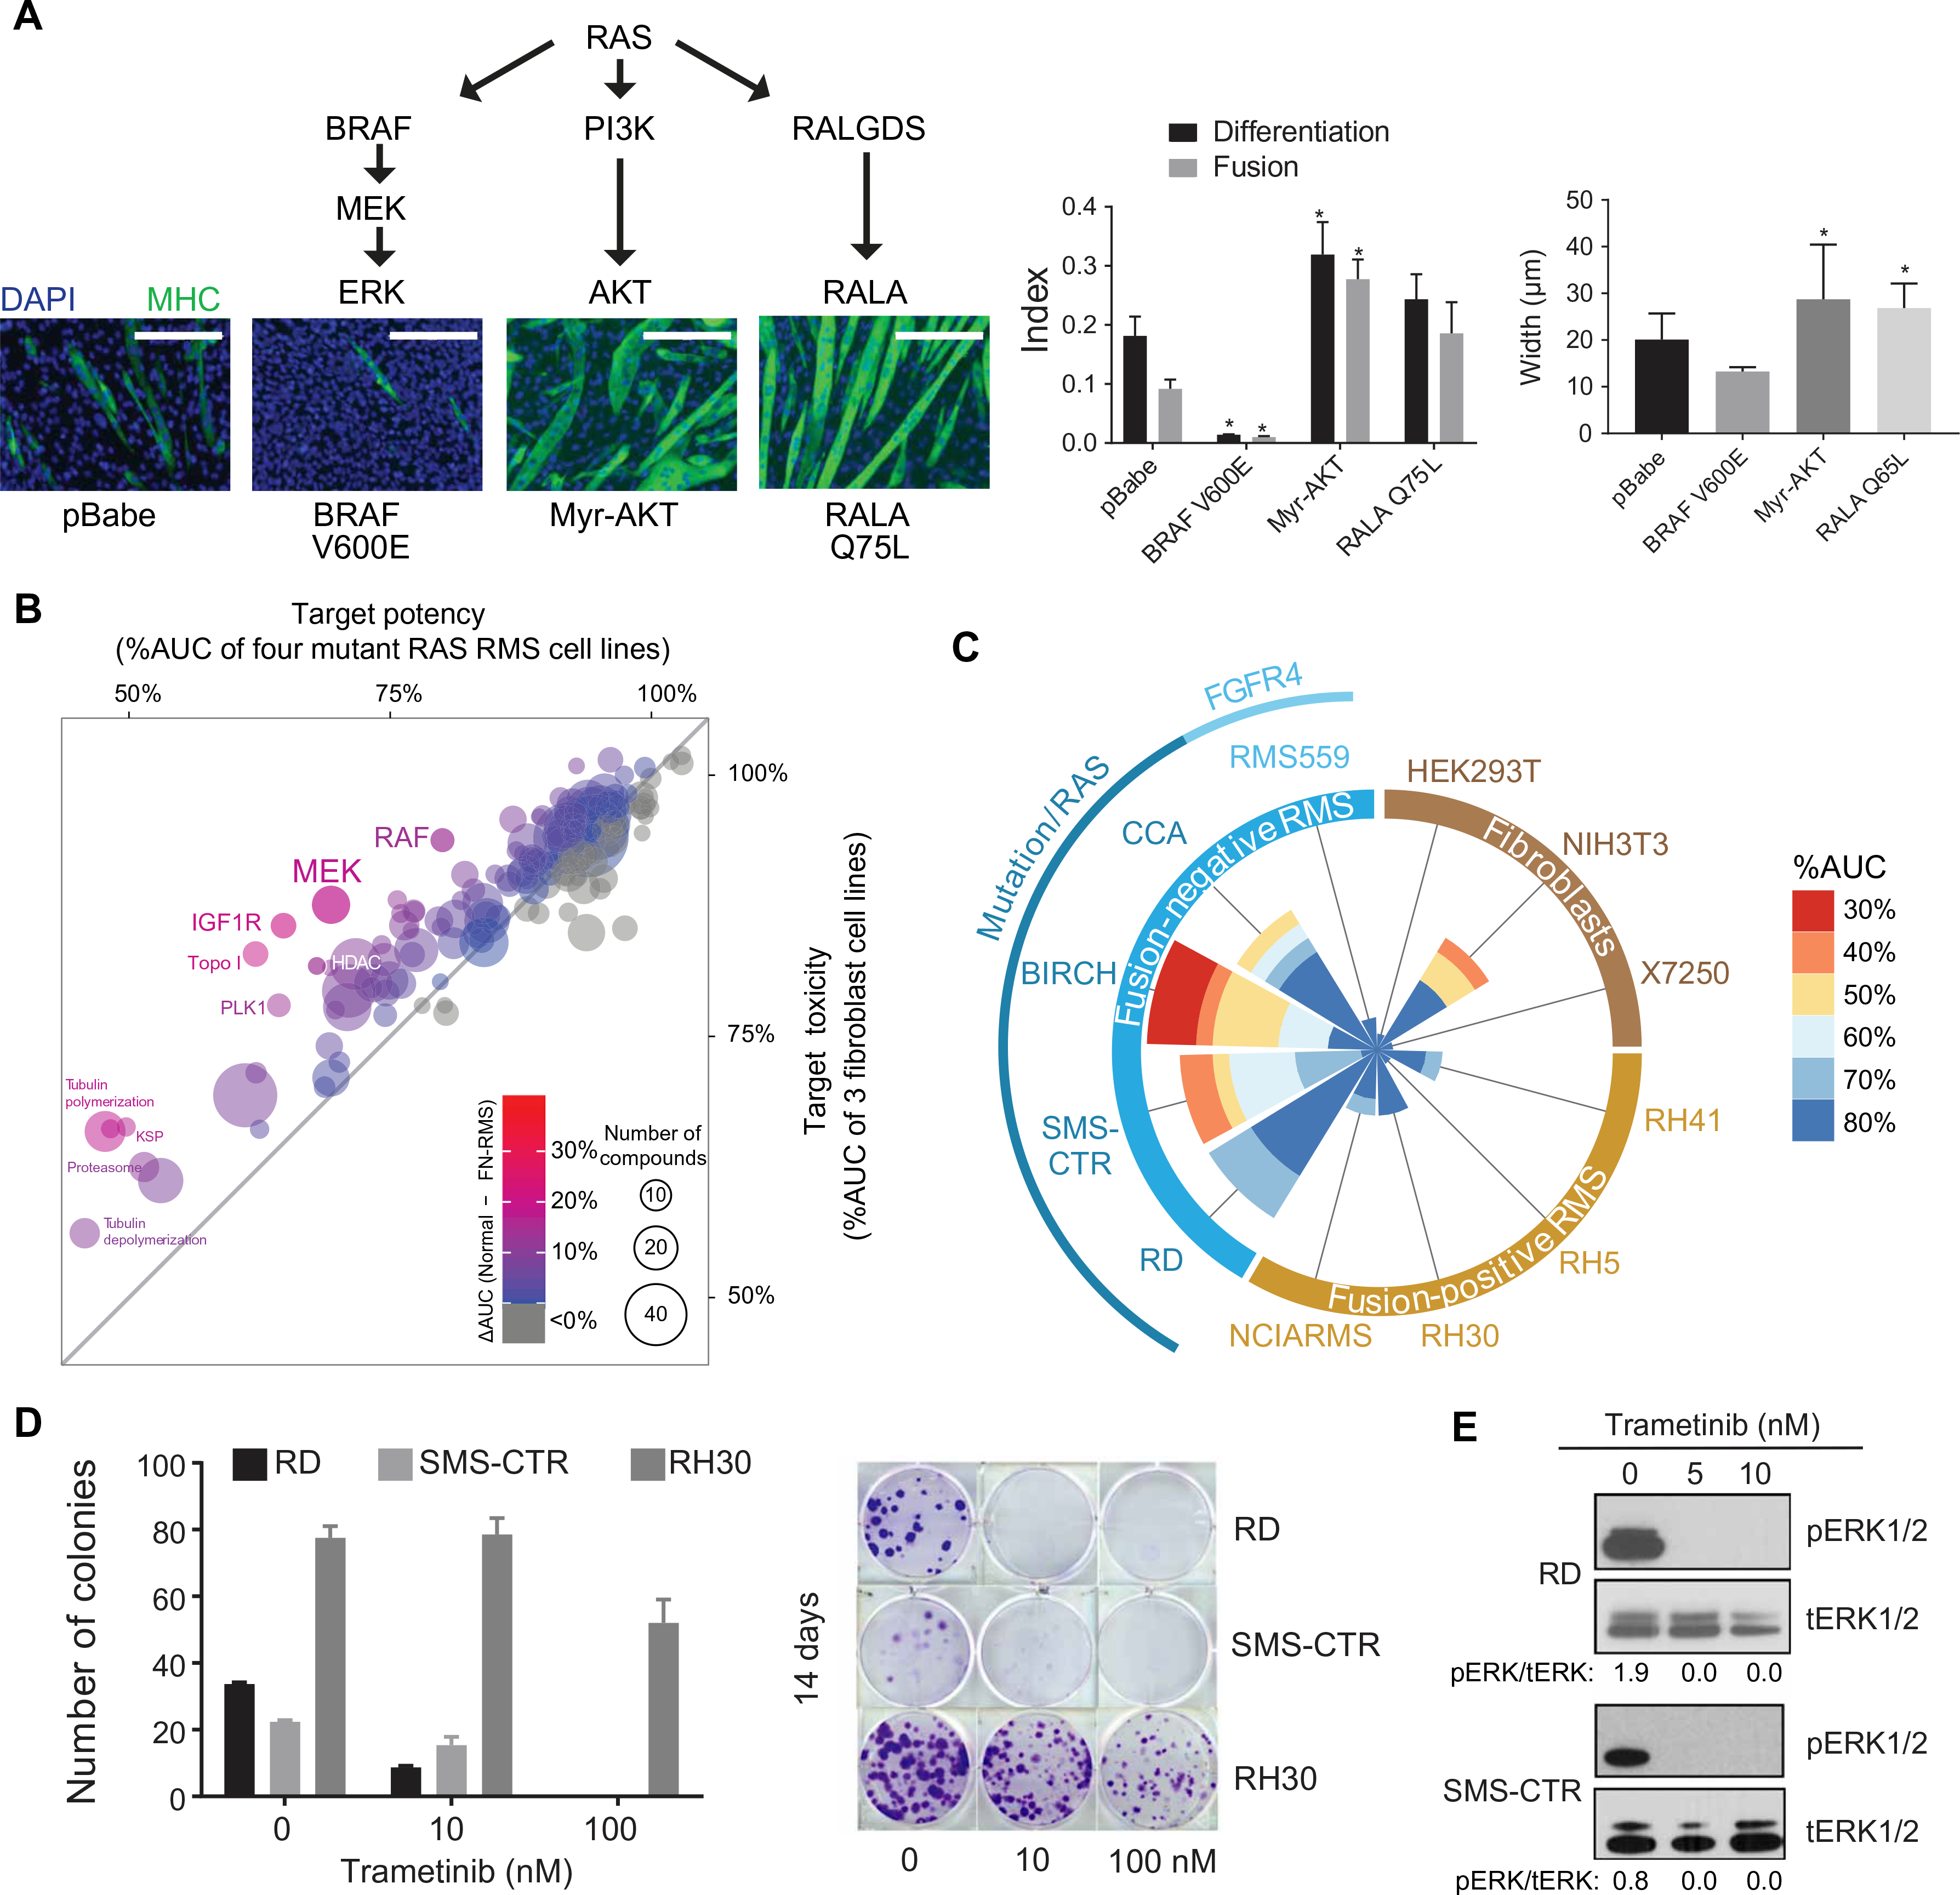
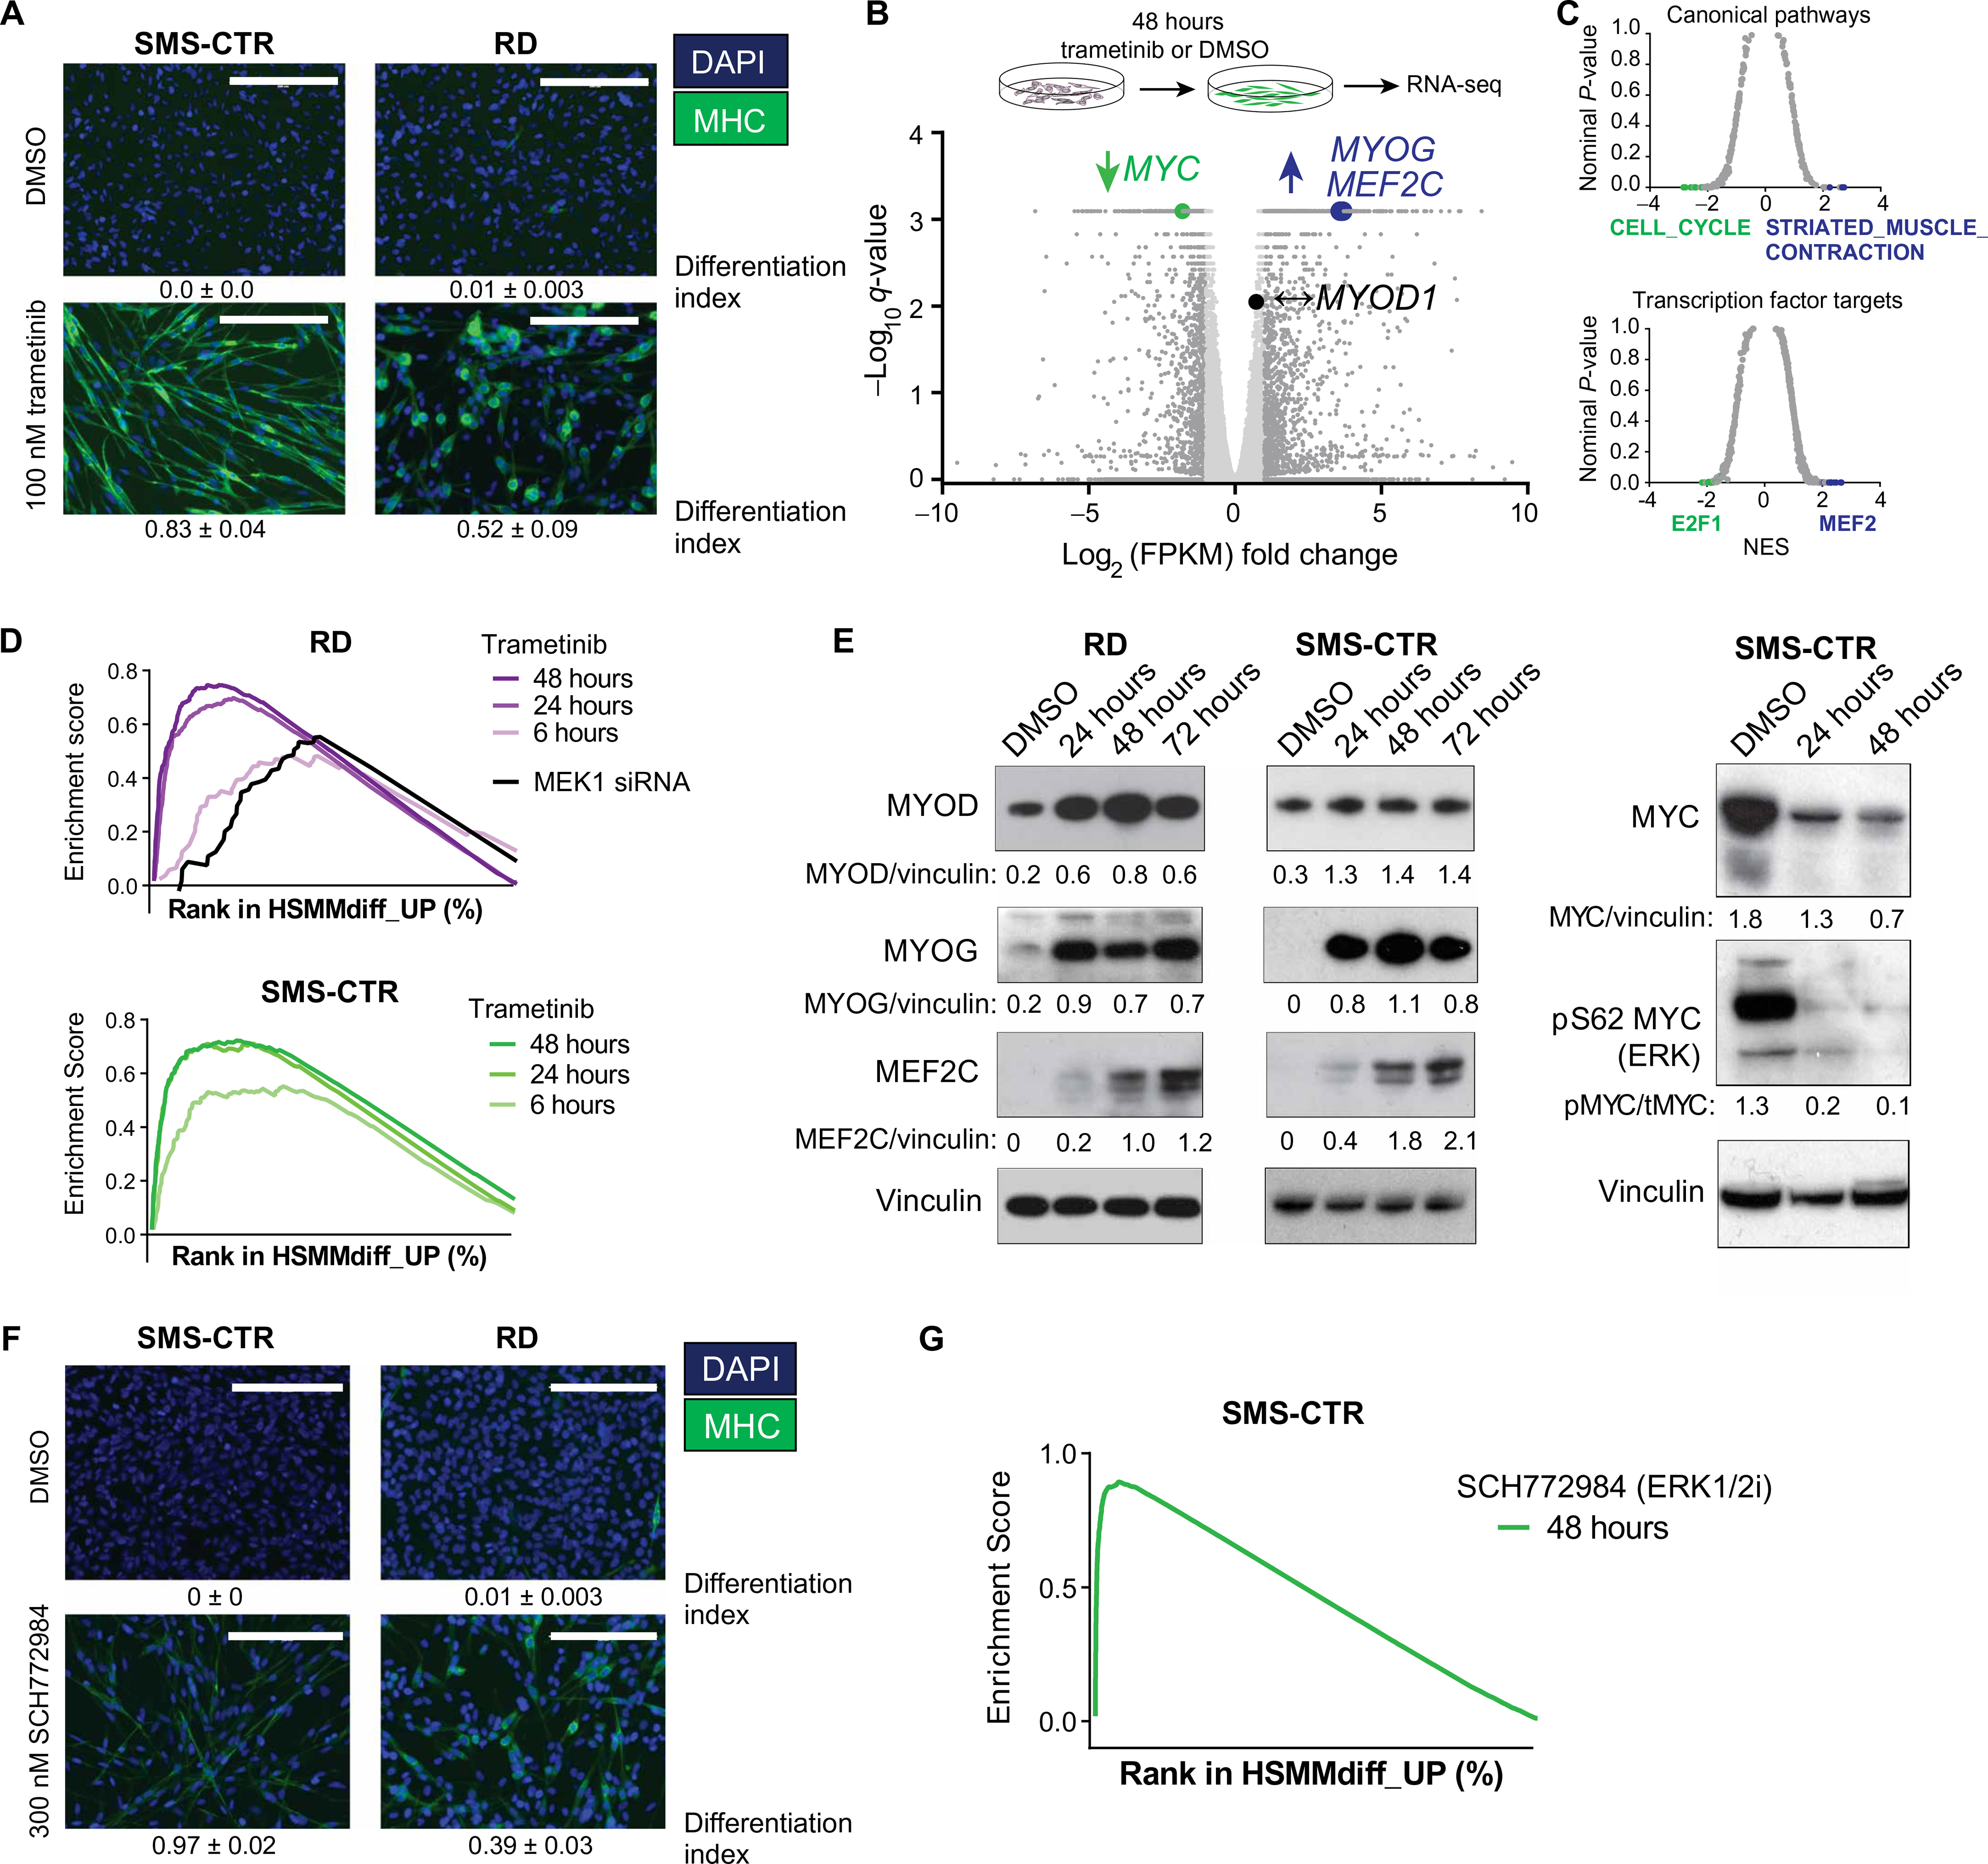
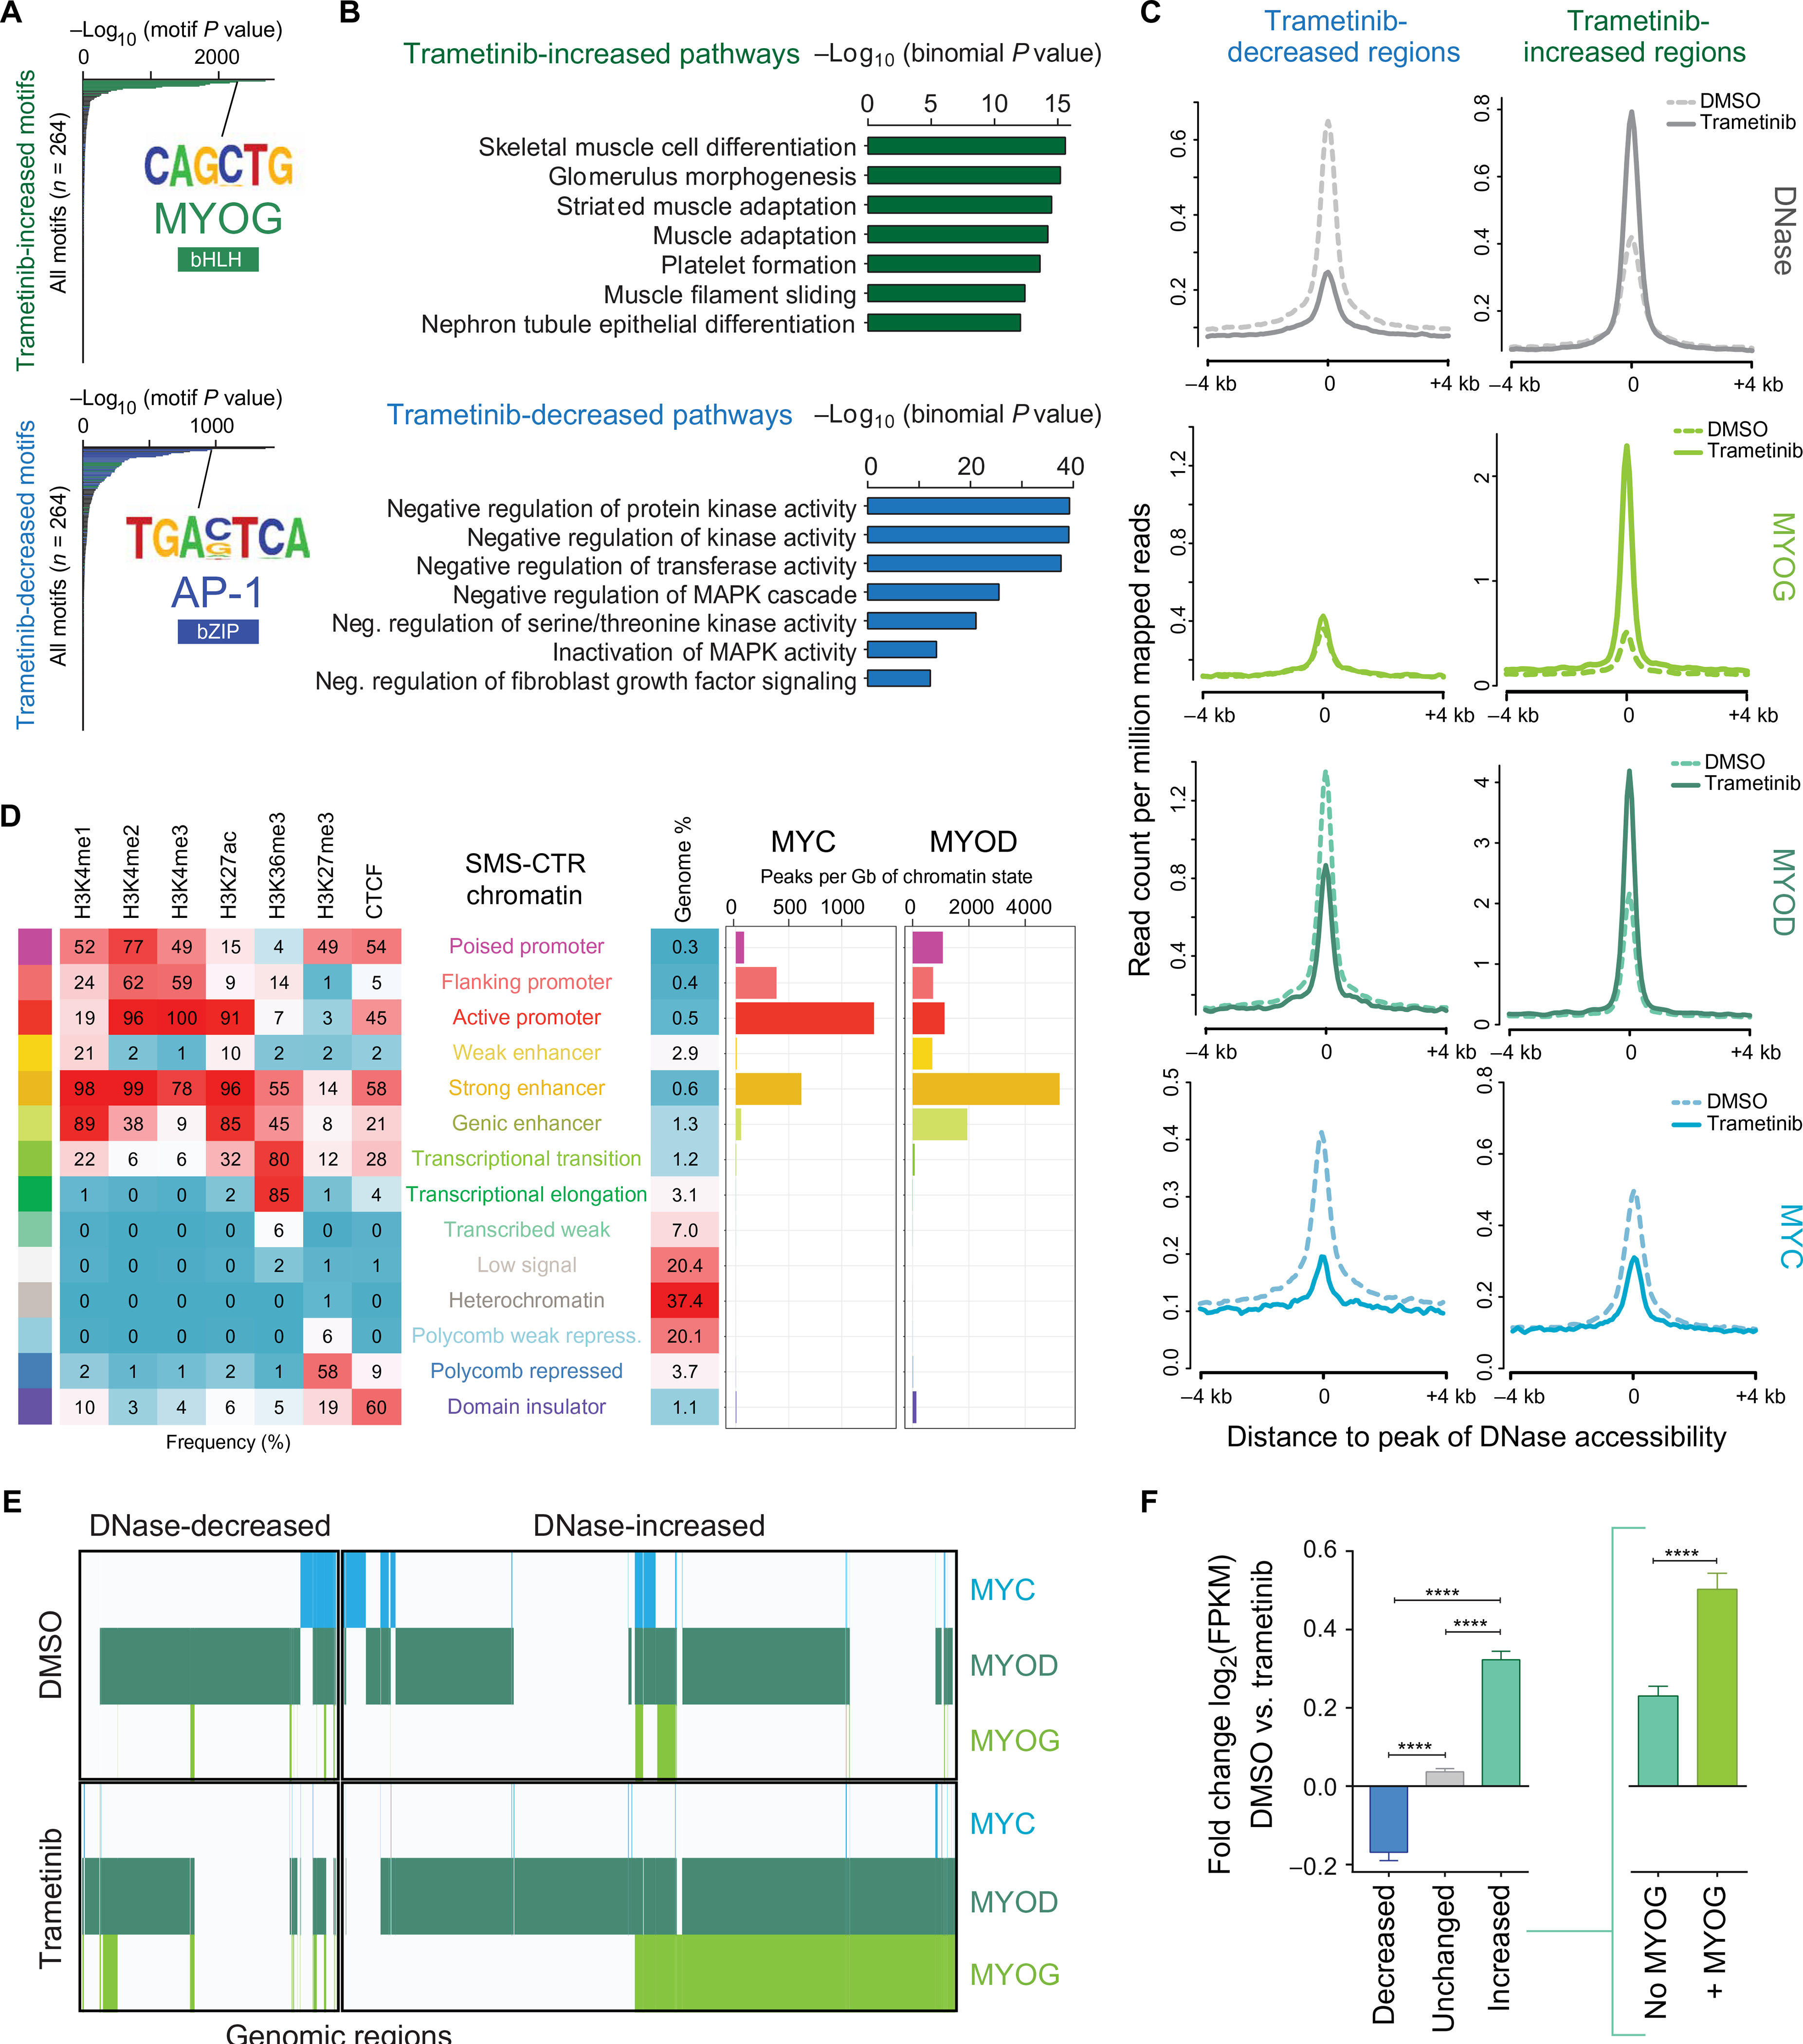
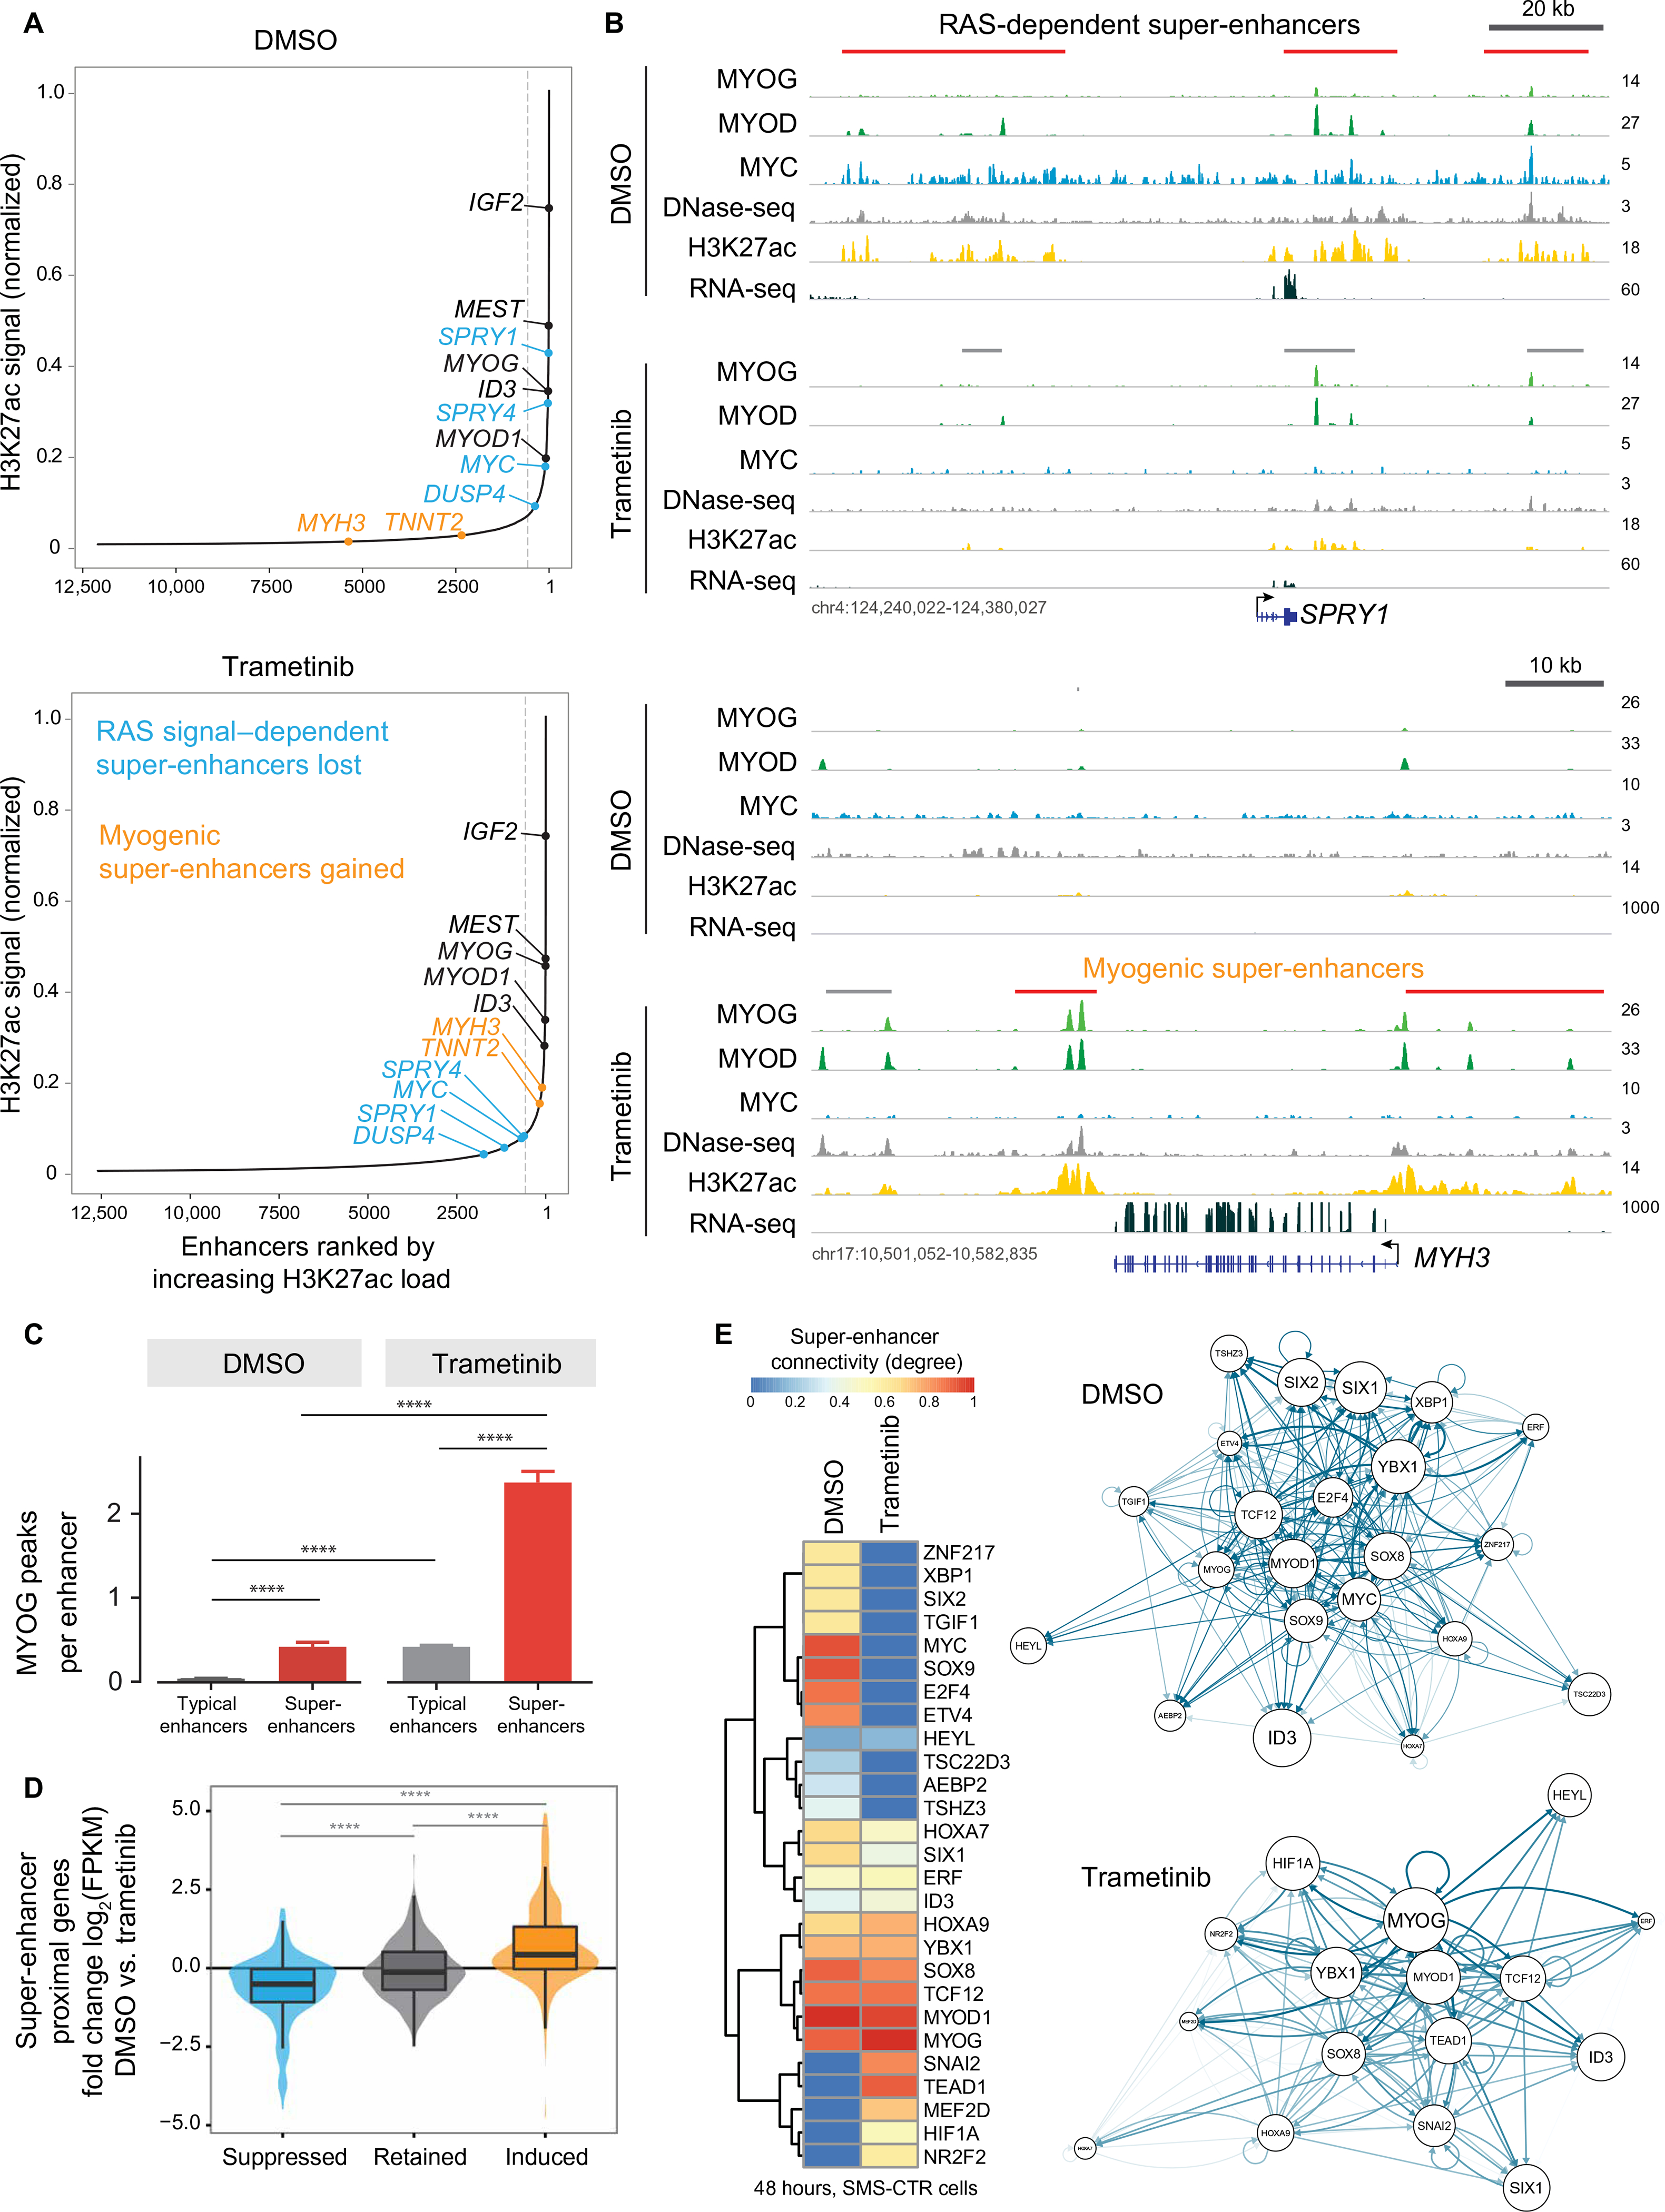
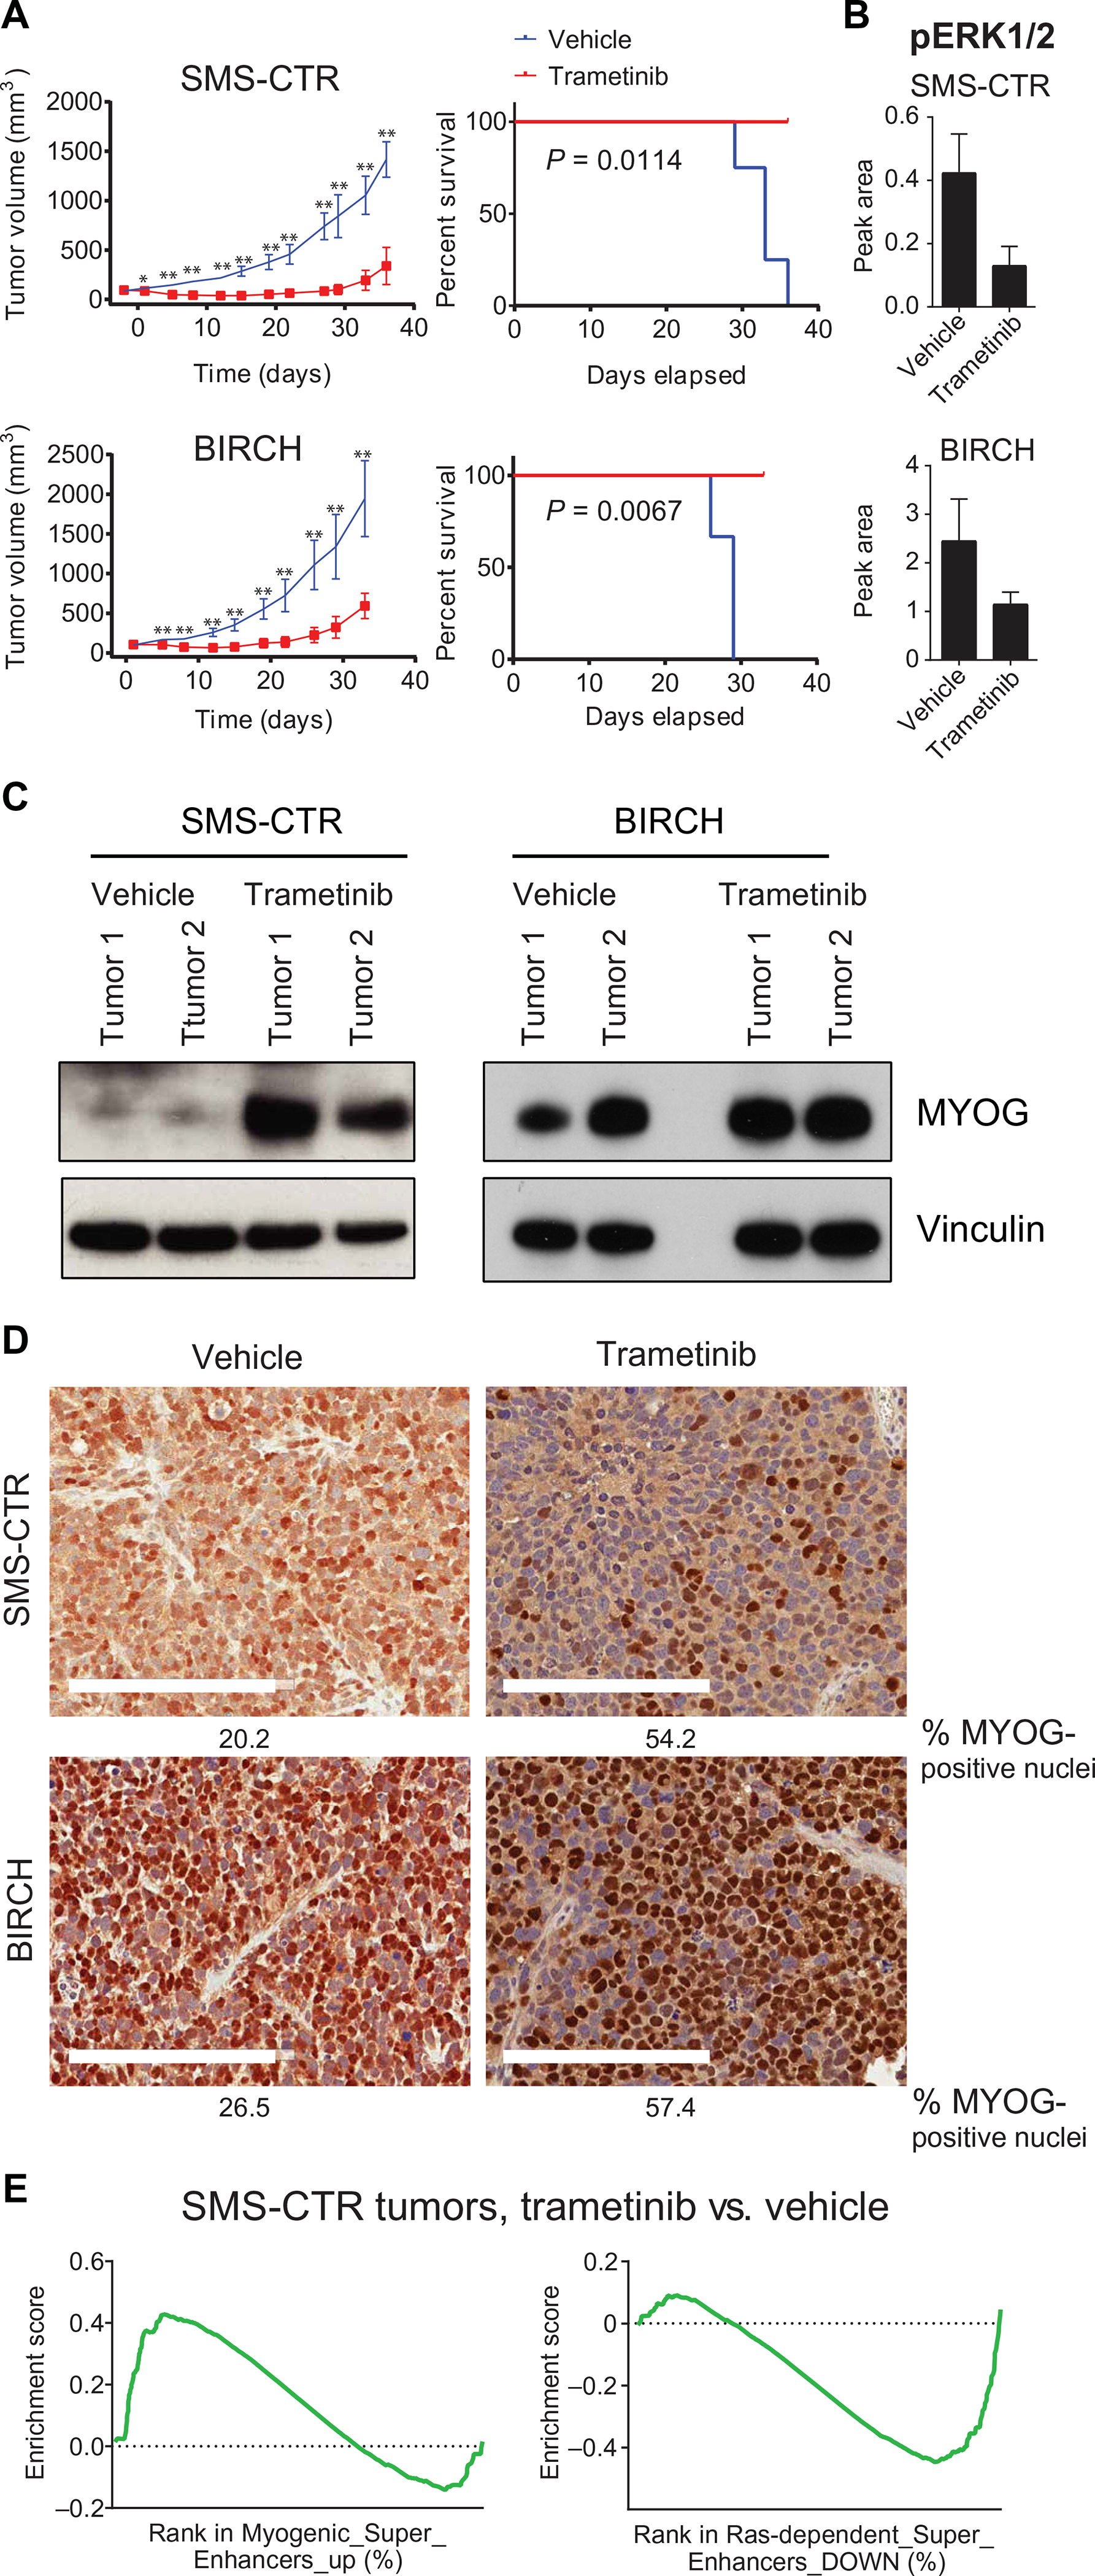
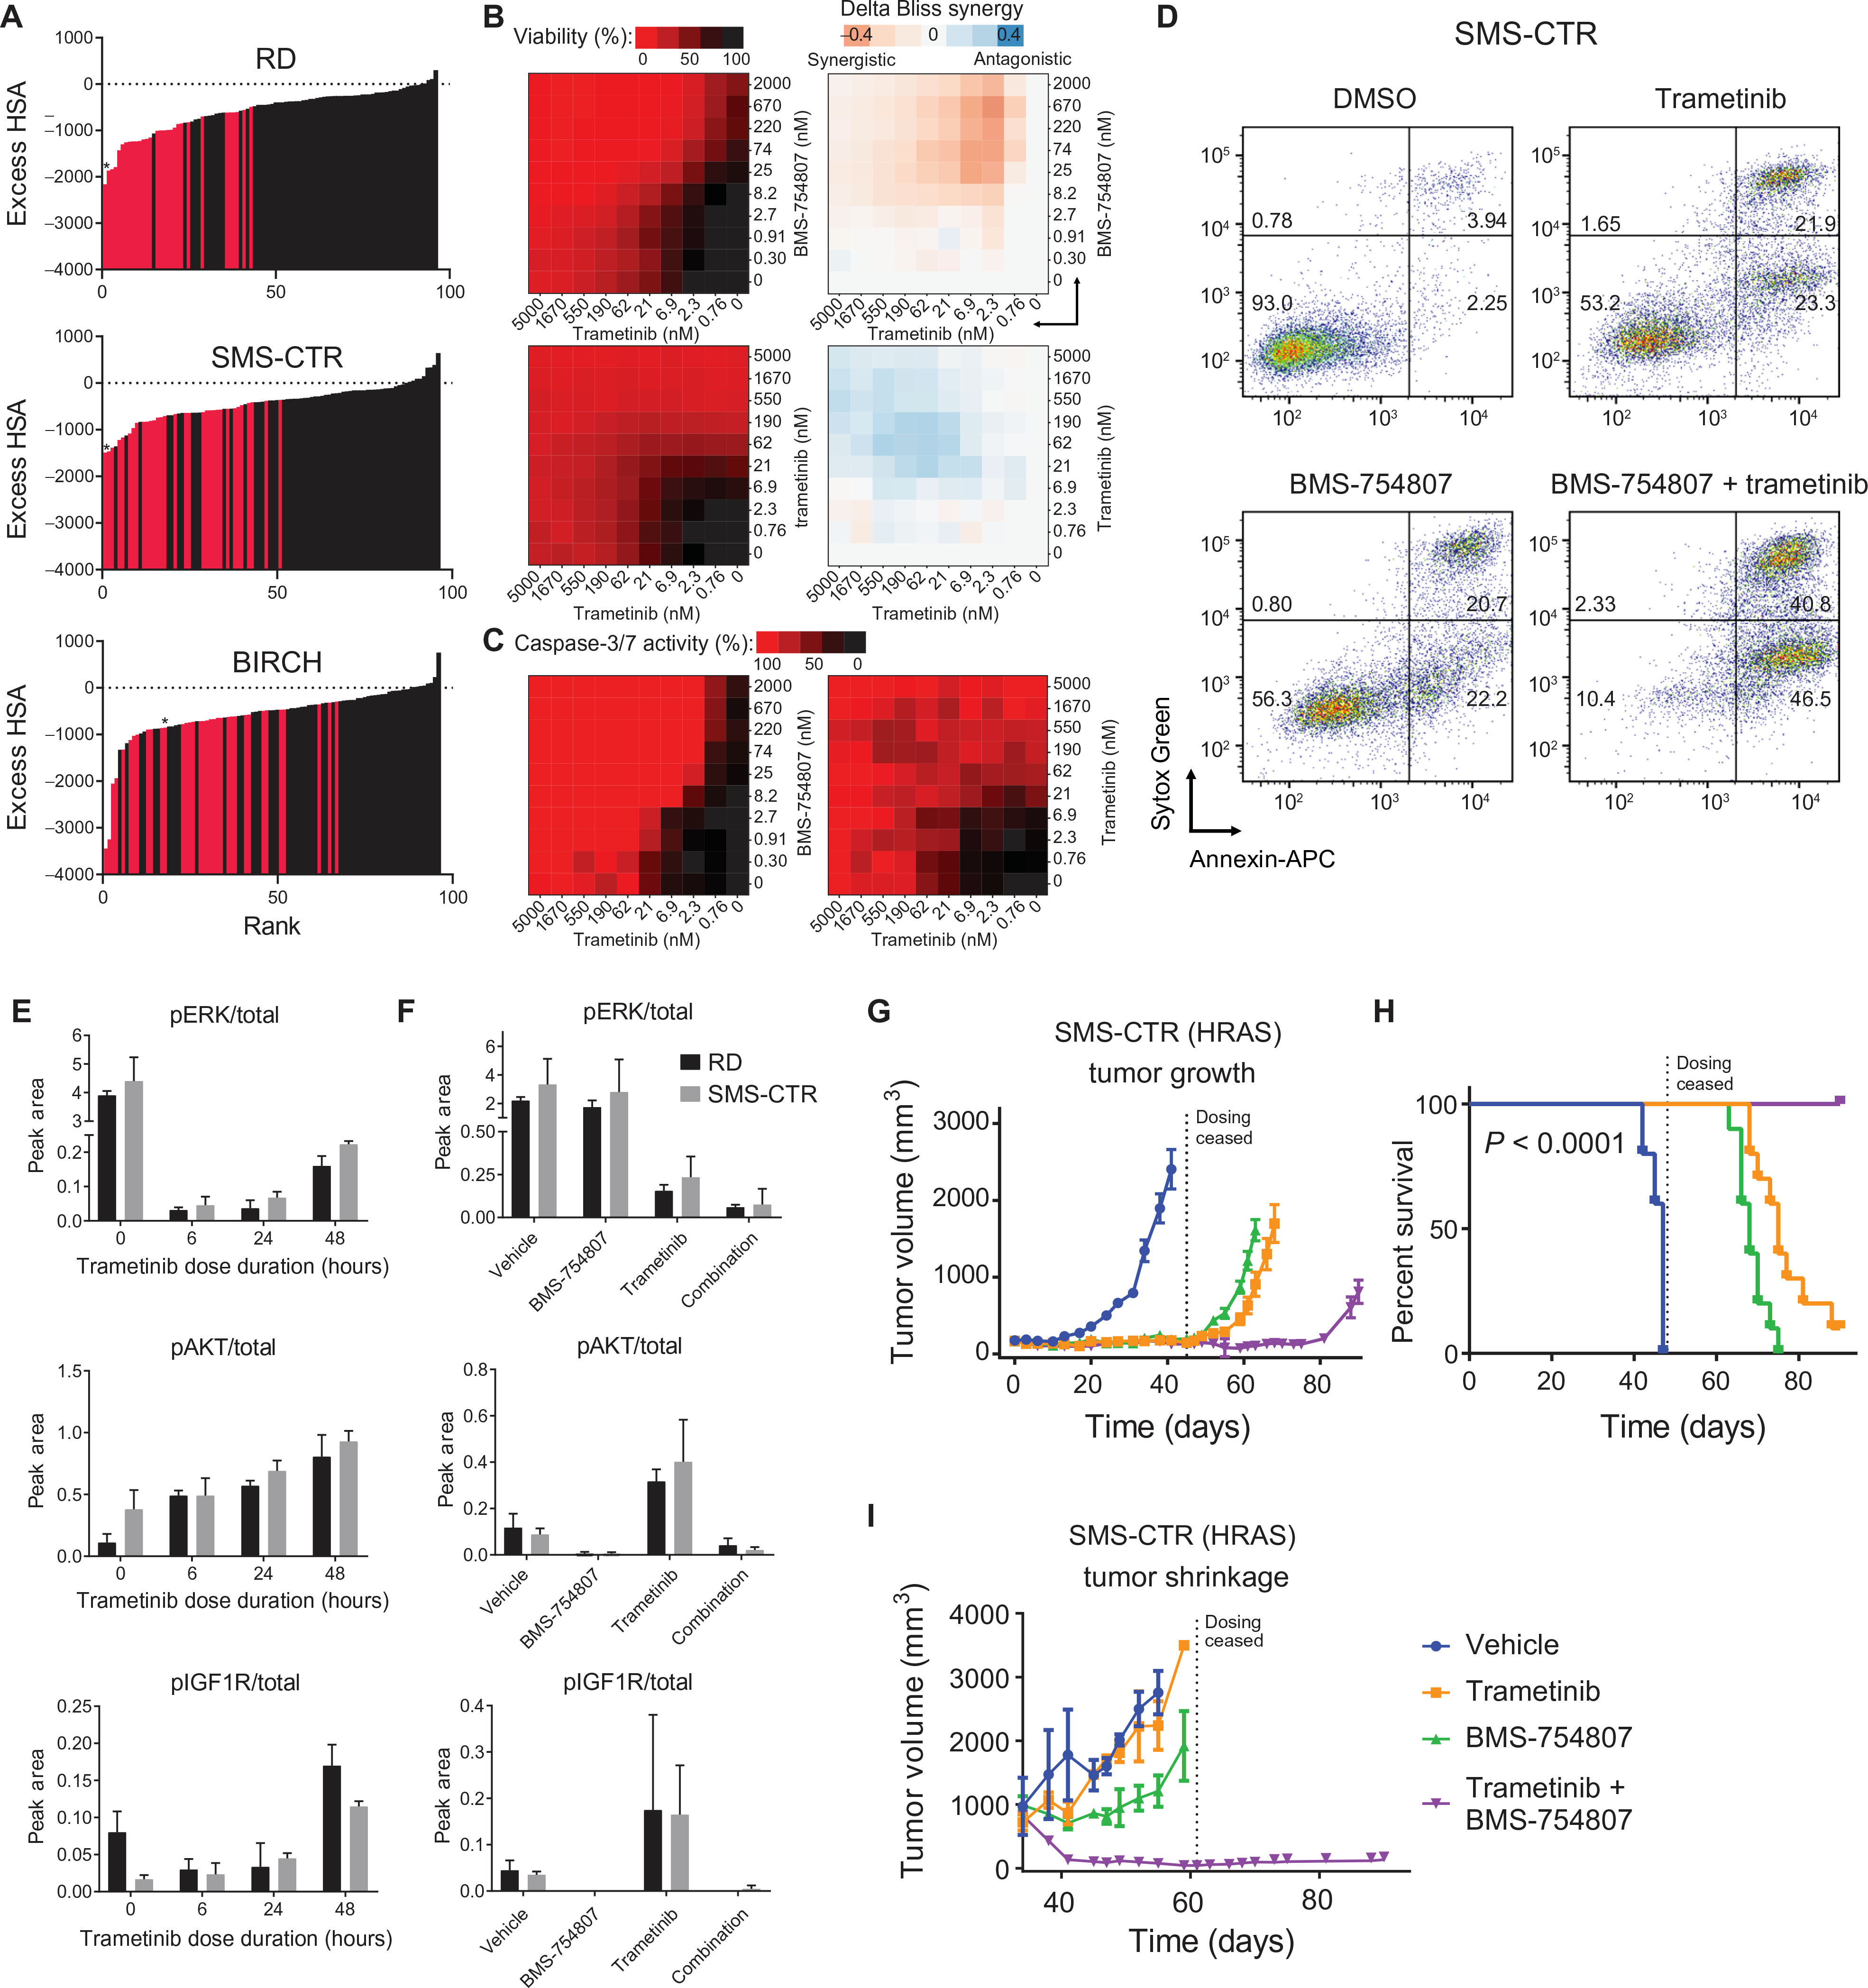
The RAS isoforms are frequently mutated in many types of human cancers, including PAX3/PAX7 fusion-negative rhabdomyosarcoma. Pediatric RMS arises from skeletal muscle progenitor cells that have failed to differentiate normally. The role of mutant RAS in this differentiation blockade is incompletely understood. We demonstrate that oncogenic RAS, acting through the RAF-MEK [mitogen-activated protein kinase (MAPK) kinase]-ERK (extracellular signal-regulated kinase) MAPK effector pathway, inhibits myogenic differentiation in rhabdomyosarcoma by repressing the expression of the prodifferentiation myogenic transcription factor, MYOG. This repression is mediated by ERK2-dependent promoter-proximal stalling of RNA polymerase II at the MYOG locus. Small-molecule screening with a library of mechanistically defined inhibitors showed that RAS-driven RMS is vulnerable to MEK inhibition. MEK inhibition with trametinib leads to the loss of ERK2 at the MYOG promoter and releases the transcriptional stalling of MYOG expression. MYOG subsequently opens chromatin and establishes super-enhancers at genes required for late myogenic differentiation. Furthermore, trametinib, in combination with an inhibitor of IGF1R, potently decreases rhabdomyosarcoma cell viability and slows tumor growth in xenograft models. Therefore, this combination represents a potential therapeutic for RAS-mutated rhabdomyosarcoma.


Conflict of interest statement

Competing interests: The authors declare that they have no competing interests.

Figures

Fig. 1.
Fig. 1.. MEK inhibitors potently and selectively decrease cell viability in FN-RMS.
(A) Expression of BRAF V600E—but not the empty vector control (pBABE), Myr-AKT, or RALA Q75L—inhibits differentiation of C2C12 myoblasts serum-starved for 5 days as determined by immunofluorescence for myosin heavy chain (MHC). Scale bars, 200 μm. Quantification of differentiation index, fusion index, and myocyte width is shown at right. Data are means ± SD for 3 representative fields (indices) or 10 representative myocytes (myocyte width). *P < 0.05. (B) A bubble plot comparing the potency of the classes of compounds found in the MIPE-v4 screen in FN-RMS cell lines with potency in normal cell lines. Each bubble represents a class of drugs; the size of the bubble is proportional to the number of drugs in that class; and the color of the bubble corresponds to the potency of that class. Potency is represented as %AUC. HDAC, histone deacetylase; PLK1, Polo-like kinase; KSP, kinesin-like spindle protein. (C) A wind-rose plot shows that MEK inhibitors are potent and selective for FN-RMS, as compared to fusion-positive RMS (FP-RMS) and normal cell lines. Each cell line investigated corresponds to a spoke of the plot. The size of the wedge along each cell line spoke is proportional to the number of drugs in the class displaying potency of 80% AUC or less. The wedges are colored on the basis of the %AUC of the drugs from red (30%) to blue (80%). FGFR4, fibroblast growth factor receptor 4; HEK293T, human embryonic kidney–293T cells. (D) Quantification (left) and representative images (right) of 14-day clonogenic assays for RD, SMS-CTR, and RH30 in the presence of trametinib. Data are means ± SD for three replicates. (E) Six hours of trametinib treatment decreases ERK phosphorylation in RD (top) and SMS-CTR (bottom) as determined by immunoblot. pERK, phosphorylated ERK; tERK, total ERK.
Fig. 2.
Fig. 2.. MEK/ERK inhibition induces myogenic differentiation in FN-RMS.
(A) Treatment with 100 nM trametinib for 72 hours induces differentiation in SMS-CTR (left) and RD (right) cells grown in complete medium as determined by immunofluorescence for MHC. Scale bars, 200 μm. (B) Volcano plot comparing gene expression in SMS-CTR treated with 100 nM trametinib or vehicle for 48 hours. Statistically significant differentially expressed genes (at least twofold change with P < 0.05) are represented by dark gray dots; genes that are not differentially expressed are represented by light gray dots. Differential expression of MYC (green, decreased expression in trametinib-treated cells), MYOG and MEF2C (blue, increased expression in trametinib-treated cells), and MYOD (black, unchanged expression) is highlighted. (C) Significance (nominal P value) versus normalized enrichment score (NES) plot for gene sets in the C2: canonical pathways molecular signatures database (top) and C3: transcription factor motif molecular signatures database (bottom). (D) Gene set enrichment analysis (GSEA) enrichment plot showing positive enrichment for a set of genes up-regulated during differentiation of human skeletal muscle myoblasts into myotubes in both RD (top) and SMS-CTR (bottom) treated with trametinib or transfected with MEK1 small interfering RNA (siRNA; RD only). For each of the enrichment plots shown here, the false discovery rate (FDR) q value and the nominal P value is < 0.05. (E) Expression of MYOG and MEF2C but not of MYOD is induced by trametinib treatment in RD (left) and SMS-CTR (right) as determined by immunoblot. Expression and phosphorylation of MYC are decreased by trametinib treatment in SMS-CTR as determined by immunoblot (far right). (F) ERK inhibition with 100 nM SCH772894 for 72 hours induces differentiation in SMS-CTR (left) and RD (right) cells grown in complete medium as determined by immunofluorescence for MHC. Scale bars, 200 μm. (G) GSEA enrichment plot showing positive enrichment for a set of genes up-regulated during differentiation of human skeletal muscle myoblasts into myotubes in SMS-CTR treated with the ERK inhibitor, SCH77894 (FDR and nominal P < 0.05).
Fig. 3.
Fig. 3.. ERK2 inhibits RMS differentiation by stalling transcription of MYOG.
(A) ERK2 peaks in SMS-CTR are enriched for pathways important for muscle contraction and development (top), and these peaks are enriched with binding motifs for myogenic and AP-1 transcription factors (bottom). GO, gene ontology. (B) Promoter-proximal ERK2 ChIP-seq peaks that decrease in signal intensity [reported as reference-adjusted reads per million mapped reads (RRPM)] with trametinib treatment, visualized as a box plot (left). The difference in ERK2 signal intensity with trametinib treatment is statistically significant (paired t test). The promoters for which there was a decrease greater than twofold in ERK2 signal intensity are colored teal in the scatter plot at right. The promoters of myogenic transcription factors MYOG and MEF2A are highlighted. (C) Representative ChIP-seq tracks for H3K27me3 (gray), H3K27ac (yellow), and ERK2 (pink), as well as RNA-seq tracks at the MYOG locus (left) and the FBXO32 locus (right) in dimethlysulfoxide (DMSO; top) and trametinib-treated (bottom) SMS-CTR cells. (D) Expression of MYOG as determined by RNA-seq in SMS-CTR in the presence and absence of trametinib. Data are means ± SD for three replicates; P value generated from unpaired t test with Welch’s correction. (E) ChIP–quantitative polymerase chain reaction (qPCR) for ERK2 at the MYOG promoter in SMS-CTR in the presence and absence of trametinib. Results are presented as percentage of input material. Data are means ± SD of three replicates; P value generated from unpaired t test. (F) Representative ChIP-seq tracks for ERK2 (pink), total RNA Pol II (green), S5-phosphorylated Pol II (purple), and S2-phosphorylated Pol II (blue), as well as RNA-seq (gray) tracks at the MYOG locus in the presence and absence of trametinib. (G) ChIP-qPCR for ERK2 at the MYOG promoter in C2C12 expressing mutant RAS isoforms (left) or during normal differentiation (right). Results are presented as percentage of input material. Data are means ± SD of three replicates; P values generated from unpaired t test.
Fig. 4.
Fig. 4.. Trametinib treatment induces chromatin reorganization in SMS-CTR.
(A) Hypergeometric Optimization of Motif Enrichment analysis reveals that regions with increased chromatin accessibility as a function of trametinib treatment are enriched with binding motifs for bHLH transcription factors (green) such as MYOG, among others (top), whereas trametinib-decreased regions are enriched with binding motifs for bZIP transcription factors (blue) such as AP-1, among others (bottom). (B) GREAT analysis shows that increased accessibility regions are enriched for pathways important for skeletal muscle development (green), among others (top), whereas decreased accessibility regions are enriched for pathways important for the negative regulation of MAPK activity (blue), among others (bottom). (C) Composite plots showing DNase hypersensitivity (silver), MYOG (light green), MYOD (dark green), and MYC (blue) signal intensities (RPM) genome-wide in the presence and absence of trametinib treatment in SMS-CTR. (D) MYC and MYOD binding sites overlap enrichments of 12 chromatin states in SMS-CTR, defined by six histone modification marks and CTCF (CCCTC-binding factor). (E) Collaborative co-occupancy of MYC (blue), MYOD (dark green), and MYOG (light green) in the decreased and increased accessibility regions. The presence of each transcription factor at a given region is indicated by a colored line. (F) Bar charts representing the trametinib-induced fold change [log2(FPKM)] of the expression of genes nearest decreased (blue), unchanged (gray), and increased (aqua) accessibility regions. Increased accessibility regions are further subdivided into regions lacking MYOG deposition (aqua, inset at right) and regions with at least one overlapping MYOG peak (green). Error bars represent the 95% confidence interval. ****P < 0.0001, evaluated by Welch’s t test.
Fig. 5.
Fig. 5.. Trametinib treatment remodels the super-enhancer landscape in SMS-CTR.
(A) Ranked order of H3K27ac-loaded enhancers in SMS-CTR treated with DMSO (top) or trametinib (bottom) reveals super-enhancers that are lost (blue), gained (gold), or unchanged (black) because of trametinib treatment. In these figures, the gray dashed line separates super-enchancers (right) from typical enhancers (left). A total of 571 super-enhancers were identified in DMSO-treated cells, and 577 were identified in cells treated with trametinib. (B) Signal tracks for MYOG (light green), MYOD (aqua), MYC (blue), and H3K27ac (yellow) ChIP-seq, DNAse sequencing (DNase-seq) (gray), and RNA-seq (dark green) experiments performed on SMS-CTR treated with DMSO or trametinib for 48 hours at the SPRY1 (Sprouty1; top) and MYH3 (embryonic MHC 3; bottom) loci. Predicted typical enhancers are shown above the signal tracks for each condition in gray; super-enhancers are red. (C) Bar charts representing the number of MYOG peaks per enhancer in the absence and presence of trametinib. ****P < 0.0001, unpaired t test with Fisher’s correction. (D) Violin plots depicting the trametinib-induced fold change [log2(FPKM)] of the expression of genes nearest the RAS-dependent, trametinib-decreased super-enhancers (blue), super-enhancers present in the absence and presence of trametinib (gray), and the myogenic, trametinib-induced super-enhancers (yel low). ****P < 0.0001, unpaired t test with Fisher’s correction. (E) Heat map of super-enhancer-associated transcription factors in SMS-CTR in the absence (DMSO) and presence of trametinib, sorted by the change in total regulatory degree induced by trametinib treatment (left). The regulatory networks, as determined by COLTRON, are shown for DMSO-(right, top) and trametinib-treated (right, bottom) cells, highlighting the centrality of MYOG under the trametinib-treated condition.
Fig. 6.
Fig. 6.. Trametinib inhibits tumor growth and induces differentiation in xenograft models of FN-RMS.
(A) Daily trametinib inhibits tumor growth (left) and prolongs overall survival (right) in severe combined immunodeficient (SCID) Beige mice injected orthotopically with either SMS-CTR (top) or BIRCH (bottom) cell lines. *P < 0.05 and **P < 0.01, unpaired t test. (B) Trametinib decreases ERK phosphorylation in SMS-CTR and BIRCH xenografts as determined by capillary immunoassay. (C) Trametinib treatment increases MYOG expression in RD and SMS-CTR xenografts as determined by immunoblot and immunohistochemistry (D). Scale bars, 200 μm. (E) GSEA comparing gene expression of SMS-CTR xenografts treated with either vehicle or trametinib shows positive enrichment of genes associated with MYOG-induced super-enhancers and negative enrichment of genes associated with RAS-dependent super-enhancers. FDR q < 0.05 and nominal P < 0.01.
Fig. 7.
Fig. 7.. Matrix screen identifies a synergistic combination of an IGF1R inhibitor and a MEK inhibitor in FN-RMS.
(A) Excess HSA versus rank plot representing 96 discreet synergy scores from the 10 × 10 matrix screen in RD, SMS-CTR, and BIRCH. Red bars indicate combinations of IGF1R/PI3K/mTOR/AKT and MEK/ERK inhibitors. Asterisk (*) denotes the combination of BMS-754807 and trametinib. (B) Matrix (10 × 10) plot for the combination of trametinib (0 to 5000 nM) and BMS-754807 (0 to 2000 nM) (top) or the control combination of trametinib with trametinib (bottom) in both viability (CellTiter-Glo; left) and ΔBliss (right) format. (C) Matrix (10 × 10) plot for caspase-3/7 activity of SMS-CTR treated for 16 hours with the combination of trametinib and BMS-754807 (left) or the control combination of trametinib with trametinib (right). (D) Annexin V staining of SMS-CTR cells treated with DMSO, 100 nM trametinib, 350 nM BMS-754807, or the combination of trametinib and BMS-754807 for 72 hours. APC, allophycocyanin. (E) Peak area of the ratio of phosphorylated to total ERK (top), S473 AKT (middle), and IGF1R (bottom) as determined by Simple Western is displayed for RD (black) and SMS-CTR (gray) treated with 100 nM trametinib for the indicated times. (F) Peak area of the ratio of phosphorylated to total ERK (top), S473 AKT (middle), and IGF1R (bottom) as determined by Simple Western is displayed for RD (black) and SMS-CTR (gray) treated with DMSO or 100 nM trametinib for 72 hours, followed by DMSO or 350 nM BMS-754807 for 3 hours. (G) Daily treatment with the combination of trametinib and BMS-754807 prolongs the time to tumor development. Dotted line indicates date at which treatment was stopped (45 days). (H) Prolongation of survival in SMS-CTR xenografts either agent alone or combined (P < 0.0001, Mantel-Cox test for the comparison between single agent and the combination). (I) Daily treatment with the combination of trametinib and BMS-754807 in large established tumors induces regression in SMS-CTR xenografts. Dotted line indicates date at which treatment was stopped (28 days).

References

    1. Prior IA, Lewis PD, Mattos C, A comprehensive survey of Ras mutations in cancer. Cancer Res 72, 2457–2467 (2012). - PMC - PubMed
    1. Cox AD, Fesik SW, Kimmelman AC, Luo J, Der CJ, Drugging the undruggable RAS: Mission possible? Nat. Rev. Drug Discov 13, 828–851 (2014). - PMC - PubMed
    1. Sos ML, Fischer S, Ullrich R, Peifer M, Heuckmann JM, Koker M, Heynck S, Stückrath I, Weiss J, Fischer F, Michel K, Goel A, Regales L, Politi KA, Perera S, Getlik M, Heukamp LC, Ansén S, Zander T, Beroukhim R, Kashkar H, Shokat KM, Sellers WR, Rauh D, Orr C, Hoeflich KP, Friedman L, Wong K-K, Pao W, Thomas RK, Identifying genotype-dependent efficacy of single and combined PI3K- and MAPK-pathway inhibition in cancer. Proc. Natl. Acad. Sci. U.S.A 106, 18351–18356 (2009). - PMC - PubMed
    1. Villanueva J, Infante JR, Krepler C, Reyes-Uribe P, Samanta M, Chen H-Y, Li B, Swoboda RK, Wilson M, Vultur A, Fukunaba-Kalabis M, Wubbenhorst B, Chen TY, Liu Q, Sproesser K, DeMarini DJ, Gilmer TM, Martin A-M, Marmorstein R, Schultz DC, Speicher DW, Karakousis GC, Xu W, Amaravadi RK, Xu X, Schuchter LM, Herlyn M, Nathanson KL, Concurrent MEK2 mutation and BRAF amplification confer resistance to BRAF and MEK inhibitors in melanoma. Cell Rep 4, 1090–1099 (2013). - PMC - PubMed
    1. Darley RL, Burnett AK, Mutant RAS inhibits neutrophil but not macrophage differentiation and allows continued growth of neutrophil precursors. Exp. Hematol 27, 1599–1608 (1999). - PubMed

Publication types

MeSH terms