. 2018 Jul 4;8(3):64.
doi: 10.3390/bios8030064.

The Importance of Multifrequency Impedance Sensing of Endothelial Barrier Formation Using ECIS Technology for the Generation of a Strong and Durable Paracellular Barrier

Affiliations

The Importance of Multifrequency Impedance Sensing of Endothelial Barrier Formation Using ECIS Technology for the Generation of a Strong and Durable Paracellular Barrier

Laverne D Robilliard et al. Biosensors (Basel). .

Abstract

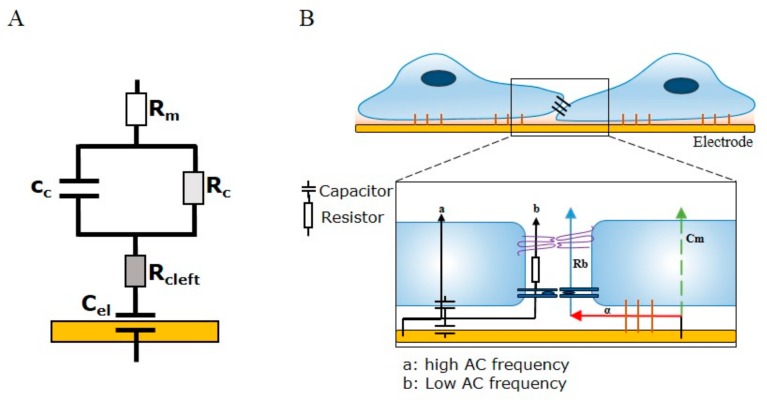
In this paper, we demonstrate the application of electrical cell-substrate impedance sensing (ECIS) technology for measuring differences in the formation of a strong and durable endothelial barrier model. In addition, we highlight the capacity of ECIS technology to model the parameters of the physical barrier associated with (I) the paracellular space (referred to as Rb) and (II) the basal adhesion of the endothelial cells (α, alpha). Physiologically, both parameters are very important for the correct formation of endothelial barriers. ECIS technology is the only commercially available technology that can measure and model these parameters independently of each other, which is important in the context of ascertaining whether a change in overall barrier resistance (R) occurs because of molecular changes in the paracellular junctional molecules or changes in the basal adhesion molecules. Finally, we show that the temporal changes observed in the paracellular Rb can be associated with changes in specific junctional proteins (CD144, ZO-1, and catenins), which have major roles in governing the overall strength of the junctional communication between neighbouring endothelial cells.

Keywords: CD144; ECIS; ZO-1; blood brain barrier; endothelial; resistance.


Conflict of interest statement

The authors declare no conflicts of interest.

Figures

Figure 1
Figure 1
Schematic illustration demonstrating electrical cell-substrate impedance sensing (ECIS) current flow and modelled parameters. (A) An equivalent circuit demonstrating how the electrode, cell layer, and respective media compartments are connected within the ECIS model. Modelling for the paracellular barrier (Rb), basal adhesion (α), and cell membrane capacitance (Cm) integrate different components of the electrode capacitance (Cel), the basal cleft resistance (Rcleft), the cell capacitance and resistance (Cc and Rc, respectively), and the resistance of apical medium (Rm); (B) A schematic of endothelial cells grown on an ECIS electrode. Changes in cell–cell junctions and subcellular adhesion can be measured with ECIS as changes in the current flow at high (>10,000 Hz) and low (4000 Hz) frequencies. A high-frequency current passes through the cell body to couple the capacitive functions of the electrode and cell membrane. Low frequencies take the paracellular route and are resisted by intercellular junctions such as tight junctions and adherens junctions (measured as resistance). Analysis of confluent monolayer properties uses the modelled parameters Rb, α, and Cm. Rb is dependent on the collective sum of the intercellular space and the tightness of cell–cell junctions, α is dependent on the cell radius and subcellular adhesion, and Cm models changes in the composition of cell membranes.
Figure 2
Figure 2
Diagrammatic description of ECIS-Zθ capacitance theory. (A) The attachment and cell growth over an ECIS electrode over time. At T = 0 the total capacitance (CT) of the system is equal to the sum of the electrode capacitance (Ce) in parallel. As cells progressively adhere to the surface electrodes, an increasing proportion of CT is represented by the cell-electrode capacitance (Cc). The cell-electrode capacitance can be interpreted as capacitors connected in series; (B) Graphical representation of the change in total capacitance over time, as cells adhere to and cover exposed electrode areas.
Figure 3
Figure 3
Monitoring parameters R (Ω), Rb (Ω cm2), α (Ω0.5 cm), and Cm (µF/cm2). (A) Time course of resistance magnitude at 4000 Hz for endothelial cells. Influence of the cell growth phase and formation of a cell monolayer on resistance; (B) Time course of modelled parameter magnitudes. Illustration of the changes in the three parameters Rb, α, and Cm as a result of cell growth and monolayer formation as can be seen by an increase in Rb overtime. Time point 0 h denotes the time at which cells were seeded at 20,000 cells per well. Data (A) show the mean ± SD (n = 3 wells) of one independent experiment representative of three experimental repeats.
Figure 4
Figure 4
Resistance and modelled parameters Rb, α, and Cm of brain endothelium grown in either Enriched Media or Minimal Media. Endothelial cells were seeded at 20,000 cells per well on a 96w20idf ECIS array. Time 0 h denotes the time cells were seeded. The dotted vertical line indicates 48 h of cell growth in each respective media type, with a subsequent media change carried out at this time. (A) Resistance at 4000 Hz trace over 120 h of cell growth; (B) Raw capacitance trace over 120 h of cell growth; (C) Modelled parameter, Rb, trace over 120 h of cell growth; (D) Modelled parameter, α, trace over 120 h of cell growth; (E) Modelled parameter, Cm, trace over 120 h of cell growth. Data show the mean ± SD (n = 3 wells) of one independent experiment representative of three experimental repeats. Graphical representations of p values are * p ≤ 0.05, ** p ≤ 0.01, *** p ≤ 0.001, **** p ≤ 0.0001.
Figure 5
Figure 5
Changes in Rb as a consequence of altering growth medium components as shown by brain endothelium. Endothelial cells were seeded at 20,000 cells per well on a 96w20idf ECIS array. Time 0 h denotes the time cells were seeded. The dotted vertical line indicates 48 h of cell growth in each respective media type, with a subsequent media change carried out at this time. (A) Brain endothelium grown in Enriched Media containing either 10%, 5%, or 2% FBS; (B) Brain endothelium grown in Enriched Media containing either 160 µM, 80 µM, 40 µM, or 0 µM cAMP; (C) Brain endothelium grown in Enriched Media containing either 1 µg/mL, 39 ng/mL, or 0 ng/mL hydrocortisone; (D) Brain endothelium grown in Enriched Media containing either 1 ng/mL or 0 ng/mL EGF; (E) Brain endothelium grown in Enriched Media containing either 3 ng/mL or 0 ng/mL FGF; (F) Brain endothelium grown in Enriched Media containing either 10 µg/mL or 0 µg/mL heparin; (G) Brain endothelium grown in Enriched Media containing either 1× or no Glutamax. Data show the mean ± SD (n = 3 wells) of one independent experiment representative of three experimental repeats. Graphical representations of p values are * p ≤ 0.05, ** p ≤ 0.01, *** p ≤ 0.001, **** p ≤ 0.0001.
Figure 6
Figure 6
Immunocytochemistry of brain endothelial junctional space following growth in either Enriched Media or Minimal Media. Cells were seeded at time 0 h at 20,000 cells per 0.3 cm2. (A) ECIS resistance and Rb measurements over 120 h. Cells were grown in either Enriched Media or Minimal Media from T = 0 h, with media changed at T = 48 h (I). Data shown is the mean ± SD (n = 3 wells) of one independent experiment representative of three experimental repeats; (B) Cell number count of Hoechst stained nuclei at time point II, obtained through Image J Software analysis. Data shown is the mean ± SEM (n = 18 wells) of 1 independent experiment representative of 3 experimental repeats; (C) The junctional space following growth in either Enriched Media or Minimal Media 72 h post seeding. The time point of fixation corresponds to the second vertical dotted line (II) shown on the ECIS traces. Representative GFP/DAPI and GFP monochrome images for the junctional proteins CD144, ZO-1, β-catenin, and α-catenin are shown. Each panel shows cells grown in Minimal Media on the left and cells grown in Enriched Media on the right. The corresponding Alexa Fluor 488 (GFP) monochrome image is shown below each merged image. Green—junctional protein, blue—nuclei. Scale bar is 200 µm. Immunocytochemistry data show one representative image from one independent experiment, which is representative of three experimental repeats. Graphical representations of p values are * p ≤ 0.05, ** p ≤ 0.01, *** p ≤ 0.001, **** p ≤ 0.0001.
Figure 7
Figure 7
Immunocytochemistry of brain endothelial junctional space following growth in either Enriched Media or Minimal Media. Cells were seeded at time 0 h at 20,000 cells per 0.3 cm2. (A) ECIS resistance and Rb measurements over 120 h. Cells were grown in either Enriched Media or Minimal Media from T = 0 h, with media changed at T = 48 h (I). Data shown is the mean ± S.D. (n = 3 wells) of 1 independent experiment representative of 3 experimental repeats; (B) Cell number count of Hoechst stained nuclei at time point II, obtained through Image J Software analysis. Data shown is the mean ± SEM (n = 18 wells) of 1 independent experiment representative of 3 experimental repeats; (C) The junctional space following growth in either Enriched Media or Minimal Media 72 h post seeding. The time point of fixation corresponds to the second vertical dotted line (II) shown on the ECIS traces. Representative GFP/DAPI and GFP monochrome images for the junctional proteins CD144, ZO-1, β-catenin and α-catenin are shown. Each panel shows cells grown in Minimal Media on the left and cells grown in Enriched Media on the right. The corresponding Alexa Fluor 488 (GFP) monochrome image is shown below each merged image. Green—junctional protein, blue—nuclei. Scale bar is 200 µm. Immunocytochemistry data shows 1 representative image from 1 independent experiment, which is representative of 3 experimental repeats. Graphical representations of p values are * p ≤ 0.05, ** p ≤ 0.01, *** p ≤ 0.001, **** p ≤ 0.0001.

References

    1. Persidsky Y., Ramirez S., Haorah J., Kanmogne G. Blood–brain Barrier: Structural Components and Function under Physiologic and Pathologic Conditions. J. Neuroimmune Pharmacol. 2006;1:223–236. doi: 10.1007/s11481-006-9025-3. - DOI - PubMed
    1. Reiss B., Wegener J. Impedance analysis of different cell monolayers grown on gold-film electrodes; Proceedings of the 37th Annual International Conference of the IEEE Engineering in Medicine and Biology Society (EMBC); Milan, Italy. 25–29 August 2015; pp. 7079–7082. - PubMed
    1. Stolwijk J., Matrougui K., Renken C., Trebak M. Impedance analysis of GPCR-mediated changes in endothelial barrier function: Overview and fundamental considerations for stable and reproducible measurements. Eur. J. Physiol. 2015;467:2193–2218. doi: 10.1007/s00424-014-1674-0. - DOI - PMC - PubMed
    1. MacDonald C., Unsworth C.P., Graham E.S. Enrichment of differentiated hNT neurons and subsequent analysis using flow-cytometry and xCELLigence sensing. J. Neurosci. Methods. 2014;227:47–56. doi: 10.1016/j.jneumeth.2014.02.004. - DOI - PubMed
    1. Van Kralingen C., Kho D.T., Costa J., Angel C.E., Graham E.S. Exposure to Inflammatory Cytokines IL-1β and TNFα Induces Compromise and Death of Astrocytes; Implications for Chronic Neuroinflammation. PLoS ONE. 2013;8:e84269. doi: 10.1371/journal.pone.0084269. - DOI - PMC - PubMed

LinkOut - more resources