. 2018 Jul 4;8(1):10082.
doi: 10.1038/s41598-018-28414-w.

Identification of genes underlying the enhancement of immunity by a formula of lentinan, pachymaran and tremelia polysaccharides in immunosuppressive mice

Affiliations

Identification of genes underlying the enhancement of immunity by a formula of lentinan, pachymaran and tremelia polysaccharides in immunosuppressive mice

Xia Luo et al. Sci Rep. .

Abstract

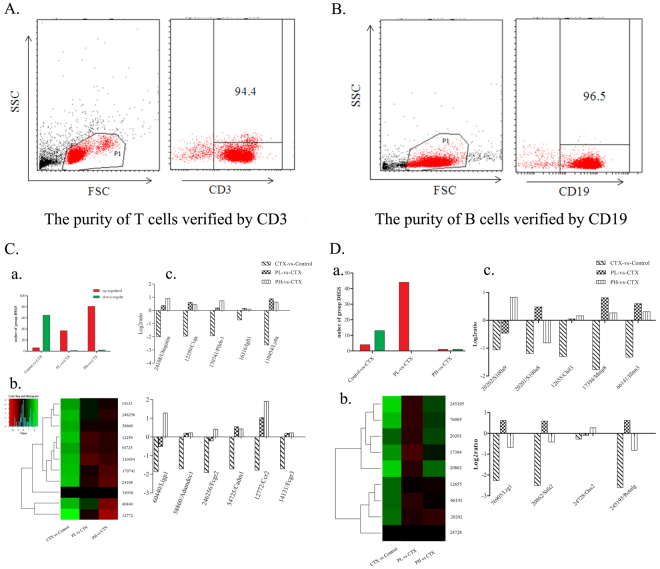
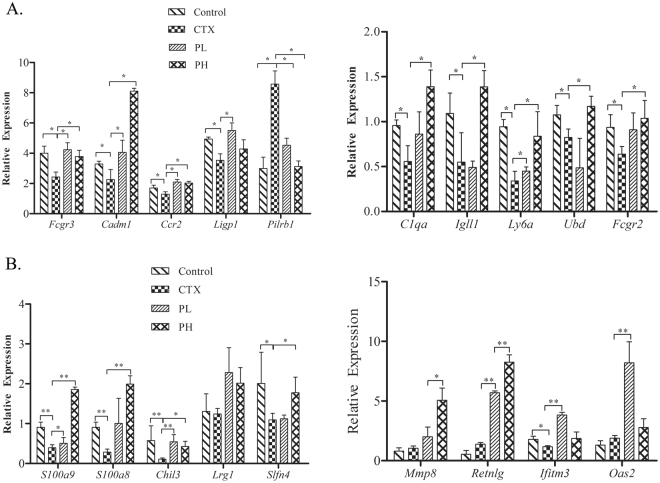
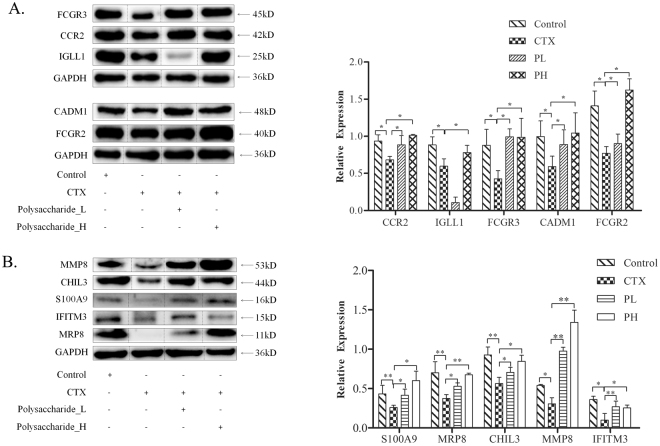
The efficacy of polysaccharides is widespread, especially in immune regulation. However, the genetic basis of the changes in polysaccharides regulating immunity is unclear. To obtain genome-wide insights into transcriptome changes and regulatory networks, we designed a polysaccharide formula, comprising lentinan, pachymaran and tremelia, to increase the availability of their optimized active sites. In this case, we focused on a model of immunosuppression to investigate genes by digital gene expression (DGE) tag profiling in T and B cells. These genes were further validated by qRT-PCR and Western blot experiments. Consequently, polysaccharide formula treatment helped to recover the expression of immune-related genes, including CADM1, CCR2, IGLL1, LIGP1, and FCGR3, FCGR2 in B cells, as well as S100A8, S100A9, ChIL3, MMP8 and IFITM3 in T cells. These results suggest that treatment with polysaccharides improves the immunity of immunosuppressive mice by regulating genes associated with T and B cell functions.


Conflict of interest statement

The authors declare no competing interests.

Figures

Figure 1
Figure 1
Effects of the polysaccharide formula on killing activity of NK cells in immunosuppressive mice. YAC-1 cells were stained with CFSE as target cells, the dead cells were stained with PI, and CFSE+PI+ (Q2) were considered killed cells. The figure shows that the compound polysaccharide could improve the killing activity of NK cells. *p < 0.05.
Figure 2
Figure 2
Effects of the polysaccharide formula on macrophage phagocytosis in immunosuppressive mice. The activation of peritoneal macrophage phagocytosis showed with microspheres labeled with CFSE. The first peak on the left shows that the macrophages phagocytosed one microsphere, the second peak shows the phagocytosis of two microspheres, and so on. The figure shows that the compound polysaccharide could improve macrophage phagocytosis. *p < 0.05.
Figure 3
Figure 3
Effect of the polysaccharide formula on lymphocytes. (A and B) Proportion and activation of T and B cells. Lymphocytes isolated from the spleen were stained with CD3-PEcy7, CD19-PE and CD69-FITC, and analyzed by flow cytometry. CD3+ (P4) were considered T cells, CD19+ (P3) were considered B cells, CD3+CD69+ (Q2) were considered activated T cells, and CD19+CD69+ were considered activated B cells (Q2-1). (C) Cytokines in peripheral blood, *P < 0.05. (D) Antibody in serum and the small intestine, *p < 0.05.
Figure 4
Figure 4
Analysis of the polysaccharide formula on genes in T and B cells in immunosuppressed mice by DGE. (A,B) Lymphocytes from the spleen isolated by microbeads were stained with CD3-PE, and B220-PE (B cells) to test the purity. The figure shows that the isolated cells are pure. (C,a) Quantitative statistics of differentially expressed genes in B cells, the red shows up-regulated genes, and the green shows down-regulated genes. PL is the low dose group of polysaccharides with 200 mg/kg/bw and PH is the high dose of polysaccharide with 400 mg/kg/bw. (b) Hierarchical clustering of differential gene expression in B cells. The clustered map accorded by the log2 of significant difference multiples between the groups. Each row represents a gene and each column represents the comparison between the two groups, the red shows up-regulated genes, and the green shows down-regulated genes, the deeper the color the higher the gene expression. The gene ID is shown on the right, and the enrichment and the function of the displayed genes are shown, with references of the polysaccharide effect on these genes. (c) Statistics on the log2 value of the gene difference multiple in B map. The negative value is down-regulated and the positive value is up-regulated expression, and the 0 indicates no change. The figure shows that the formula of polysaccharide could restore the expression of the following genes in B cells: 24108/Ubiquitin, 12259/C1qa, 170741/Pilrb-1, 16316/Igll1, 110454/Ly6a, 60440/Ligp1, 58860/Adamdec1, 246256/Fcgr2, 54725/Cadm1, 12772/Ccr2 and 14131/Fcgr3. (D,a) Quantitative statistics of differentially expressed genes in T cells. (b) Hierarchical clustering of differential gene expression in T cells. The clustered map accorded by the log2 of significant difference multiples between the groups. (c) The figure shows that the compound polysaccharide could restore the expression of the following genes in T cells: 20202/S100a9, 20201/S100a8, 12655/Chil3, 17394/Mmp8, 66141/Ifitm3, 76905/Lrg1, 20862/Stfa2, 24728/Oas2 and 245195/Retnlg.
Figure 5
Figure 5
qRT-PCR validation of DGE results of polysaccharides on the genes in T and B cells in immunosuppressed mice. (A) The expression of B cell genes. The figure shows that the polysaccharide formula could up-regulate Fcgr3, Cadm1, Ccr2, Ligp1, C1qa, IgllI, Ly6a, Ubd and Fcgr2 in B cells, consistent with the results of DGE. (B) The expression of T cell genes. The figure shows that t the polysaccharide formula could up-regulate S100a9, S100a8, Chil3, Slfn4, and Ifim3 in T cells, consistent with the results of DGE. (*p < 0.05, **p < 0.01).
Figure 6
Figure 6
Western blot validation of the DGE results of compound polysaccharides on T and B cell proteins in immunosuppressed mice. (A) The expression of B cell proteins. The figure shows that the compound polysaccharide could up-regulate CCR2, IGLL1, FCGR3, CADM1 and FCGR2, consistent with the results of DGE and qRT-PCR. (B) The expression of T cell proteins. The figure shows that the polysaccharide formula could up-regulate S100A9, MRP8, CHIL3, MMP8 and IFITM3 in T cells. (*p < 0.05, **p < 0.01).

Similar articles

Cited by

References

    1. Mu X, et al. Angelica Sinensis Polysaccharide Prevents Hematopoietic Stem Cells Senescence in D-Galactose-Induced Aging Mouse Model. Stem Cells Int. 2017;2017:3508907. doi: 10.1155/2017/3508907. - DOI - PMC - PubMed
    1. Shin MS, Hwang SH, Yoon TJ, Kim SH, Shin KS. Polysaccharides From Ginseng Leaves Inhibit Tumor Metastasis Via Macrophage and NK Cell Activation. Int J Biol Macromol. 2017;103:1327–1333. doi: 10.1016/j.ijbiomac.2017.05.055. - DOI - PubMed
    1. Sundberg-Kovamees M, Grunewald J, Wahlstrom J. Immune Cell Activation and Cytokine Release After Stimulation of Whole Blood with Pneumococcal C-polysaccharide and Capsular Polysaccharides. Int J Infect Dis. 2016;52:1–8. doi: 10.1016/j.ijid.2016.07.004. - DOI - PubMed
    1. Qin T, et al. Effects of Selenizing Codonopsis Pilosula Polysaccharide On Macrophage Modulatory Activities. J Microbiol Biotechnol. 2016;26:1358–1366. doi: 10.4014/jmb.1601.01094. - DOI - PubMed
    1. Zhu N, et al. Comparison of Immunoregulatory Effects of Polysaccharides From Three Natural Herbs and Cellular Uptake in Dendritic Cells. Int J Biol Macromol. 2016;93:940–951. doi: 10.1016/j.ijbiomac.2016.09.064. - DOI - PubMed

Publication types

LinkOut - more resources