. 2018 Jul;559(7713):259-263.
doi: 10.1038/s41586-018-0278-9. Epub 2018 Jul 4.

Species-specific activity of antibacterial drug combinations

Affiliations

Species-specific activity of antibacterial drug combinations

Ana Rita Brochado et al. Nature. 2018 Jul.

Abstract

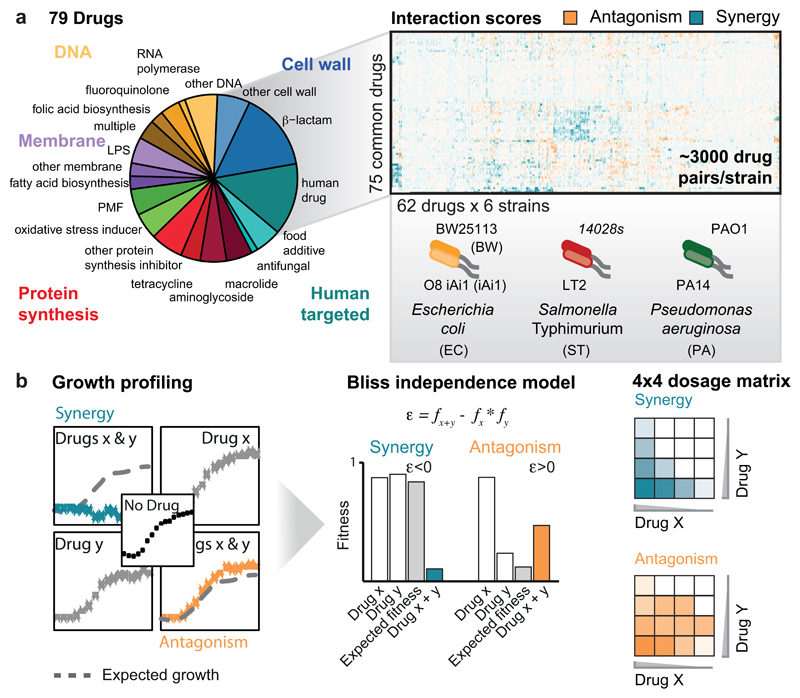
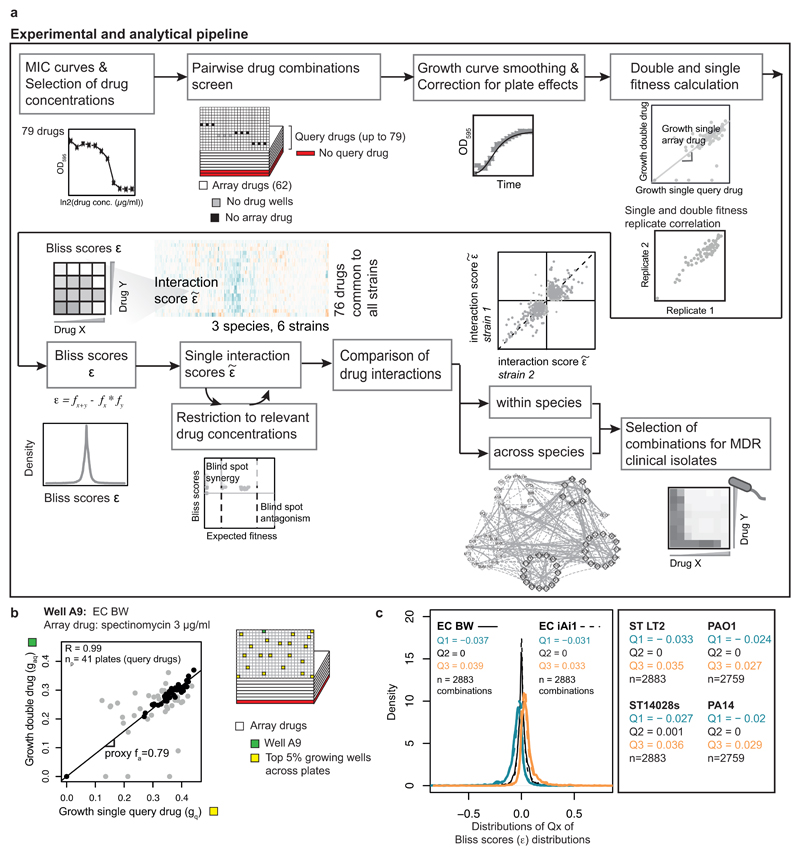
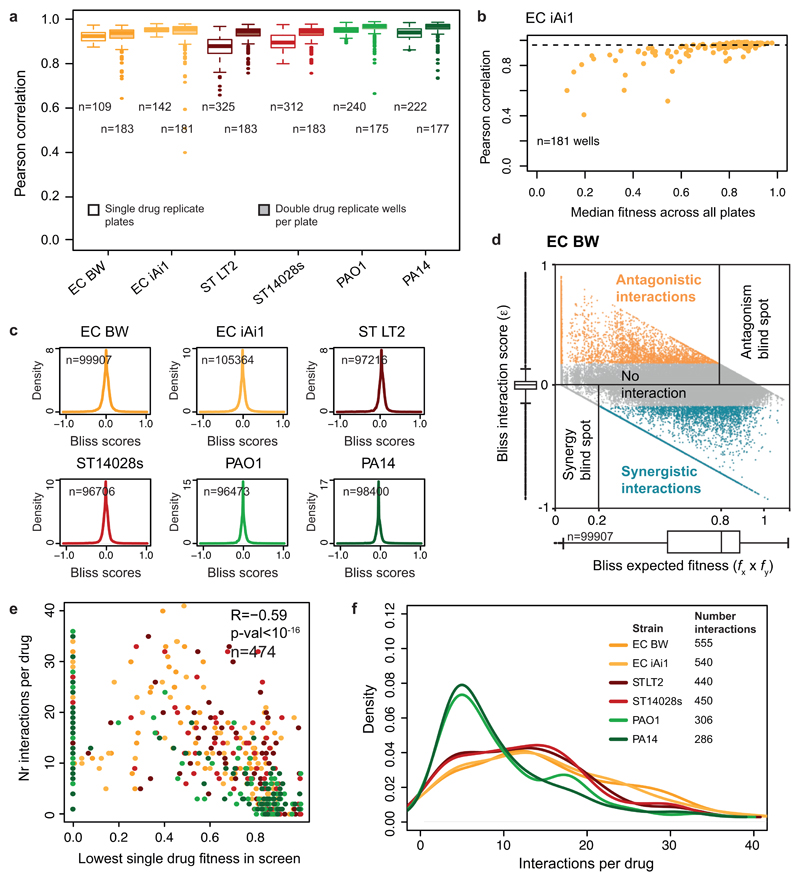
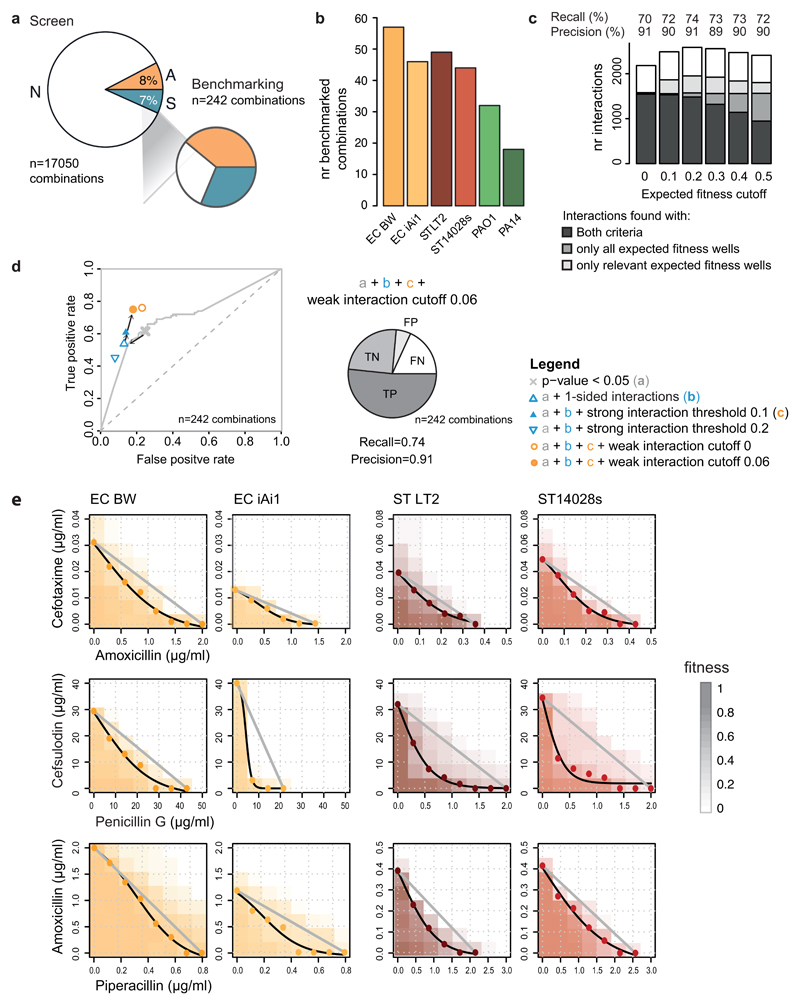
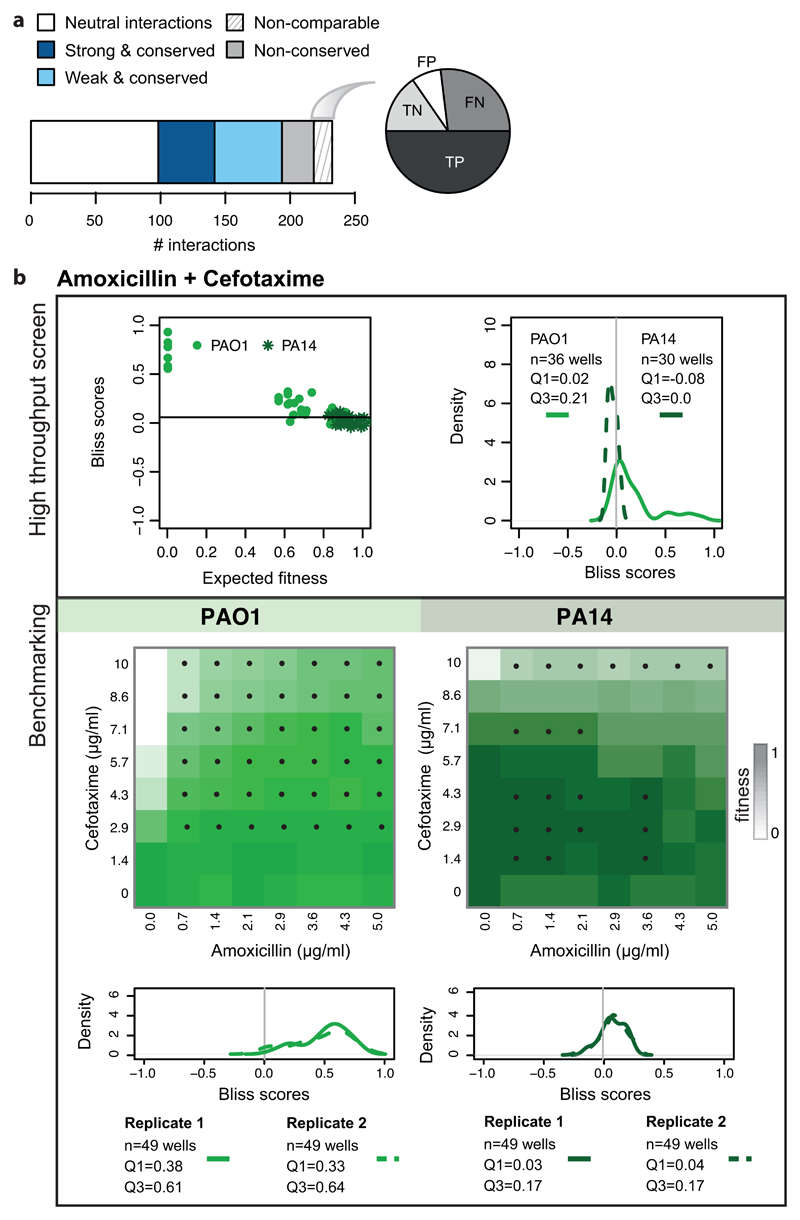
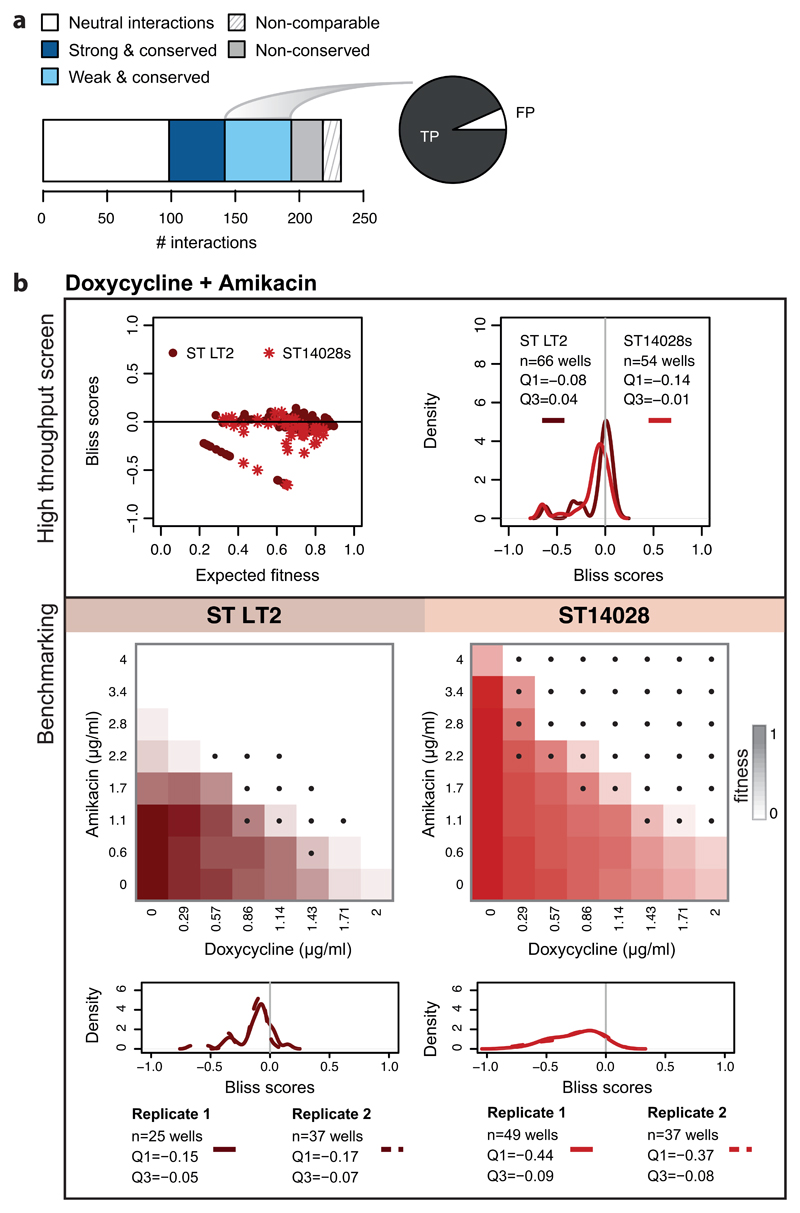
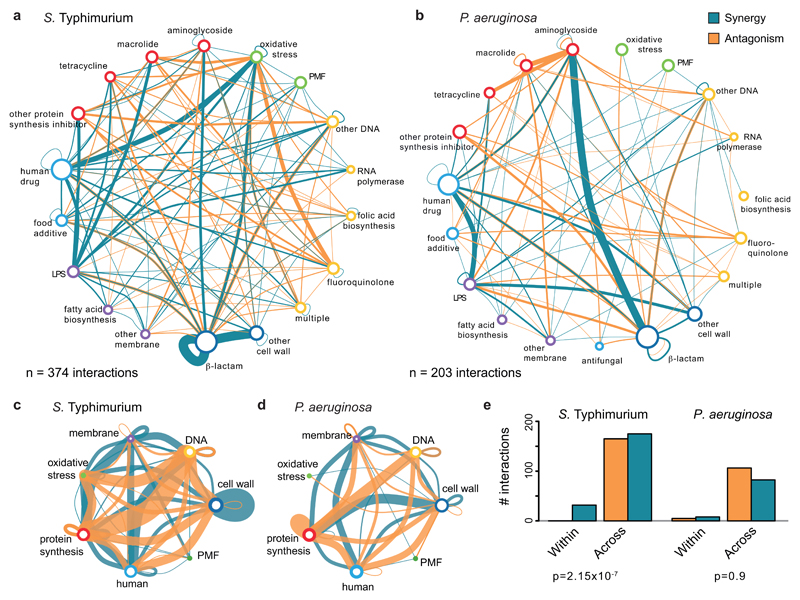
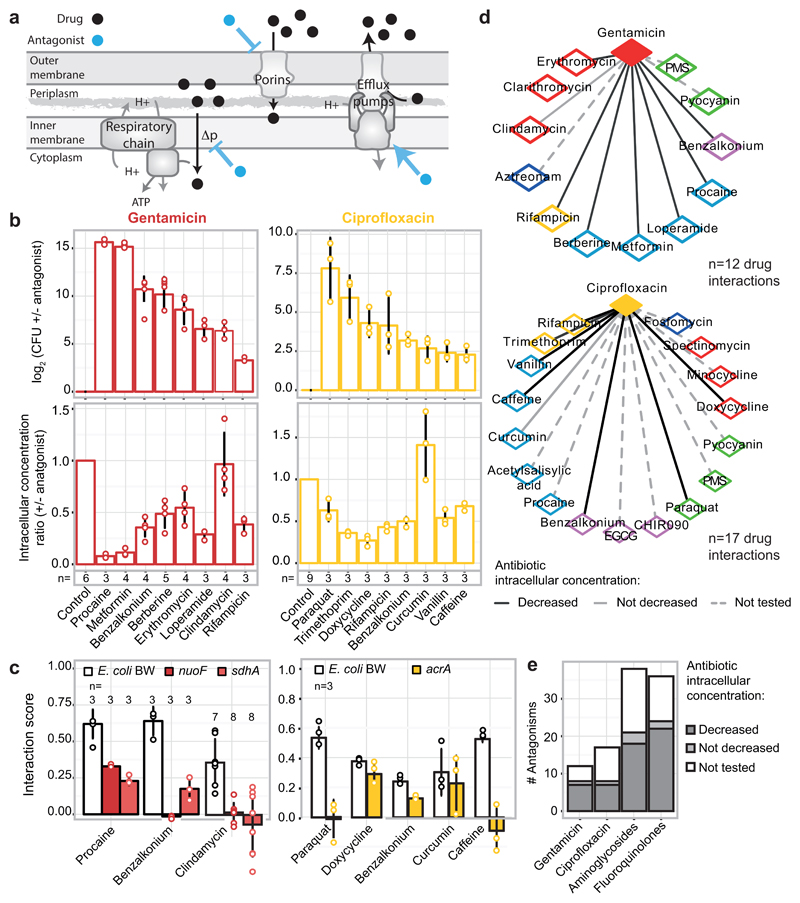
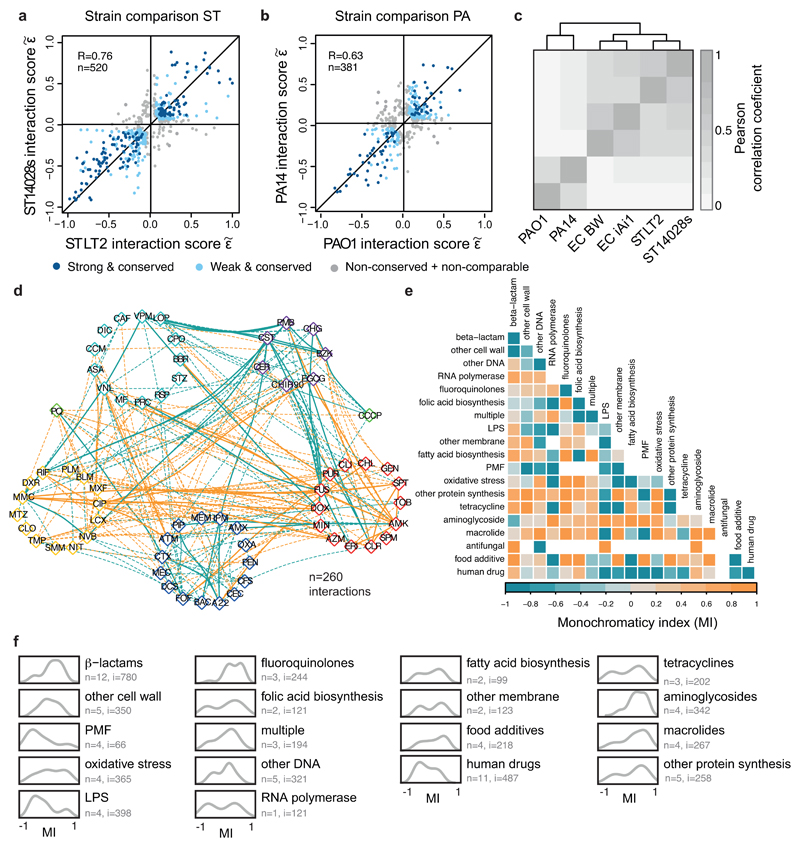
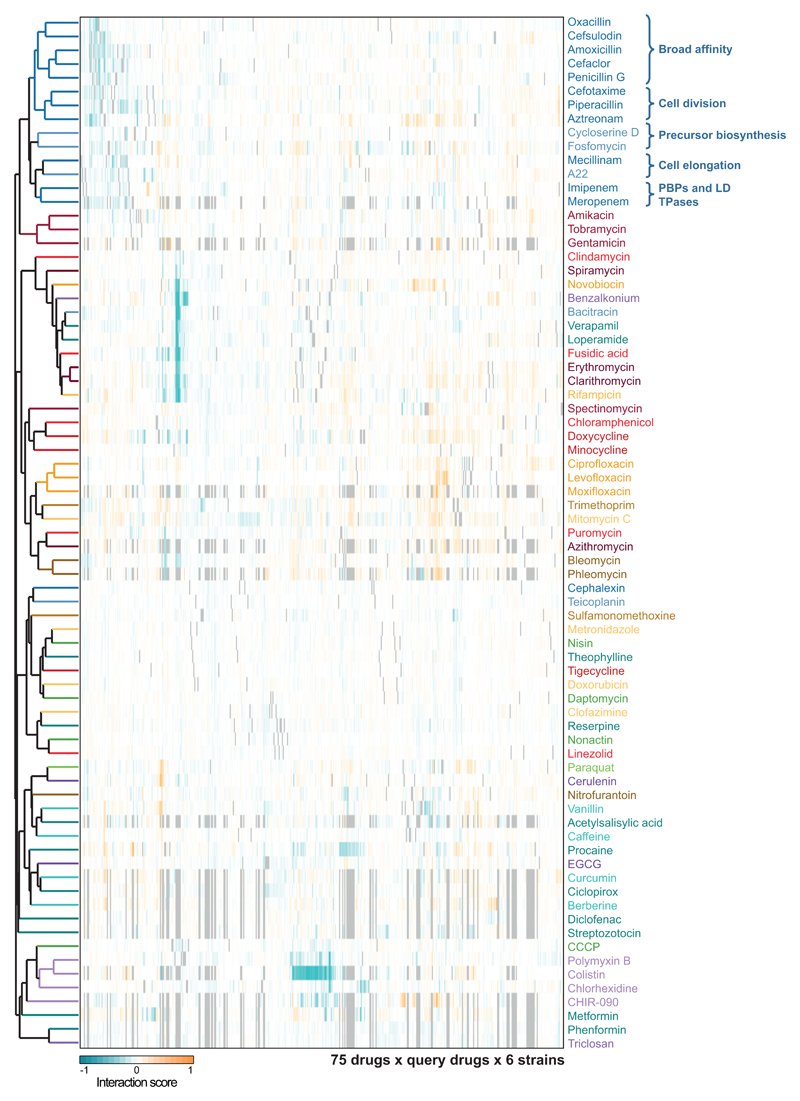
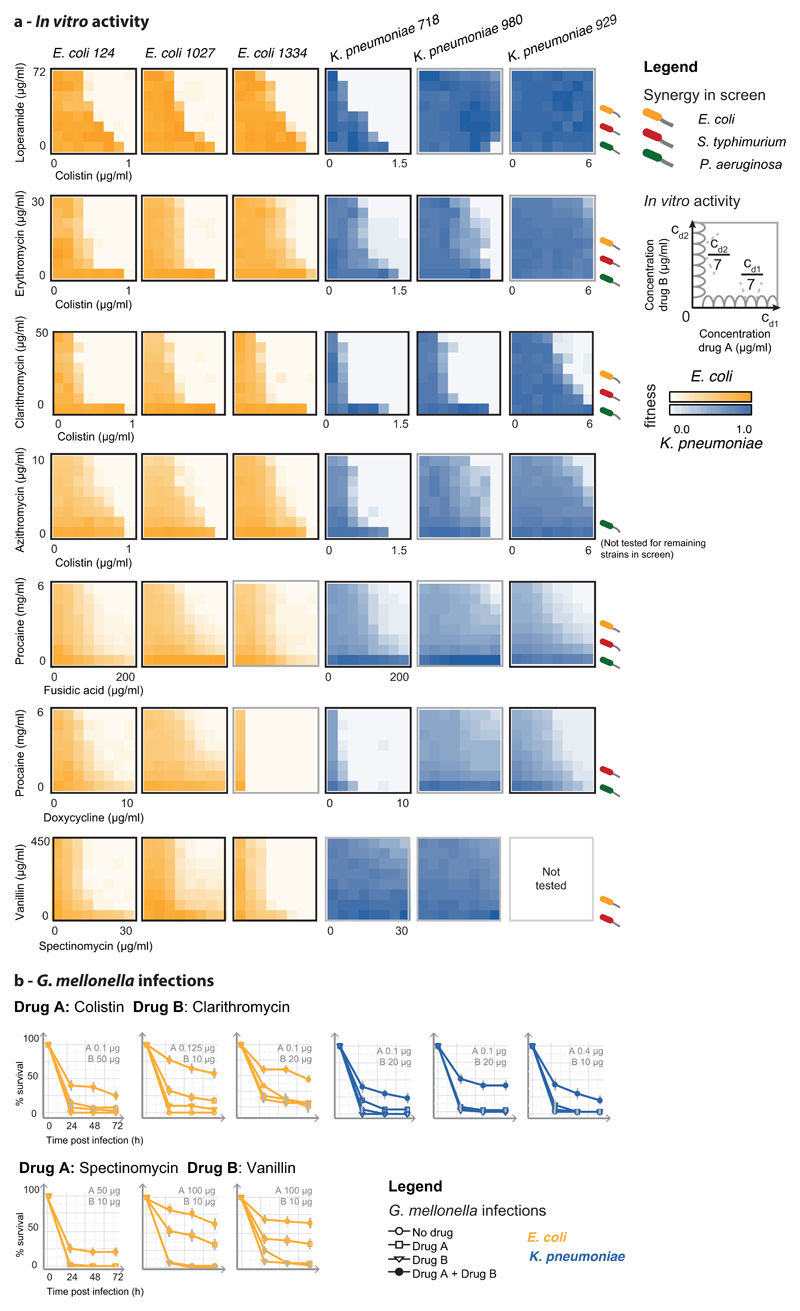
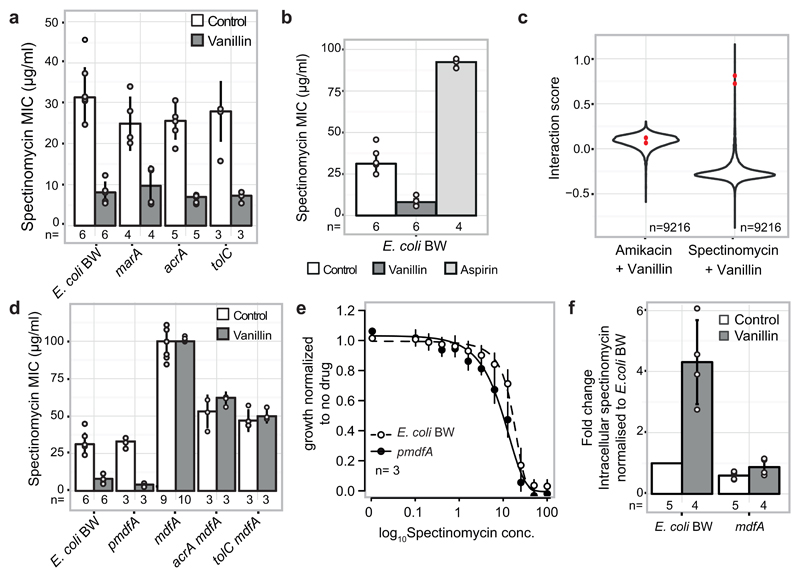
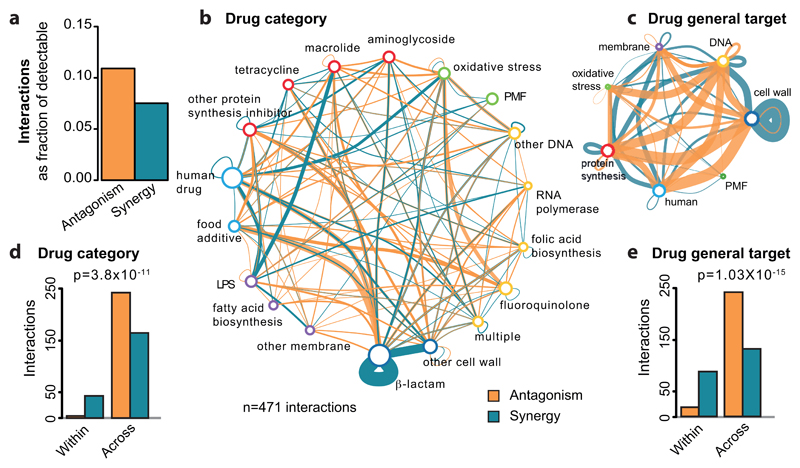
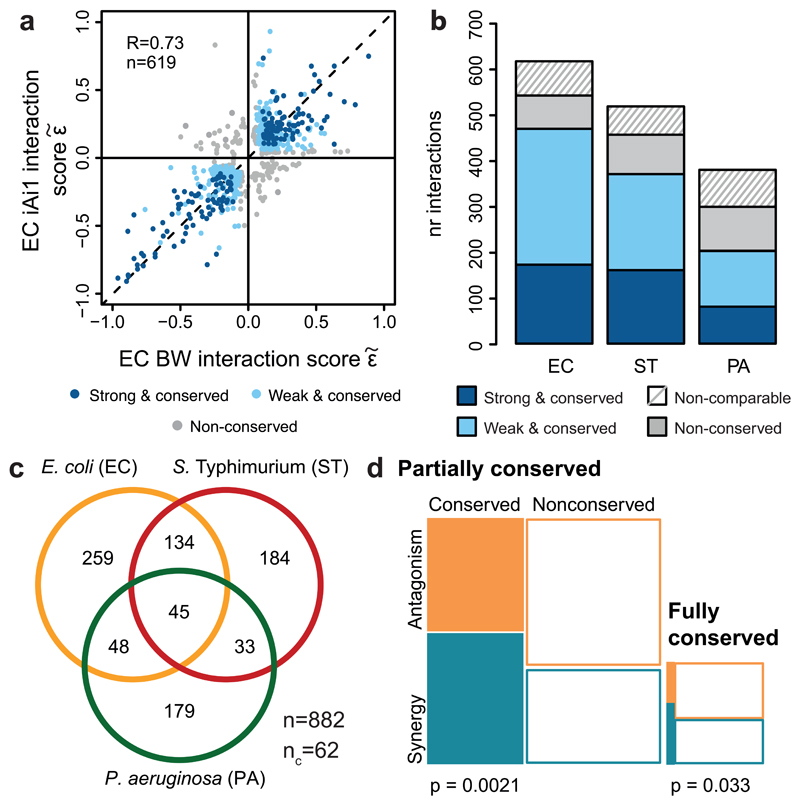
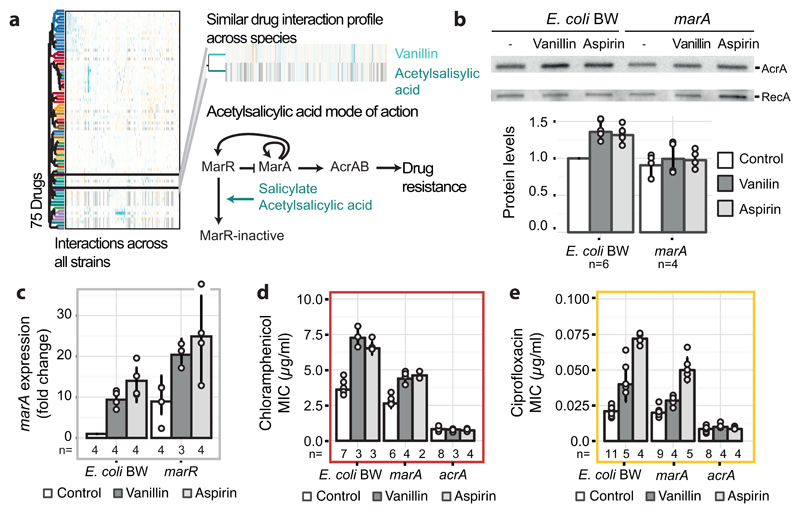
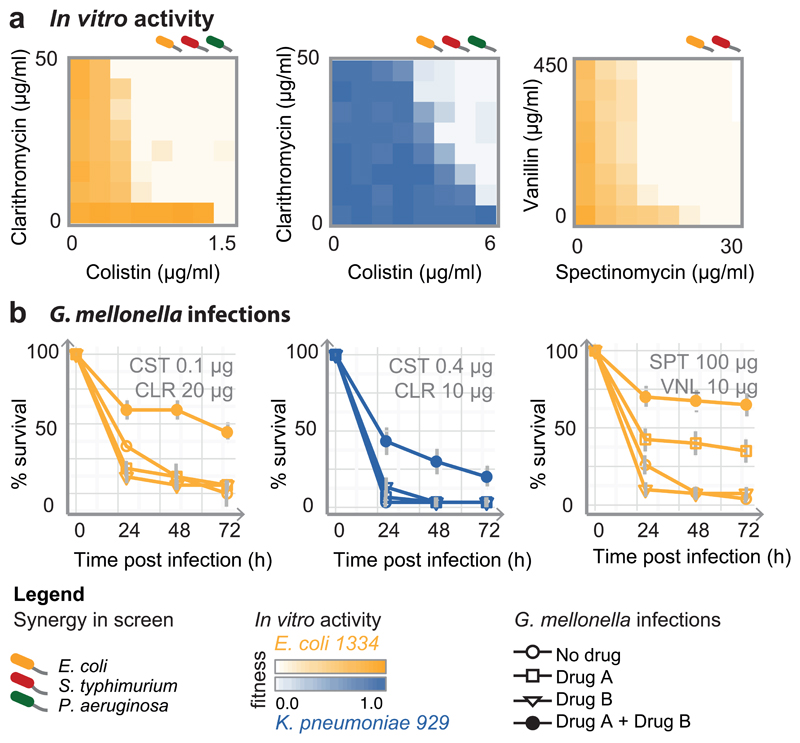
The spread of antimicrobial resistance has become a serious public health concern, making once-treatable diseases deadly again and undermining the achievements of modern medicine1,2. Drug combinations can help to fight multi-drug-resistant bacterial infections, yet they are largely unexplored and rarely used in clinics. Here we profile almost 3,000 dose-resolved combinations of antibiotics, human-targeted drugs and food additives in six strains from three Gram-negative pathogens-Escherichia coli, Salmonella enterica serovar Typhimurium and Pseudomonas aeruginosa-to identify general principles for antibacterial drug combinations and understand their potential. Despite the phylogenetic relatedness of the three species, more than 70% of the drug-drug interactions that we detected are species-specific and 20% display strain specificity, revealing a large potential for narrow-spectrum therapies. Overall, antagonisms are more common than synergies and occur almost exclusively between drugs that target different cellular processes, whereas synergies are more conserved and are enriched in drugs that target the same process. We provide mechanistic insights into this dichotomy and further dissect the interactions of the food additive vanillin. Finally, we demonstrate that several synergies are effective against multi-drug-resistant clinical isolates in vitro and during infections of the larvae of the greater wax moth Galleria mellonella, with one reverting resistance to the last-resort antibiotic colistin.


Figures

Extended Data Figure 1
Extended Data Figure 1. High-throughput profiling of pairwise drug combinations in Gram-negative bacteria.
a) Drug and species selection for screen. The 79 drugs used in the combinatorial screen are grouped to categories (Supplementary Table 1). Antibacterials are grouped by target with the exception of antibiotic classes for which enough representatives were screened (>2) to form a separate category: β-lactams, macrolides, tetracyclines, fluoroquinolones and aminoglycosides. Classification of human-targeted drugs and food additives is not further refined, because the MoA is unclear for most. A subset of 62 arrayed drugs was profiled against the complete set of 79 drugs in 6 strains. Strains are color coded according to species. Strain colors and abbreviations are used in all main and ED figures. b) Quantification of drug-drug interactions. Growth was profiled by measuring optical density (OD595nm) over time in the presence of no, single and both drugs. Interactions were defined according to Bliss independence. Significantly lower or higher fitness than expectation (fx*fy) indicates synergy or antagonism, respectively. Synergy and antagonism were assessed by growth in 4x4 checkerboards (Methods).
Extended Data Figure 2
Extended Data Figure 2. Data analysis pipeline.
a) Flowchart of the data analysis pipeline. b) Estimating single drug fitness of arrayed drugs. As drug-drug interactions are rare, the slope of the line of best fit between gaq (growth with double drug) and gq (growth with query drug alone – deduced from average of the top 5% growing wells across plates within a batch) across np query drugs (plates) corresponds to a proxy of the fitness of the arrayed drug alone, fa (Methods, Eq 3). R denotes the Pearson correlation coefficient between gaq and gq across np plates. Well A9 from E. coli BW25113 containing 3µg/ml spectinomycin is shown as an example of arrayed drugs with several interactions; several query drugs (plates) deviate from the expected fitness (light grey points), therefore only half of the plates corresponding to the interquartile range of gag/gq were used to estimate fa. c) Density distributions of quartiles 1, 2 and 3 of Bliss scores (ε) distributions for E. coli. Q1, Q2 and Q3 denote the median of quartiles 1, 2 and 3 of ε distributions, respectively. n denotes the number of drug combinations used.
Extended Data Figure 3
Extended Data Figure 3. Data quality control.
a) High replicate correlation for single and double drug treatments. Transparent boxplots contain Pearson correlation coefficients between plates of the same batch containing arrayed drugs only (LB was used instead of the second drug). n represents the total number of correlations. Full boxplots contain Pearson correlation coefficients between double drug replicate wells within the same plate, across all plates. n represents the number of wells used for correlation, nmax = (62 drugs + 1 LB) x 3 concentrations = 189. Only wells with median growth above 0.1 were taken into account for this correlation analysis (see panel b). For all box plots the center line, limits, whiskers and points correspond to the median, upper and lower quartiles, 1.5x IQR and outliers, respectively. b) Wells with lower median growth have lower replicate correlation. The double drug correlation coefficients used to generate the boxplot from a are plotted as a function of the median growth of all wells across all plates for E. coli iAi1. Wells with overall lower growth (due to strong inhibition of arrayed drug) are less reproducible due to a combination of the lower spread of growth values and the sigmoidal nature of the drug dose response curves. c) Drug-drug interactions are rare. Density distributions of all Bliss scores (ε) obtained per strain. d) The ability to detect synergies and antagonisms depends on the effects of single drug treatments. Bliss scores (ε) are plotted as function of expected fitness (fx*fy) for all drug concentration ratios for all combinations in E. coli BW (example). Boxplots summarizing both variables are shown besides the axes (n=99,907 Bliss scores, center line, limits, whiskers and points correspond to the median, upper and lower quartiles, 1.5x IQR and outliers, respectively). Blind spots for detecting antagonism and synergy are indicated; they are both based on the expected fitness (see also ED Fig. 4c-d) and thus dependent on the growth of the strain with the single drugs. The number of drug combinations falling in the blind spot for antagonism is larger, due to the number of drugs used in the screen that do not inhibit E. coli on their own. e) Scatter plot of number of interactions per drug versus the minimum fitness of the drug alone (as obtained in screen, Supplementary Table 1). Strong and weak interactions are represented. n denotes the total number of interactions and R is the Pearson correlation coefficient. Strains are color coded as above. f) Density distributions of the number of interactions per drug for all strains.
Extended Data Figure 4
Extended Data Figure 4. Benchmarking & sensitivity analysis.
a) Validation set is enriched in synergies and antagonisms to assess better true and false positives. Comparison of the interaction fractions between the screen and validation set. Both strong and weak interactions (Fig. 2b) are accounted for the screen tally. b) Number of benchmarked interactions per strain. c & d) Sensitivity analysis of the statistical thresholds for calling interactions. c) Total amount of interactions as function of the expected fitness (fx*fy) cutoff used for restricting the ε distributions to relevant drug concentrations. Strong drug-drug interactions are classified according to the ε distribution where they were significant: complete distribution only (i.e. all expected fitness wells), relevant wells only (i.e. all wells with fx*fy > cutoff for synergies and all wells with fx*fy < (1-cutoff) for antagonisms), or in both. Weak drug-drug interactions are independently assigned and represented in white. We selected an expected fitness cutoff of 0.2, as it resulted in the largest number of total interactions detected, with the highest precision and recall (91 and 74% respectively) after benchmarking against the validation dataset. d) Receiver operating characteristic (ROC) curve for the screen across different p-value thresholds (two-sided permutation test of Wilcoxon rank-sum) as a unique criterion for assigning interactions. The selected p-value (0.05) for screen threshold is indicated by a grey cross. Sensitivity to additional parameters for calling hits is shown: allowing interactions to be either antagonisms or synergies but not both (1-sided); strong and weak interaction thresholds. True and false positive rates were estimated based on the validation dataset. Precision and recall for the final and best performing set of parameters are shown: one-sided interactions, p < 0.05, fx*fy cutoff = 0.2 and |ε|>0.1 for strong interactions, |ε| > 0.06 for weak interactions. TP, TN, FP and FN stand for True Positives, True Negatives, False Positives and False Negatives, respectively. n indicates the total number of benchmarked drug combinations (Supplementary Table 3). e) Synergies between β-lactams according to Loewe additivity interaction model. The results of 8x8 checkerboards for 3 combinations between β-lactams in 4 strains are shown. The grey line in each plot represents null hypothesis in the Loewe additivity model, whereas the black line corresponds to the IC50 isobole, estimated by fitting a logistic curve to the interpolated drug concentrations (colored dots, Methods). Piperacillin did not reach 50% growth inhibition in E. coli, thus IC20 and IC40 isoboles were used for the amoxicillin + piperacillin combination in E. coli BW and E. coli iAi1, respectively.
Extended Data Figure 5
Extended Data Figure 5. Benchmarking of non-comparable drug-drug interactions.
a) The barplot illustrates the division of benchmarked drug combinations according to their degree of conservation within species. The pie chart shows the proportion of False & True Positive (FP & TP) and False and True Negatives (FN & TN) within non-comparable drug-drug interactions. b) Combination of amoxicillin with cefotaxime in P. aeruginosa: an example of a non-comparable drug-drug interaction. The results of the screen are presented on the upper box. Bliss scores as function of expected fitness for both strains are presented on the left hand side, while a density distribution of the Bliss scores is shown on the right hand side. n denotes the total number of Bliss scores, Q1 and Q3 indicate the Bliss score for quartiles 1 and 3, respectively. Antagonism was detected only for PAO1 (Q3 > 0.1). PA14 was resistant to both drugs at concentrations screened (upper left panel), rendering the detection of antagonism impossible. The benchmarking results indicate that interaction is antagonistic in both strains (lower box), albeit weaker at PA14 and visible mostly at higher concentrations. Color on checkerboard reflects fitness and black dots correspond to drug-ratios where the Bliss score is above 0.1.
Extended Data Figure 6
Extended Data Figure 6. Benchmarking of weak conserved drug-drug interactions.
a) The barplot illustrates the division of benchmarked drug combinations as in ED Fig. 5a. The pie chart shows the proportion False Positives (FP) and True Positives (TP) within weak conserved interactions. b) Combination of doxycycline with amikacin in S. Typhimurium: an example of a weak conserved drug-drug interaction. The results of the screen are presented on the upper box. Bliss scores as function of expected fitness for both strains are presented on the left hand side, while a density distribution of the Bliss scores is shown on the right hand side. n denotes the total number of Bliss scores, Q1 and Q3 indicate the Bliss score for quartiles 1 and 3, respectively. A strong synergy was detected only for ST14028 (Q1 < -0.1), and then a weak conserved synergy was assigned afterwards to ST LT2 (Q1 < -0.06). The benchmarking results, presented on the box below, confirm that the interaction is synergistic in both strains. Color on checkerboard reflects fitness and black dots correspond to drug-ratios where the Bliss score is below -0.1.
Extended Data Figure 7
Extended Data Figure 7. Salmonella and Pseudomonas drug-drug interaction networks.
a & b) Drug category interaction networks. Nodes represent drug categories according to ED Fig. 1a, and plotted as in Fig. 1b. Conserved interactions, including weak conserved, are shown here. One of the most well-known and broadly used synergies is that of aminoglycosides and β-lactams . Consistent with its use against P. aeruginosa in clinics, we detected multiple strong synergies between specific members of the two antibiotic classes in P. aeruginosa, but fewer interactions in the other two species. c & d) Drug-drug interactions across cellular processes. Representation as in a & b, but drug categories targeting the same general cellular process are grouped here. e) Quantification of synergy and antagonism in the networks from a & b, and the corresponding Chi-squared test p-value. As in E. coli, antagonism occurs more frequently than synergy and almost exclusively between drugs belonging to different categories in S. Typhimurium and P. aeruginosa. In P. aeruginosa, there are very few interactions occurring between drugs of the same category.
Extended Data Figure 8
Extended Data Figure 8. Drug antagonisms are often due to decrease in intracellular drug concentrations.
a) Cartoon of possible MoAs for drug-drug interactions that function via modulation of the intracellular drug concentration. A drug (antagonist; blue) inhibits the uptake or promotes the efflux of another one (black), and thus decreases its intracellular concentration. b) Different antagonists (see methods for concentrations) of gentamicin (red – 5 µg/ml) and ciprofloxacin (gold – 2.5 µg/ml) identified in our screen for E. coli BW also rescue the killing effect of the two bactericidal drugs in the same strain or its parental MG1655 (top right and top left panel, respectively). With the exception of clindamycin (for gentamicin) and curcumin (for ciprofloxacin) all other antagonists decrease the intracellular concentration of their interacting drug (bottom panels) – gentamicin detected by using radiolabeled compound and ciprofloxacin with LC-MS/MS (Methods). The degree of rescue (upper panel) in many cases follows the decrease of intracellular concentration (lower panel), implying that most of these interactions depend at least partially on modulating the intracellular concentration of the antagonized drug. c) Antagonisms are resolved in E. coli BW mutants lacking key components controlling the intracellular concentration of the antagonized drug. Aminoglycosides depend on PMF-energized uptake and thus respiratory complexes ,; ciprofloxacin is effluxed by AcrAB-TolC ,. For gentamicin, most interactions are resolved when respiration is defected, even the one with clindamycin (not modulating intracellular gentamicin concentration- panel b) presumably because MoA and import of aminoglycosides are linked in a positive feedback loop ,. For ciprofloxacin, antagonisms with paraquat and caffeine are resolved in the ΔacrA mutant, implying that both compounds induce the AcrAB-TolC pump (known for paraquat). In contrast, interactions with curcumin, benzalkonium and doxycycline remain largely intact in the ΔacrA mutant. The first interaction is expected as curcumin does not modulate intracellular ciprofloxacin concentration (see panel b). In the other two cases, other component(s) besides AcrAB-TolC may be responsible for the altered ciprofloxacin import/export; for example, ciprofloxacin uses OmpF to enter the cell . Ciprofloxacin and gentamicin concentrations were adjusted in all strains according to MIC (70% and 100% MIC for ciprofloxacin and gentamicin, respectively; all drug concentrations are listed in Supplementary Table 6). Bliss interaction scores (ε) were calculated as in screen. Barplots and error bars in c & d represent the average and standard deviation, respectively, across n independent biological replicates. d) Gentamicin and ciprofloxacin antagonism networks for E. coli BW. Nodes represent drugs colored according to targeted cellular process (as ED Fig. 1a). Full and dashed edges represent antagonistic drug-drug interactions for which intracellular antibiotic concentration was and was not measured, respectively. Drug interactions that result in decreased intracellular concentration of the antagonized drug are represented by black edges. e) Quantification of antagonistic drug-drug interactions from the networks in (d). The bars for fluoroquinolones and aminoglycosides account for an extrapolation of antagonistic interactions to all other members of the two classes, assuming they behave the same as ciprofloxacin and gentamicin, respectively.
Extended Data Figure 9
Extended Data Figure 9. Drug-drug interactions are largely conserved within species and only partially MoA-driven.
a & b) Drug-drug interactions are conserved in S. Typhimurium (a) and P. aeruginosa (b). Scatter plot of interaction scores in the two strains of each species; only significant interactions for at least one strain are shown. Colors and grouping as in Fig. 2a. R denotes the Pearson correlation and n the total number interactions plotted. Lower correlation in P. aeruginosa is presumably due to fewer and weaker interactions in total. c) Drug interaction profiles are phylogeny-driven. Clustering of strains based on Pearson correlation of their drug interaction profiles (taking into account all pairwise drug combinations; n=2759-2883, depending on the species). Strains of the same species cluster together, with the two enterobacterial species, E. coli and S. Typhimurium, behaving more similar to each other than to the phylogenetically more distant P. aeruginosa. d) Conserved drug-drug interaction network. Nodes represent individual drugs grouped and colored by targeted cellular process (as in ED Fig. 1a). Drug names are represented by 3 letter codes (Supplementary Table 1). Dashed and full edges correspond to conserved interactions between two or three species, respectively. Many of the human-targeted drugs, such as loperamide, verapamil and procaine exhibit a general potentiating effect, similar to that of membrane-targeting drugs. This suggests that they may also facilitate drug uptake or impair efflux, consistent with previous reports on the role of loperamide in E. coli and verapamil in Mycobacterium tuberculosis ,. e) Monochromaticity between all drug categories. The monochromaticity index (MI) reflects whether interactions between drugs of two categories are more synergistic (MI=-1) or antagonistic (MI=1) than the background proportion of synergy and antagonism. MI equals zero when interactions between two drug categories have the same proportion of synergy and antagonism as all interactions together. (Methods). MI was calculated using all interactions from the 6 strains for all category pairs that had at least 2 interactions. White cells in the heat map correspond to category pairs for which no (or an insufficient number of) interactions were observed. f) Human-targeted drugs, and LPS or PMF inhibitors are strong and promiscuous adjuvants. Density distributions of the MIs per drug category from panel e are shown. n denotes the amount of drugs in category involved in i interactions.
Extended Data Figure 10
Extended Data Figure 10. Hierarchical clustering of drugs according to their interaction profiles.
Rows depict the 75 drugs common to all strains (colored according to drug category – ED Fig. 1a), and columns account for their interactions with other drugs in all six strains tested. Clustering was done using the median of the ε distributions, uncentered correlation and average linkage.
Extended Data Figure 11
Extended Data Figure 11. Active synergies against Gram-negative MDR clinical isolates in vitro and in G. mellonella infection model.
Both human-targeted drugs (lately found to have an extended impact on bacteria 51) and food additives can promote the action of antibiotics in MDR strains, indicating that their use as antibacterial adjuvants should be explored further in the future. a) Drug combinations active against MDR E. coli and K. pneumoniae clinical isolates (related to Fig. 4). Interactions are shown as 8x8 checkerboards and synergies have a black bold border. Drug pairs are the same per line and indicated at the first checkerboard. The species in which the interaction was detected in the screen are indicated after the last checkerboard. Concentrations increase on equal steps per drug (see legend); only minimal and maximal concentrations are shown for the first strain of each species. Apart from colistin, the same concentration ranges were used for all E. coli and K. pneumoniae MDR strains. One of two replicates is shown. b) Drug synergies against the same MDR strains in the Galleria mellonella infection model. Larvae were infected by E. coli and K. pneumoniae MDR isolates (106 and 104 CFU, respectively) and left untreated, or treated with single drugs or in combination. % larvae survival was monitored at indicated intervals after infection – n=10 larvae per treatment. The averages of 4 biological replicates are plotted; error bars depict standard deviation.
Extended Data Figure 12
Extended Data Figure 12. Mode of Action for the vanillin-spectinomycin synergy.
a) Spectinomycin MIC decreases upon addition of 100 µg/ml vanillin in the wildtype E. coli BW, as well as single-gene knockouts of members of the AcrAB-TolC efflux pump or its MarA regulator. Thus, the vanillin-spectinomycin synergy is independent of the effect of vanillin on AcrAB-TolC (Fig. 3). b) Synergy is specific to vanillin-spectinomycin, as spectinomycin is antagonized by 500 µg/ml of the vanillin-related compound, aspirin, thereby increasing the MIC ~3-fold. c) Profiling the vanillin-spectinomycin combination in the E. coli BW Keio collection to deconvolute its MoA. Violin plots of the drug-drug interaction scores ε of all mutants (n=9216; Methods) are presented for the vanillin-spectinomycin combination (synergy) and as control, for the combination of vanillin with another aminoglycoside, amikacin (antagonism). The interaction scores of the two mdfA deletion clones present in the Keio library are indicated by red dots. The vanillin-spectinomycin synergy is lost in the absence of mdfA, whereas the vanillin-amikacin antagonism remains unaffected, indicating that the vanillin-spectinomycin synergy depends specifically on MdfA. d) Deletion of mdfA leads to increased spectinomycin MIC and abolishes the synergy with vanillin, independent of the presence or absence of AcrAB-TolC. Mild overexpression of mdfA from a plasmid (pmdfA - methods) further enhances the synergy with vanillin, decreasing the spectinomycin MIC by ~2-fold (compared to the MIC of the combination in the wildtype). Thus, MdfA levels are directly correlated to the degree of the spectinomycin-vanillin synergy. e) Overexpression of mdfA leads to increased spectinomycin sensitivity, even though MIC does not change. The growth of E. coli BW and pmdfA was measured (OD595nm after 8h) over 2-fold serial dilutions of spectinomycin and normalized to the no-drug growth of the corresponding strain (white and black dots represent the average of n=3 independent biological replicates, error bars represent standard deviation). Spectinomycin dose response was computed using a logistic fit of the averaged data points (MICs are calculated by fitting individual replicates first and then averaging). Fitted curves are represented by full and dashed lines for pmdfA and E. coli BW respectively. f) Vanillin leads to accumulation of spectinomycin in the cell in an mdfA-dependent manner. Intracellular spectinomycin is measured with the tritiated compound (Methods). Barplots and error bars in a, b, d & f represent the average and standard deviation, respectively, across n independent biological replicates.
Figure 1
Figure 1. Principles of drug-drug interaction networks.
a) Antagonism is more prevalent than synergy. Fraction of observed over detectable interactions for the 6 strains. We detect more antagonistic (1354) than synergistic (1230) interactions, although our ability to detect antagonisms is lower than synergy: 12,778 versus 16,920 combinations. b & d) Drug-drug interaction networks in E. coli. Nodes represent either drug categories (b) or drugs grouped according to the general cellular process they target (d). Node color is as ED Fig. 1a and node size reflects the number of drugs within category. Edges represent synergy (blue) and antagonism (orange); thickness reflects number of interactions. Interactions between drugs of the same category/general cellular target are represented by self-interacting edges. Conserved interactions, including weak, are shown. c & e) Antagonisms occur almost exclusively between drugs belonging to different categories (c) or targeting different cellular processes (e), whereas synergies are also abundant between drugs within the same category (c) or targeting the same process (e). Quantification and Chi-squared test p-values from E. coli drug-drug interactions are shown in b and d, respectively.
Figure 2
Figure 2. Drug-drug interaction conservation.
a) Drug-drug interactions are conserved in E. coli. Scatter plot of interaction scores from the two E. coli strains; significant interactions for at least one of the strains are shown. Dark blue: strong and conserved interactions in both strains; light blue: strong interactions in one strain and concordant behavior in other (weak and conserved); grey: interactions occurring exclusively in one strain or conflicting between strains (non-conserved). R denotes the Pearson correlation, n the number interactions plotted. b) Drug-drug interactions are highly conserved within species. Colors as in a; non-comparable refers to combinations that have significantly different single drug dose responses between strains (Methods). c) Drug-drug interactions are largely species-specific; n = total number of interactions; nc = conflicting interactions between species, not accounted for in Venn diagram. d) Synergies are more conserved than antagonisms. Mosaic plots and Chi-squared test p-values show the quantification of synergy and antagonism among conserved (fully and partially) and non-conserved interactions between species.
Figure 3
Figure 3. Vanillin induces a multi-antibiotic-resistance (mar) phenotype.
a) Vanillin and aspirin (acetylsalicylic acid) have similar drug-drug interaction profiles (see ED Fig. 10), suggesting similar MoA’s. A schematic representation of the mar response induction via deactivation of the MarR repressor by salicylate/aspirin is illustrated. b) Vanillin increases AcrA levels in a marA-dependent manner. A representative immunoblot of exponentially growing cells (all blots shown in Supplementary Fig. 1) after treatment with solvent, vanillin (150µg/ml) or aspirin (500µg/ml) is shown - loading controlled by cell density and constitutively expressed RecA. Barplots depict AcrA protein level quantification; c) marA expression levels upon vanillin (150µg/ml) or aspirin (500µg/ml) treatment are stronger in wildtype than in ΔmarR mutant. Expression is measured by RT-qPCR and normalized to no-drug treatment in wildtype; d & e) Vanillin (150 µg/ml) and aspirin (500µg/ml) increase the MIC of chloramphenicol (d) or ciprofloxacin (e). Antagonism is weaker and abolished in ΔmarA and ΔacrA mutants, respectively. n = number of independent biological replicates and error bars depict standard deviation (b-e).
Figure 4
Figure 4. Potent synergistic combinations against Gram-negative MDR clinical isolates.
a) In vitro synergies, shown as 8x8 checkerboards, for 3 MDR strains (more strains and synergies in ED Fig. 11). One of two biological replicates is shown. b) Drug synergies against the same MDR strains in the Galleria mellonella infection model (see also ED Fig. 11). Larvae were infected by E. coli and K. pneumoniae MDR isolates (106 and 104 CFU, respectively) and left untreated, or treated with single drugs or combination. % larvae survival was monitored at indicated intervals after infection – n=10 larvae per treatment. The average of 4 biological replicates are shown; error bars depict standard deviation.

Similar articles

Cited by

References

    1. Draft political declaration of the high-level meeting of the United Nations General Assembly on antimicrobial resistance. 2016 ( http://www.un.org/pga/71/2016/09/21/press-release-hl-meeting-on-antimicr...)
    1. Brown ED, Wright GD. Antibacterial drug discovery in the resistance era. Nature. 2016;529:336–343. doi: 10.1038/nature17042. - DOI - PubMed
    1. Tacconelli E, et al. Discovery, research, and development of new antibiotics: the WHO priority list of antibiotic-resistant bacteria and tuberculosis. Lancet Infect Dis. 2018;18:318–327. doi: 10.1016/S1473-3099(17)30753-3. - DOI - PubMed
    1. Ejim L, et al. Combinations of antibiotics and nonantibiotic drugs enhance antimicrobial efficacy. Nat Chem Biol. 2011;7:348–350. doi: 10.1038/nchembio.559. - DOI - PubMed
    1. Brown D. Antibiotic resistance breakers: can repurposed drugs fill the antibiotic discovery void? Nat Rev Drug Discov. 2015;14:821–832. doi: 10.1038/nrd4675. - DOI - PubMed

Publication types

MeSH terms