. 2018 Jun 19:12:156.
doi: 10.3389/fncel.2018.00156. eCollection 2018.

Electrical Synapses Enhance and Accelerate Interneuron Recruitment in Response to Coincident and Sequential Excitation

Affiliations

Electrical Synapses Enhance and Accelerate Interneuron Recruitment in Response to Coincident and Sequential Excitation

Pepe Alcami. Front Cell Neurosci. .

Abstract

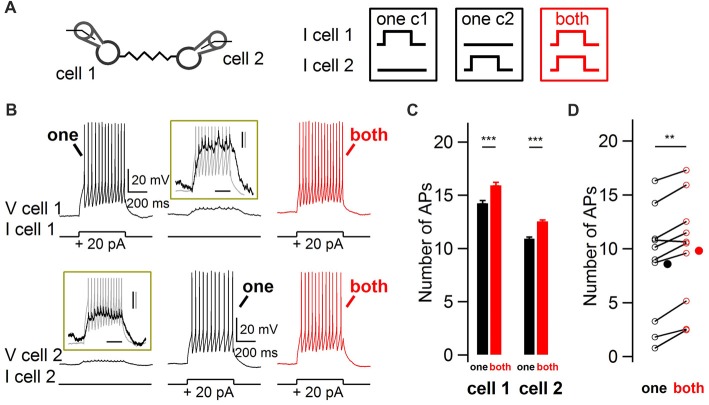
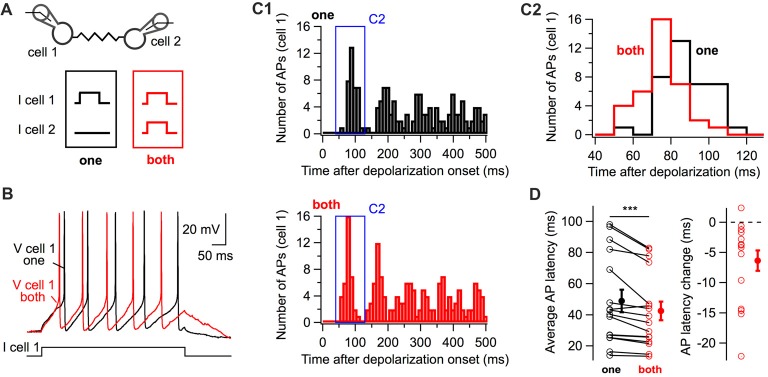
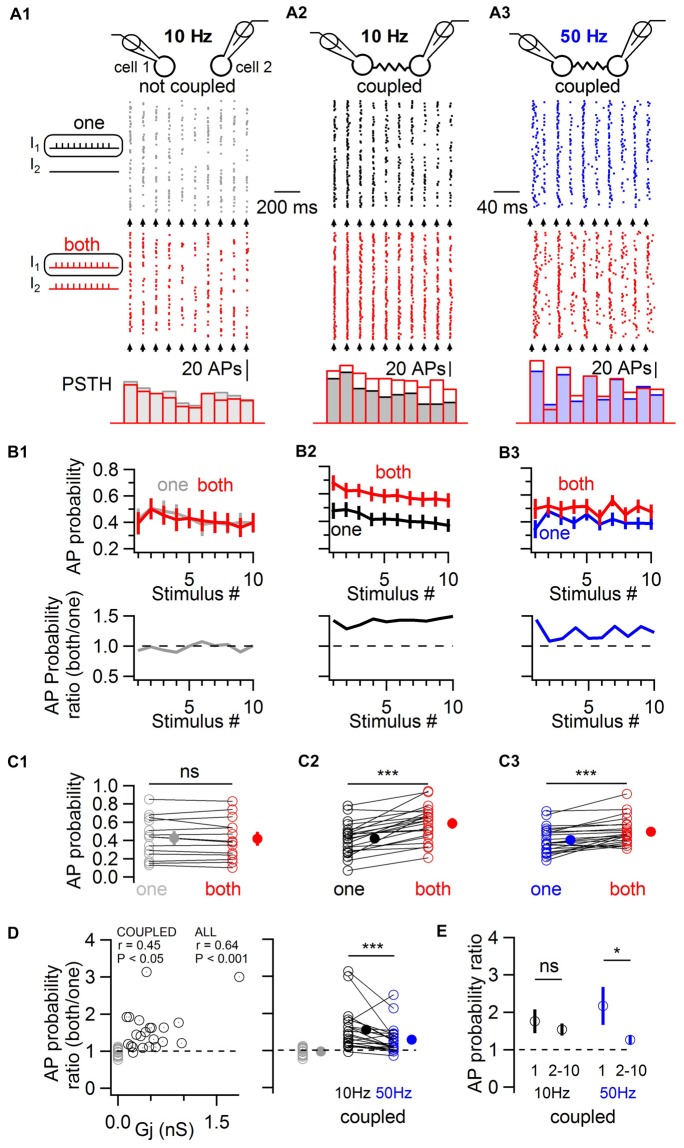
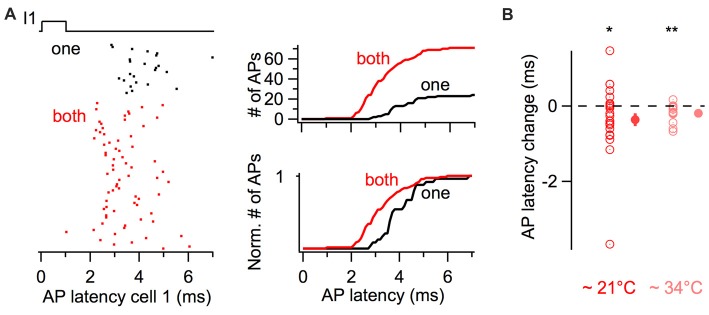
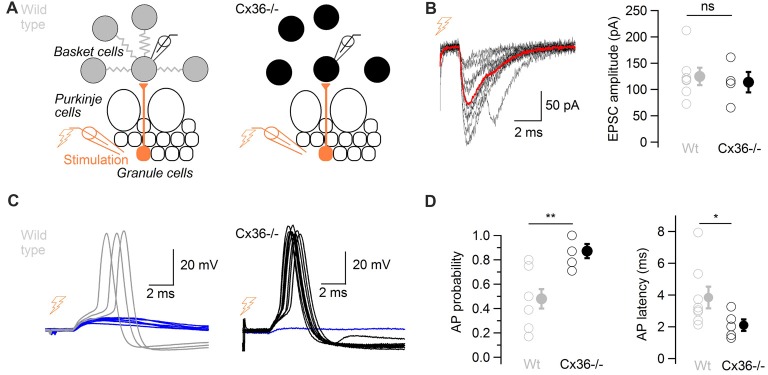
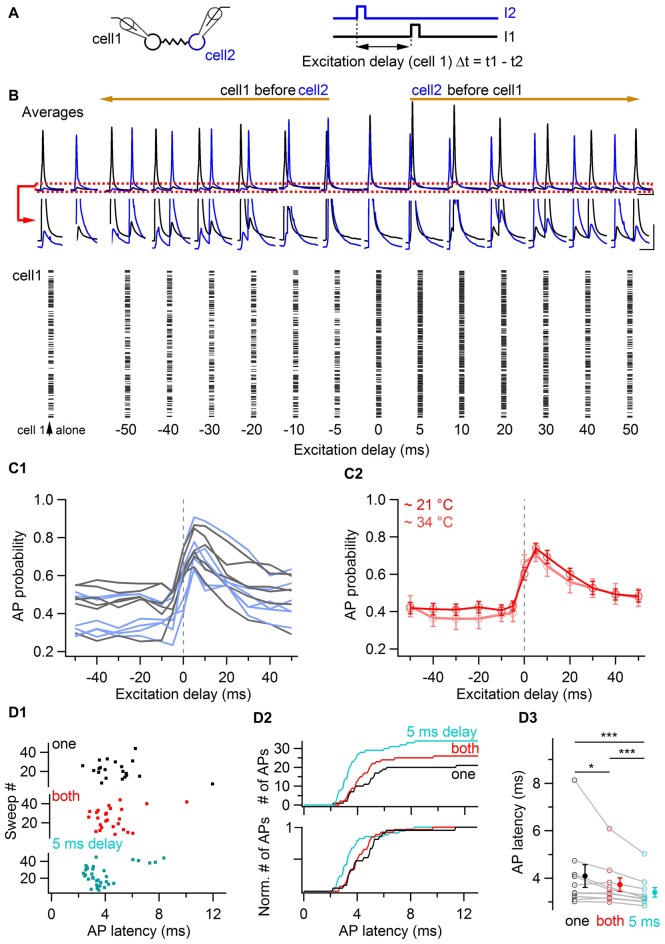
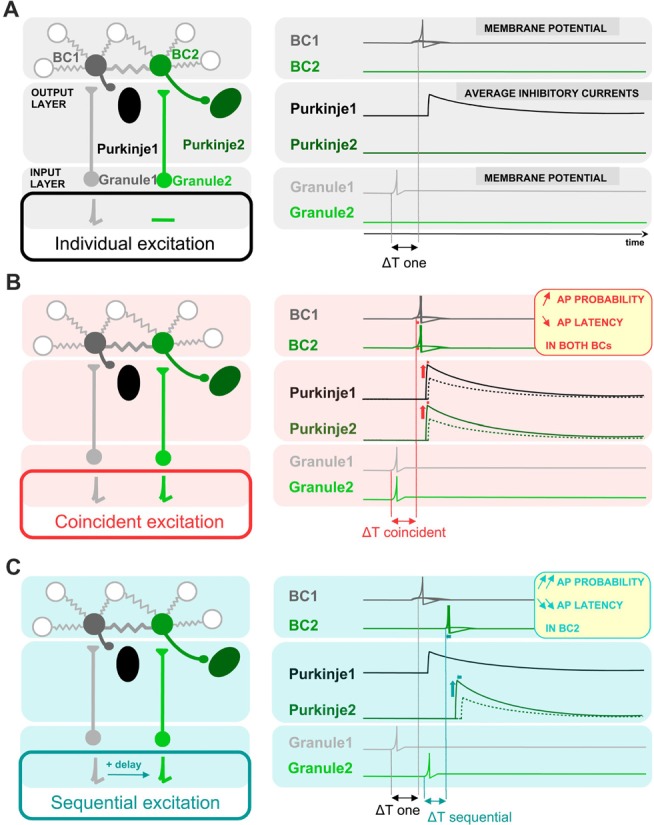
Electrical synapses are ubiquitous in interneuron networks. They form intercellular pathways, allowing electrical currents to leak between coupled interneurons. I explored the impact of electrical coupling on the integration of excitatory signals and on the coincidence detection abilities of electrically-coupled cerebellar basket cells (BCs). In order to do so, I quantified the influence of electrical coupling on the rate, the probability and the latency at which BCs generate action potentials when stimulated. The long-lasting simultaneous suprathreshold depolarization of a coupled cell evoked an increase in firing rate and a shortening of action potential latency in a reference basket cell, compared to its depolarization alone. Likewise, the action potential probability of coupled cells was strongly increased when they were simultaneously stimulated with trains of short-duration near-threshold current pulses (mimicking the activation of presynaptic granule cells) at 10 Hz, and to a lesser extent at 50 Hz, an effect that was absent in non-coupled cells. Moreover, action potential probability was increased and action potential latency was shortened in response to synaptic stimulations in mice lacking the protein that forms gap junctions between BCs, connexin36, relative to wild-type (WT) controls. These results suggest that electrical synapses between BCs decrease the probability and increase the latency of stimulus-triggered action potentials, both effects being reverted upon simultaneous excitation of coupled cells. Interestingly, varying the delay at which coupled cells are stimulated revealed that the probability and the speed of action potential generation are facilitated maximally when a basket cell is stimulated shortly after a coupled cell. These findings suggest that electrically-coupled interneurons behave as coincidence and sequence detectors that dynamically regulate the latency and the strength of inhibition onto postsynaptic targets depending on the degree of input synchrony in the coupled interneuron network.

Keywords: cerebellum; coincidence; gap junction; inhibition; interneurons; synaptic integration.


Figures

Figure 1
Figure 1
Impact of coincidence detection by electrical synapses (ESs) on basket cell (BC) firing rate. (A) Two electrically-coupled BCs were recorded in current-clamp mode. Five-hundred millisecond duration 20 pA current pulses were injected in one cell (“one”, black) or simultaneously in both cells (“both”, red). (B) Increase in BC firing rate when both BCs were simultaneously depolarized. Representative membrane potential recordings from two simultaneously-recorded electrically-coupled BCS at membrane potentials of ~−70 mV. Top traces, cell 1. Bottom traces, cell 2. Insets enlarge the subthreshold depolarizations induced by the current injection in the other cell, shown in gray. Scale bars, 200 ms, 2 mV (black) and 10 mV (gray). (C) Average increase (±SEM) in the number of action potentials (APs) from cells shown in (B) when their electrically-coupled partner was simultaneously injected with a depolarizing current pulse (Wilcoxon-Mann-Whitney (WMW) test, ***P < 0.001). (D) Summary results for 10 cells showing the average increase in the number of action potentials when an electrically-coupled cell was simultaneously depolarized (Wilcoxon Signed-Rank (WSR) test, **P < 0.01). Open symbols, individual cells and filled symbols, average values.
Figure 2
Figure 2
The simultaneous depolarization of a BC regulates the latency of action potential generation in an electrically-coupled BC. (A) Two BCs were recorded in current-clamp mode. Five-hundred millisecond 10 or 20 pA current pulses were injected in one cell (“one” in black) or in both cells (“both” in red) simultaneously. (B) Representative membrane potential traces from cell 1 (“one”, black, “both”, red). (C) Peri-stimulus time histogram (PSTH) computed from all trials for the cell in (B) showing the shortening of action potential latency when both cells are stimulated (C1). The time-window of the PSTH contributed by the first action potential is enlarged in (C2). The distribution of latencies is shifted towards lower values when both cells are simultaneously depolarized. (D) Summary data showing the decrease in the latency of the first action potential triggered by the positive current injection when an electrically-coupled cell is simultaneously depolarized (WSR test, ***P < 0.001). Open symbols represent individual cells and filled symbols average values ± SEM. Left, average AP latencies. Right, change in the latency of the first action potential generated (latency when both cells were depolarized subtracted by the latency when cells were individually depolarized).
Figure 3
Figure 3
Electrically-coupled BCs detect coincident short pulses in a frequency-dependent manner. (A) Short current pulses of 1 ms in duration were applied individually to only one cell (“one”, gray, black and blue traces in A1–A3, respectively) or to both cells simultaneously (“both”, red traces in A1–A3). A train of ten current pulses at 10 Hz was injected in non coupled cells (A1), in coupled cells (A2), and at 50 Hz in coupled cells (A3). Top, diagram of the recorded cells. Middle, raster plots of action potentials recorded in one of the two cells stimulated alone (top raster plot) or coincidentally with another cell (bottom raster plot). Bottom, corresponding PSTH for each condition. The timing at which current pulses were injected is indicated by arrows. (B) Top, summary results (mean ± SEM) showing the average action potential probability evoked by each current pulse in the train in response to individual (“one”) or simultaneous (“both”) depolarizations in 14 control cells (B1) and 22 coupled cells (B2,B3). Bottom, ratio of average action potential probability (average action potential probability when both cells are stimulated divided by the average action potential probability when individual cells are stimulated). (C) Summary results comparing the average action potential probability for individual cells in response to the 10 independent and simultaneous stimuli (open symbols), and average ± SEM (filled symbols). WSR test, ns P > 0.05 for non-coupled cells in (C1), ***P < 0.001 in (C2,C3). (D) Left, the individual ratio of action potential probability correlates with the junctional conductance (Gj) between recorded cells. Coupled cells are represented by black circles and non-coupled cells, by gray circles. Right, average action potential probability ratios are larger in response to 10 Hz than to 50 Hz stimulation. WSR test, ***P < 0.001. (E) Action potential probability ratio (±SEM) in response to the first and to subsequent stimuli in the train (stimulus number 2–10) showing short term depression in the facilitation of firing in response to coincident excitation at 50 Hz (WSR test, *P < 0.05) but not at 10 Hz (WSR test, ns P > 0.05).
Figure 4
Figure 4
Simultaneous short-duration current pulses decrease action potential latency. (A) Action potential latency decrease in response to a 1 ms long current injection in a cell when a coupled cell was simultaneously stimulated (“both” in red), relative to a current injection in only the reference cell (“one” in black). Left, raster plot of action potentials showing a larger number and shorter latency of evoked action potentials. Right, cumulative histograms of action potential latency from the same cell. Top, cumulative histograms. Bottom, normalized cumulative histograms. (B) Summary results showing the average decrease in action potential latency when current pulses were injected in both cells at room temperature (n = 22 cells) and at near-physiological temperature (n = 14 cells). WSR test, *P < 0.05, **P < 0.01. Open symbols, individual experiments; filled symbols, mean ± SEM.
Figure 5
Figure 5
ESs control the probability and the latency of action potentials in response to glutamatergic inputs. (A) Diagram showing the position of the stimulation and recording electrodes. The granule cell layer was stimulated extracellularly, evoking glutamatergic synaptic events in a BC recorded in whole-cell configuration in wild type (WT; left) and in Cx36−/− mice (right). (B) Left, 10 evoked excitatory postsynaptic currents (EPSCs) recorded in voltage-clamp in one BC (failures not shown), average in red. Traces were aligned to EPSC onset. Right, summary data comparing recorded EPSC amplitudes in WT and Cx36−/− mice. Amplitudes did not differ (n = 4 Cx36−/−, n = 7 WT cells, WMW test, ns P > 0.05). Open symbols, individual experiments; filled symbols, average ± SEM. (C) EPSPs trigger action potentials with higher probability and shorter latency in Cx36−/− mice. Representative membrane potential recordings of a BC in response to granule cell stimulation in a WT mouse (left) and in a Cx36−/− mouse (right) at −59 ± 1 mV. Traces have been aligned to EPSP onset, 10 synaptic stimulations shown for each condition. (D) Summary results showing the increase in action potential probability in response to granule cell layer stimulation (left, n = 5 Cx36−/−, n = 8 WT cells, WMW test, **P < 0.01) and the decrease in action potential latency (right, WMW test, *P < 0.05) in Cx36−/− mice. Open symbols, individual experiments; filled symbols, average ± SEM.
Figure 6
Figure 6
Coincidence and sequence detection by electrically-coupled BCs. (A) Two electrically-coupled cells were stimulated by a 3 ms duration current pulse with a delay Δt. The stimulus delay varied between −50 ms and +50 ms. (B) Top, average voltage traces recorded from two representative cells showing the increase of BC membrane voltage of both cells when they were excited at null and positive delays after a coupled cell. The red box is enlarged. Scale bars, 2 mV and 40 ms. Bottom, raster plot from a cell showing an increase in the number of action potentials when it is excited at null and positive delays after a coupled cell. (C1) Summary data representing the action potential probability of each cell as a function of the excitation delay relative to an electrically-coupled cell (gray and light blue traces corresponding to cell 1 and cell 2 from each coupled pair respectively, 12 cells from six pairs). The average action potential probability computed for all cells is shown in (C2), in red at room temperature (12 cells) and in pink at near-physiological temperature (10 cells). Data represent mean ± SEM. (D) Action potential latency at physiological temperatures in response to independent (black), coincidental (red) and sequential excitation (turquoise). (D1) Raster plot for independent, simultaneous and delayed current injections in a reference cell (origin of x-axis is the onset of current injection in the cell). (D2) Cumulative histogram of action potential latency for independent (black), simultaneous (red) and delayed stimulation (turquoise) showing an increased number and a decreased latency of action potentials in response to simultaneous and delayed stimulations. (D3) Summary plot showing the average latency of action potentials in the three conditions. WSR test, *P < 0.05; ***P < 0.001 Open symbols, 10 individual experiments; filled symbols, mean ± SEM.
Figure 7
Figure 7
Schematic representation of the proposed impact of ESs between BCs on the average latency and amplitude of inhibition of postsynaptic Purkinje cells. Schematic drawing showing a simplified representation of the cells presynaptic and postsynaptic to BCs (left), and the activity of BCs and the inhibition of Purkinje cells in response to granule cell-mediated stimulation of BCs (right). BCs receive excitatory glutamatergic inputs from granule cells and they themselves inhibit postsynaptic Purkinje cells. Two circuits formed by one granule cell, one BC and one Purkinje cell are shown next to each other, and connected by ESs between the two BCs. Three different patterns of presynaptic granule cell activity are illustrated in (A–C): independent excitation of granule cells (A, only granule cell 1 is stimulated), simultaneous excitation of both granule cells (B) and sequential excitation of granule cell 2 after granule cell 1 (C). The network of coupled BCs is larger than two cells, as represented by the additional coupled gray BCs in the network. (A) In response to the excitation of granule cell 1, BC1 is excited with a given probability that EPSPs trigger APs, evoking an inhibitory current in its postsynaptic Purkinje cell (Purkinje cell 1) with a given average amplitude. (B) The simultaneous excitation of BCs by simultaneously-active granule cells evokes an increase in action potential probability and a decrease in action potential latency in BCs, and thereby an increase in the average inhibitory current received by both Purkinje cell 1 and Purkinje cell 2 and a decrease in its latency from granule excitation, relative to the inhibition that they would receive if only one BC was depolarized. Dotted line, voltage trace when cells are excited individually. (C) In the scenario of a sequential activation of BCs, only the inhibitory current evoked by BC2, the BC activated sequentially after its electrically-coupled BC, is changed relative to (A): the action potential of BC2 takes place with an even shorter latency and higher probability than in (B). In contrast, the first BC to be excited, BC1, has the same action potential probability and latency as in (A), and therefore the average current evoked by the first BC to be excited does not change its amplitude nor its latency.

Similar articles

Cited by

References

    1. Alcami P., Marty A. (2013). Estimating functional connectivity in an electrically coupled interneuron network. Proc. Natl. Acad. Sci. U S A 110, E4798–E4807. 10.1073/pnas.1310983110 - DOI - PMC - PubMed
    1. Amsalem O., Van Geit W., Muller E., Markram H., Segev I. (2016). From neuron biophysics to orientation selectivity in electrically coupled networks of neocortical L2/3 large basket cells. Cereb. Cortex 26, 3655–3668. 10.1093/cercor/bhw166 - DOI - PMC - PubMed
    1. Barbour B. (1993). Synaptic currents evoked in Purkinje cells by stimulating individual granule cells. Neuron 11, 759–769. 10.1016/0896-6273(93)90085-6 - DOI - PubMed
    1. Bargmann C. I., Marder E. (2013). From the connectome to brain function. Nat. Methods 10, 483–490. 10.1038/nmeth.2451 - DOI - PubMed
    1. Bartos M., Vida I., Frotscher M., Meyer A., Monyer H., Geiger J. R., et al. . (2002). Fast synaptic inhibition promotes synchronized β oscillations in hippocampal interneuron networks. Proc. Natl. Acad. Sci. U S A 99, 13222–13227. 10.1073/pnas.192233099 - DOI - PMC - PubMed

LinkOut - more resources