. 2018 Jun 20:9:1384.
doi: 10.3389/fimmu.2018.01384. eCollection 2018.

Induction of Hypergammaglobulinemia and Autoantibodies by Salmonella Infection in MyD88-Deficient Mice

Affiliations

Induction of Hypergammaglobulinemia and Autoantibodies by Salmonella Infection in MyD88-Deficient Mice

Jincy M Issac et al. Front Immunol. .

Abstract

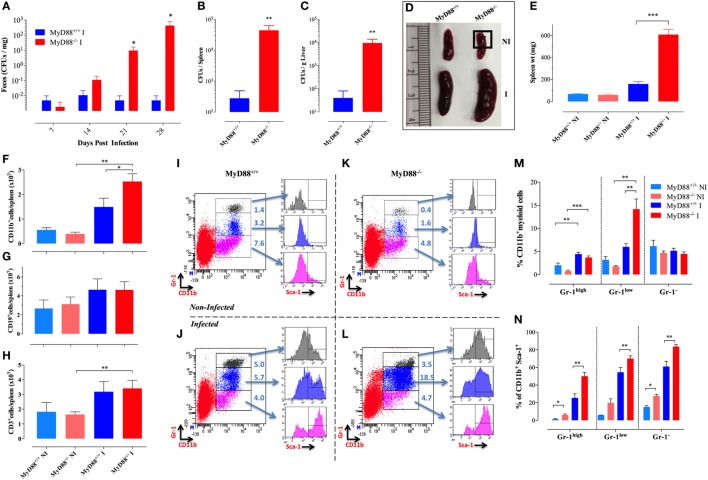
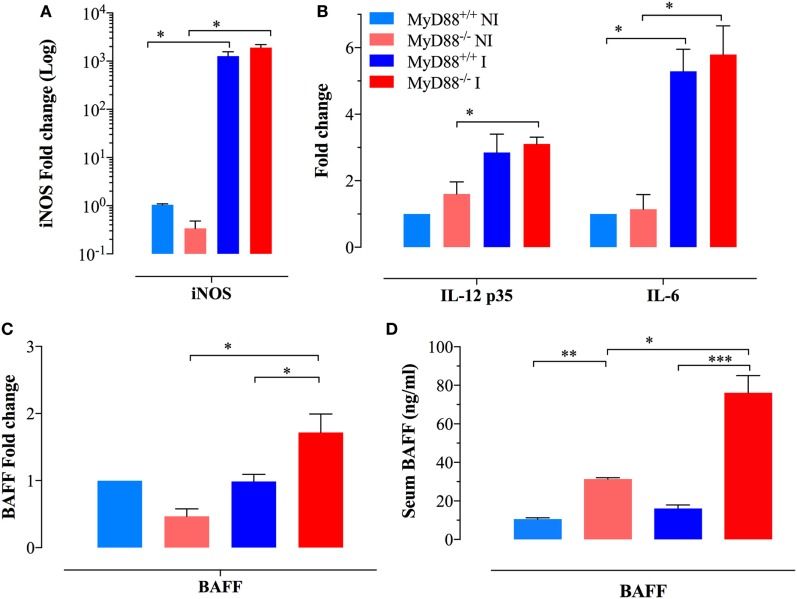
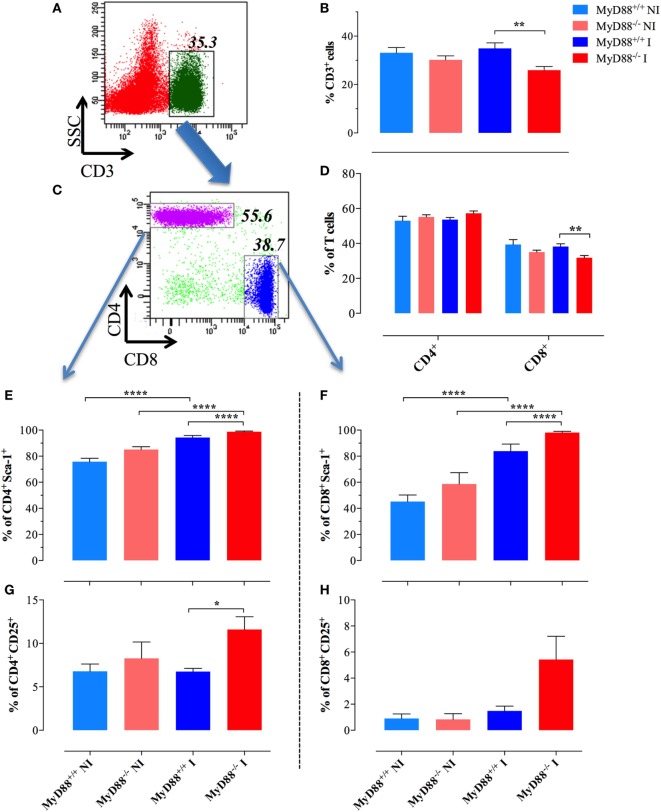
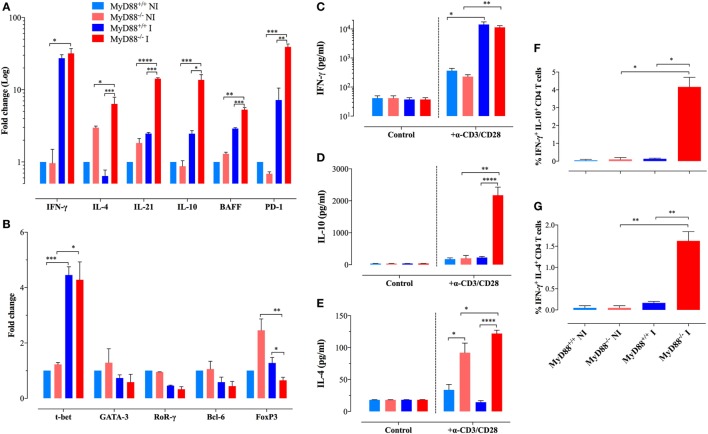
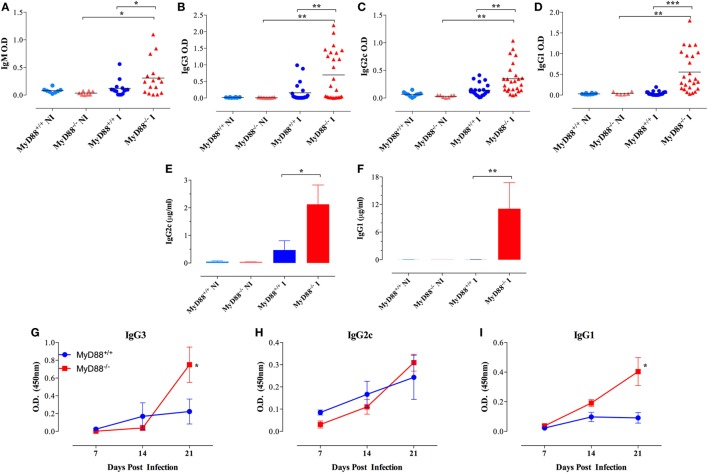
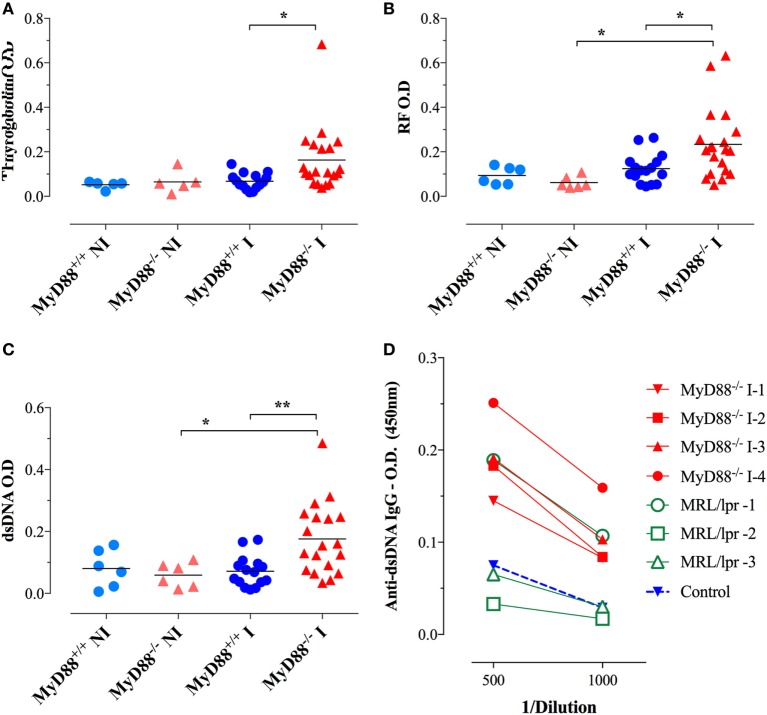
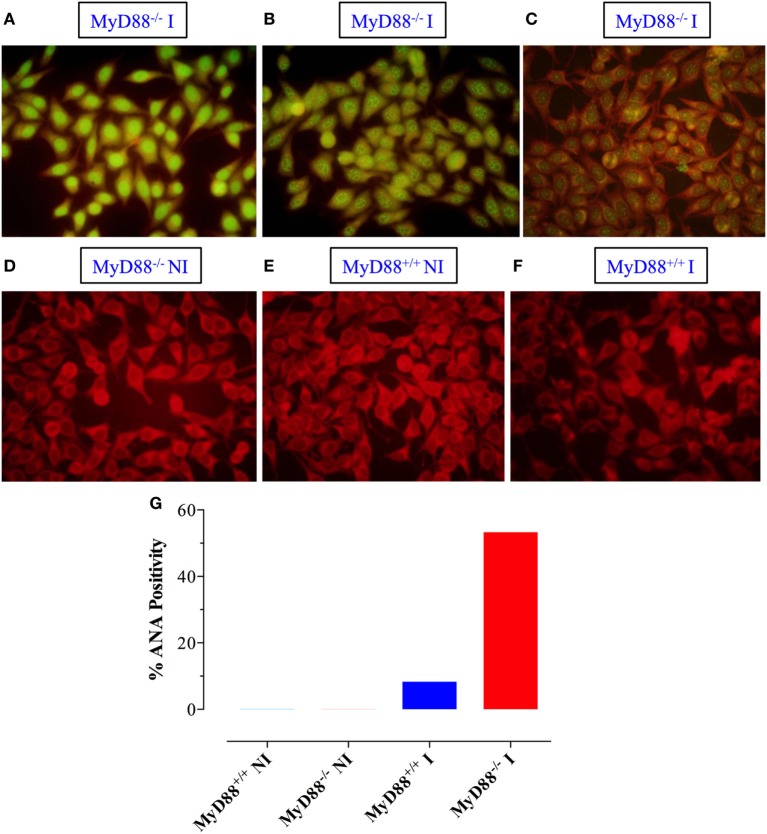
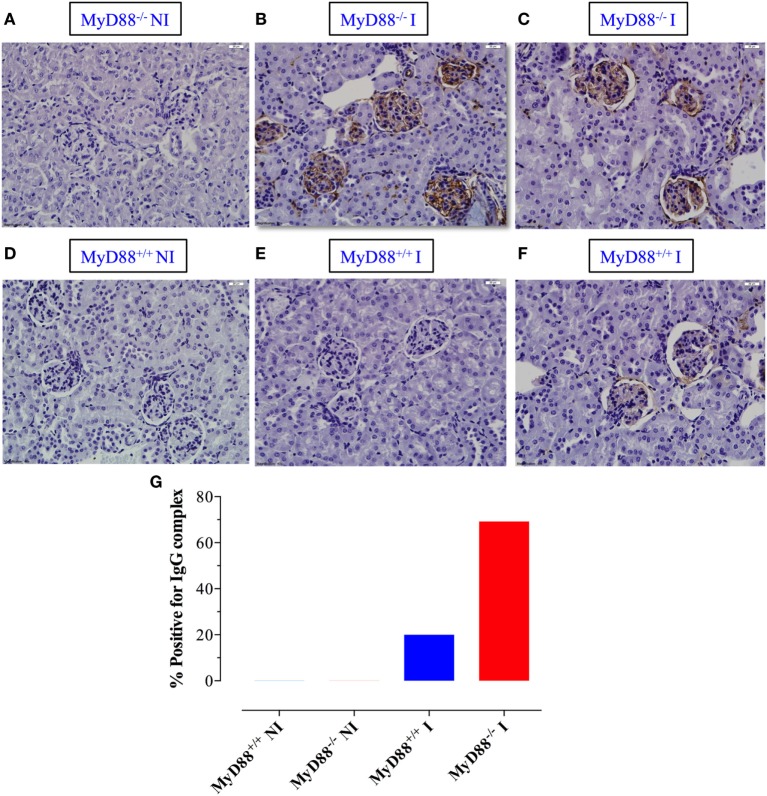
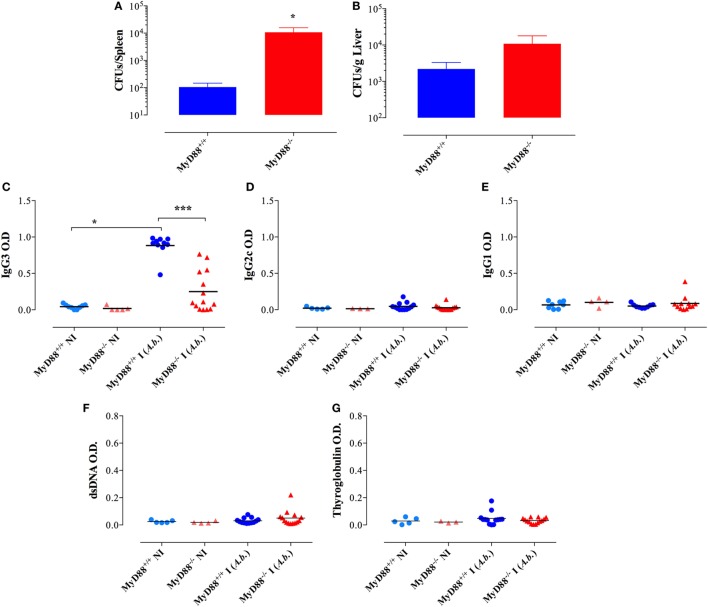
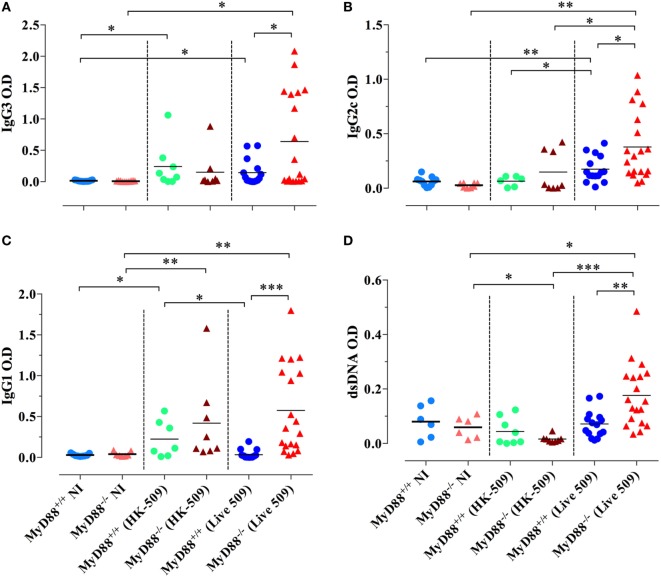
Growing evidence indicates a link between persistent infections and the development of autoimmune diseases. For instance, the inability to control Salmonella infection due to defective toll-like receptor (TLR)/myeloid differentiation primary response 88 (MyD88) signaling has linked the development of persistent infections to a breakdown in B cell tolerance. However, the extent of immune dysregulation in the absence of TLR-MyD88 signaling remains poorly characterized. Here, we show that MyD88-/- mice are unable to eliminate attenuated Salmonella enterica serovar Typhimurium, even when challenged with a low-dose inoculum (200 CFUs/mouse), developing a persistent and progressive infection when compared to wild-type (MyD88+/+) animals. The splenic niche of MyD88-/- mice revealed increased counts of activated, Sca-1-positive, myeloid subpopulations highly expressing BAFF during persistent Salmonella infection. Likewise, the T cell compartment of Salmonella-infected MyD88-/- mice showed increased levels of CD4+ and CD8+ T cells expressing Sca-1 and CD25 and producing elevated amounts of IL-4, IL-10, and IL-21 in response to CD3/CD28 stimulation. This was associated with increased Tfh cell differentiation and the presence of CD4+ T cells co-expressing IFN-γ/IL-4 and IFN-γ/IL-10. Noteworthy, infected MyD88-/- mice had enhanced serum titers of both anti-Salmonella antibodies as well as autoantibodies directed against double-stranded DNA, thyroglobulin, and IgG rheumatoid factor, positive nuclear staining with HEp-2 cells, and immune complex deposition in the kidneys of MyD88-/- mice infected with live but not heat-killed Salmonella. Infection with other microorganisms (Acinetobacter baumanii, Streptococcus agalactiae, or Escherichia coli) was unable to trigger the autoimmune phenomenon. Our findings suggest that dysregulation of the immune response in the absence of MyD88 is pathogen-dependent and highlight potentially important genotype-environmental factor correlations.

Keywords: MyD88 deficiency; Salmonella typhiumrium; Tfh cells; autoantibodies; hypergammaglobulinemia.


Figures

Figure 1
Figure 1
Splenomegaly and inflammatory myeloid cell influx in Salmonella-infected MyD88−/− mice. (A–C) WT (MyD88+/+) and MyD88−/− mice were infected i.p. with BRD509 (200 CFUs/mouse). Bacterial shedding in the feces was followed for 4 weeks (A). Bacterial loads in spleen (B) and liver (C) at day 28 postinfection are shown. (D,E) Mice were infected with BRD509 (3,000 CFUs/mouse) and sacrificed at day 21. (D) Spleens of non-infected (NI) and infected (I) groups are shown. (E) Spleen weights of the different experimental groups. Each data point represents the mean ± SEM of 6–10 mice per group. (F–H) Absolute cell counts of CD11b+ myeloid cells (F), CD19+ B lymphocytes (G) and CD3+ T lymphocytes (H) per spleen. (I–N) Flow cytometric analysis of splenic myeloid cells and activation status. Splenocytes of NI (I,K) or Salmonella-infected (J,L) MyD88+/+ (I,J) or MyD88−/− (K,L) mice were analyzed for CD11b and Gr-1 positivity. Based on Gr-1 expression levels, three distinct CD11b+ populations could be discerned, CD11b+Gr-1high (top panel), CD11b+Gr-1low (middle panel), and CD11b+Gr-1 (bottom panel). Each of these subpopulations was further analyzed for the expression of Sca-1 activation marker. Results of individual mice are shown. (M) Percentage of CD11b+ cells expressing high, low, or negative levels of Gr-1 protein in NI or BRD509-infected MyD88+/+ or MyD88−/− mice. (N) Alterations in expression of Sca-1 protein in the different myeloid subpopulations. The results are representative of at least three to four independent experiments. Asterisks denote statistically significant differences between MyD88−/− and MyD88+/+ mice (*p < 0.05; **p < 0.01; ***p < 0.001).
Figure 2
Figure 2
Analysis of cytokine gene expression and serum levels in myeloid cells. Gene expression levels of (A) inducible nitric oxide synthase (iNOS) and (B) IL-12p35 and IL-6 in CD11b+ splenic myeloid cells purified from the different experimental groups. Each data point represents the mean ± SEM of three to four mice per group. (C) Analysis of BAFF gene expression in purified myeloid cells [n = 3 for non-infected (NI) groups and n = 8 for infected groups]. Alterations in gene expression are depicted as fold-change compared to NI WT mice. (D) Analysis of systemic BAFF levels in mouse sera by ELISA. Each data point represents the mean ± SEM of three (NI) or eight (infected) mice per group. Analysis was done on whole sera or purified myeloid cells obtained from NI or Salmonella-infected mice at day 21 postinfection. Data are compiled from two independent experiments (*p < 0.05; **p < 0.01; ***p < 0.001).
Figure 3
Figure 3
Changes in splenic T lymphocyte populations following infection. A representative dot plot of non-infected (NI) WT splenocytes showing gated CD3+ T lymphocytes (A) and CD4 and CD8 subpopulations (C) within gated CD3+ cells. (B) Changes in the percent of CD3+ lymphoid cells in the whole spleen. (D) Changes in the ratios of CD4+ and CD8+ cells within the T cell populations. Analysis was done on day 21 postinfection with BRD509 (n = 4–6 for NI and 8–10 for infected groups). Changes in the percent of CD4+ (E,G) and CD8+ (F,H) T cells positive for Sca-1 (E,F) or CD25 (G,H) are shown (*p < 0.05, **p < 0.01, ***p < 0.001). The results are representative of three independent experiments.
Figure 4
Figure 4
Analysis of gene expression and cytokine production profiles in purified CD4+ T lymphocytes. (A,B) Gene expression levels of key cytokines (A) and transcription factors (B) in purified CD4+ T cells of different experimental groups were analyzed by quantitative real-time PCR (n = 3–6 per group). Alterations in gene expression are depicted as fold-change compared to non-infected (NI) WT mice. Analysis was done on CD4+ T cells purified from NI or Salmonella-infected mice at day 21 postinfection. (C–E) Secretion of IFN-γ (C), IL-10 (D), and IL-4 (E) by purified CD4+ T cells after stimulation with plate-bound anti-CD3/CD28 antibodies. Data are compiled from two independent experiments (n = 3–6 per group). (F,G) Intracellular cytokine staining of purified CD4+ T cells. The graphs depict cumulative data showing the percent of CD4+ T cells co-expressing IFN-γ plus IL-10 (F) or IFN-γ plus IL-4 cytokines (G). All determinations were done in triplicates. The data are representative of three independent experiments (*p < 0.05, **p < 0.01, ***p < 0.001, ****p < 0.0001).
Figure 5
Figure 5
Hypergammaglobulinemia in Salmonella-infected MyD88−/− mice. Mice were inoculated i.p. with BRD509 (~200 CFUs/mouse) and sera collected at 4 weeks and analyzed for the presence of Salmonella-specific IgM (A), IgG3 (B), IgG2c (C), and IgG1 (D) isotypes. Quantification of Salmonella-specific serum IgG2c (E) and IgG1 (F) antibodies in non-infected (NI) and 3-week infected (I) mice. Absolute antibody levels are expressed in micrograms per milliliter serum (n = 3–6 per group). (G–I) The kinetics of development of antibodies to Salmonella infection was evaluated during the first 3 weeks post i.p. infection with a dose of 4,000 CFUs/mouse. Salmonella-specific IgG3, IgG2c, and IgG1 were determined (n = 3–6 per group per time point). Asterisks denote statistically significant differences between MyD88−/− and MyD88+/+ mice (*p < 0.05; **p < 0.01; ***p < 0.001). Data are compiled from three independent experiments.
Figure 6
Figure 6
Autoantibody reactivity of MyD88−/− sera after systemic Salmonella infection. Sera were collected 4–6 weeks following i.p. infection with BRD509 (~200 CFUs/mouse) and tested for reactivity with thyroglobulin (A), rheumatoid factor [RF; (B)], and double-stranded DNA (dsDNA) (C) by specific ELISA. The cutoff for the detection of these autoantibodies was determined at 1/1,000 dilution. Data are compiled from three independent experiments. (D) Comparison of anti-dsDNA reactivity in sera of MRL-lpr (n = 3) and infected MyD88−/− mice (n = 4). Serum reactivity with dsDNA was done at the indicated final dilutions (1/500 to 1/1,000). Non-infected sera are represented by the “Control” group. Data are representative of two independent experiments (*p < 0.05; **p < 0.01; ***p < 0.001).
Figure 7
Figure 7
Qualitative detection of antinuclear antibodies (ANA) by immunoflurosence on HEp-2 cells. Sera from Salmonella-infected (A–C) or non-infected (NI) (D) MyD88−/− mice were incubated with HEp-2 cells, as described in Section “Materials and Methods.” Positive staining showing homogenous (A), speckled (B), and cytoplasmic (C) patterns is shown. As a control, reactivity of sera from NI (E) or infected (F) MyD88+/+ mice is also shown. The percentage of sera from the different experimental groups (n = 5–15 mice/group) that was positive for ANA is summarized in panel (G). The fluorescence was visualized at 40× magnification using an Olympus fluorescent microscope. Data are compiled from three independent experiments.
Figure 8
Figure 8
Deposition of immune complexes in Salmonella-infected MyD88−/− mice. (A–F) Kidney sections were prepared from non-infected (NI) (A,D) and infected (I) MyD88−/− (B,C) and MyD88+/+ (E,F) mice and stained with anti-IgG antibody, as described in Section “Materials and Methods” (n = 5–15 mice/group). (G) The percentage of mice whose kidney sections scored positive for the presence of immune deposits by DAB staining. Images were taken at 40× magnification. Data are compiled from three independent experiments.
Figure 9
Figure 9
No evidence for immunoglobulin dysregulation in MyD88−/− mice following infection with Acinetobacter baumanii. Two months post i.p. infection with a dose of ~1 × 105 CFUs/mouse of A. baumanii, bacterial counts in spleen (A) and liver (B) were enumerated (n = 6–7 mice/group). Serum levels of anti-Acinetobacter IgG3 (C), IgG2c (D), and IgG1 (E) isotypes. (F,G) Serum reactivity to double-stranded DNA (dsDNA) and thyroglobulin. The cutoff for the detection of these autoantibodies was determined at 1/1,000 dilution (*p < 0.05, ****p < 0.0001). Data are compiled from two independent experiments.
Figure 10
Figure 10
Absence of immunoglobulin dysregulation and autoantibodies in MyD88−/− mice following injection of heat-killed (HK) BRD509. Serum levels of Salmonella-specific IgG3 (A), IgG2c (B), and IgG1 (C) antibodies were determined at 8 weeks post i.p. inoculation of 2 × 105 HK BRD509. For comparison, antibody production in response to low dose infection with live BRD509E strain, at 3 weeks postinfection, is shown. (D) Serum reactivity to double-stranded DNA (dsDNA) in HK vs live Salmonella-infected mice. The cutoff for the detection of dsDNA was determined at 1/1,000 dilution. Data are compiled from two independent experiments (*p < 0.05; **p < 0.01; ***p < 0.001).

Similar articles

Cited by

References

    1. Janeway CA. Approaching the asymptote? Evolution and revolution in immunology. Cold Spring Harb Symp Quant Biol (1989) 54:1–13.10.1101/SQB.1989.054.01.003 - DOI - PubMed
    1. Iwasaki A, Medzhitov R. Control of adaptive immunity by the innate immune system. Nat Immunol (2015) 16(4):343–53.10.1038/ni.3123 - DOI - PMC - PubMed
    1. Loures FV, Pina A, Felonato M, Feriotti C, de Araujo EF, Calich VL. MyD88 signaling is required for efficient innate and adaptive immune responses to Paracoccidioides brasiliensis infection. Infect Immun (2011) 79(6):2470–80.10.1128/IAI.00375-10 - DOI - PMC - PubMed
    1. Vajjhala PR, Ve T, Bentham A, Stacey KJ, Kobe B. The molecular mechanisms of signaling by cooperative assembly formation in innate immunity pathways. Mol Immunol (2017) 86:23–37.10.1016/j.molimm.2017.02.012 - DOI - PubMed
    1. Akira S, Takeda K. Toll-like receptor signalling. Nat Rev Immunol (2004) 4:499–511.10.1038/nri1391 - DOI - PubMed