. 2018 Jun 20:9:1419.
doi: 10.3389/fimmu.2018.01419. eCollection 2018.

Activation of the Immune-Metabolic Receptor GPR84 Enhances Inflammation and Phagocytosis in Macrophages

Affiliations

Activation of the Immune-Metabolic Receptor GPR84 Enhances Inflammation and Phagocytosis in Macrophages

Carlota Recio et al. Front Immunol. .

Abstract

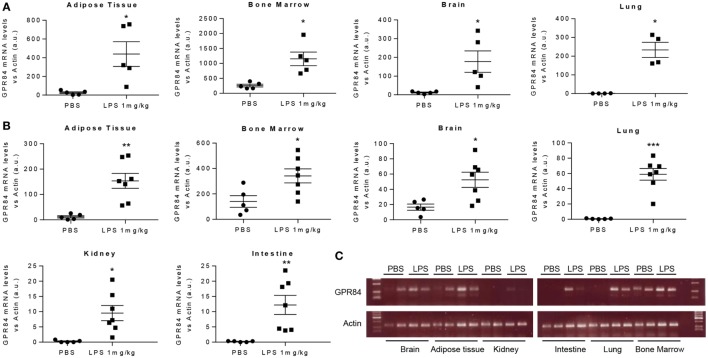
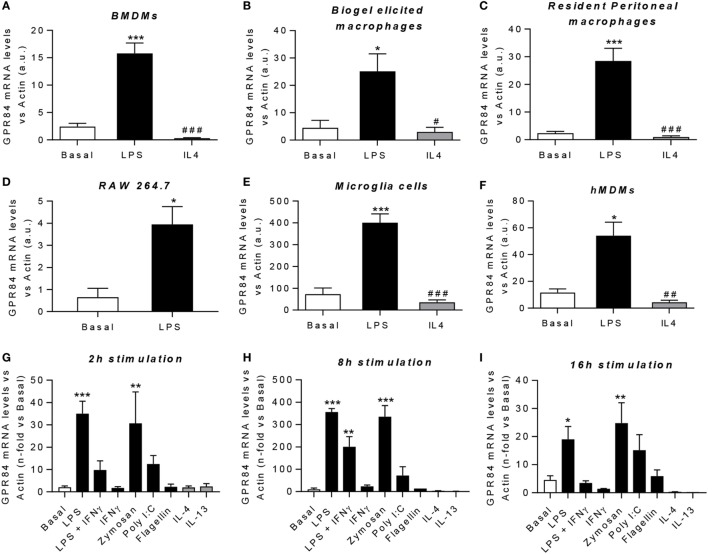
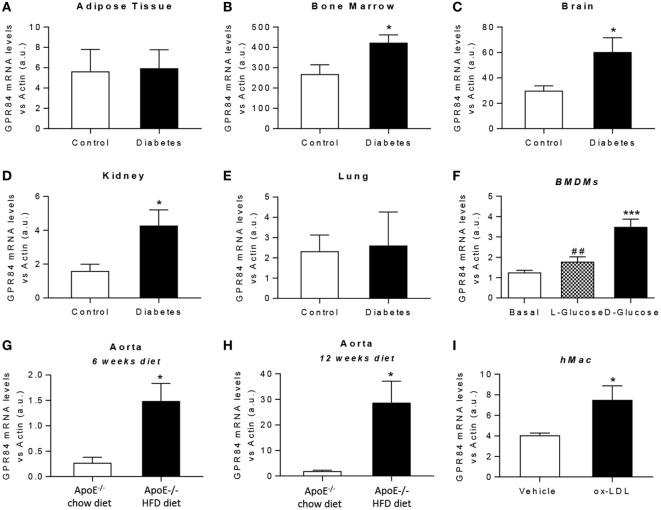
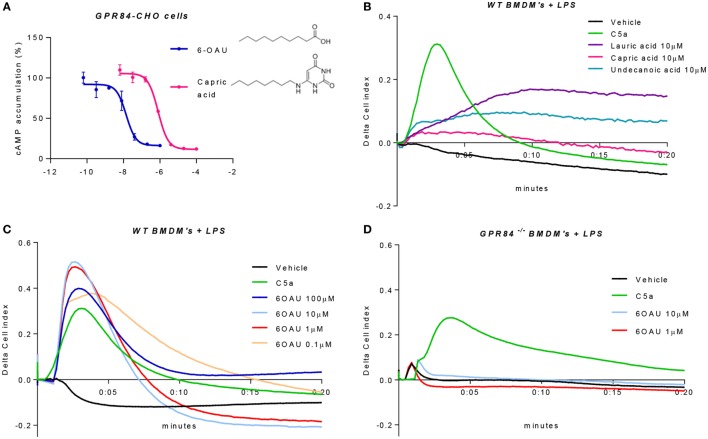
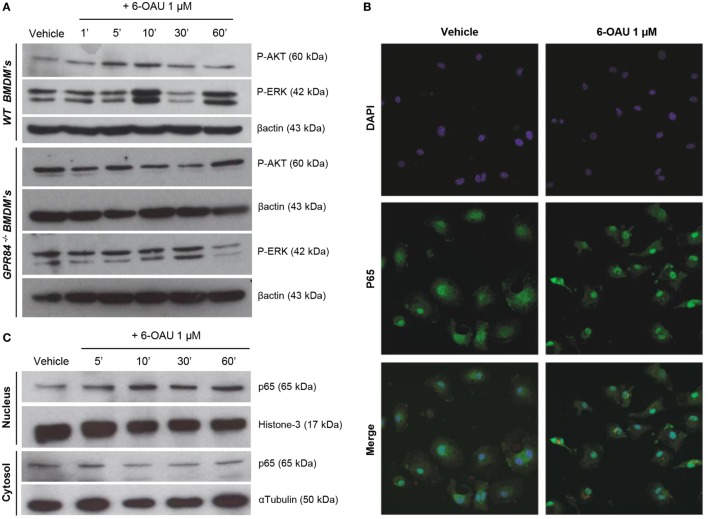
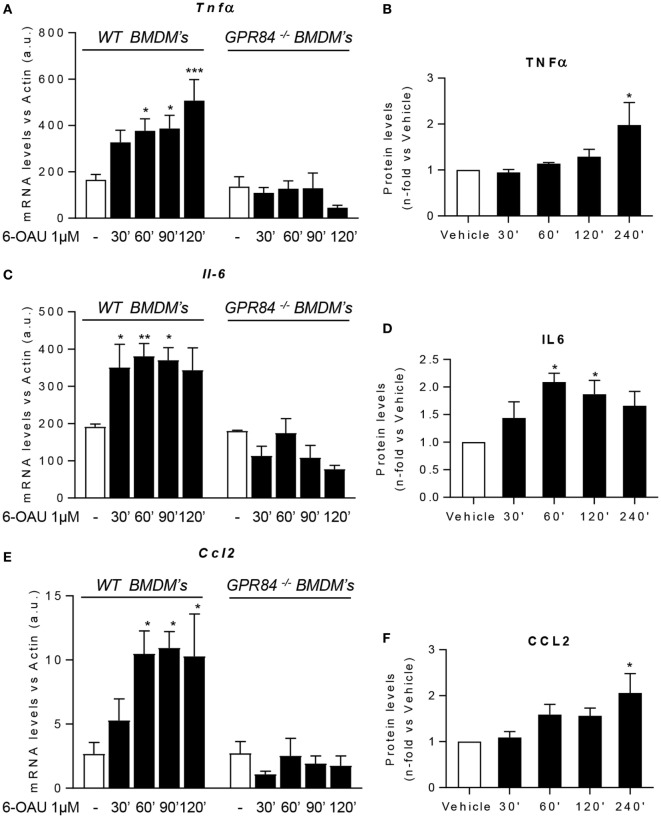
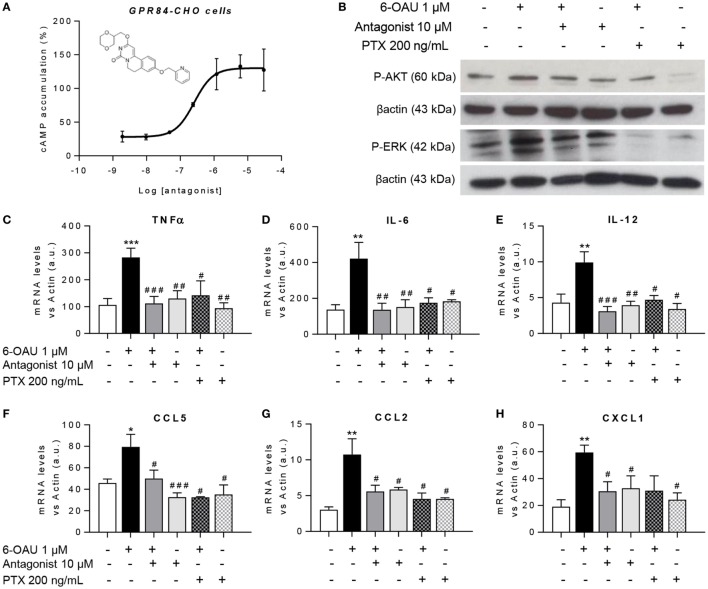
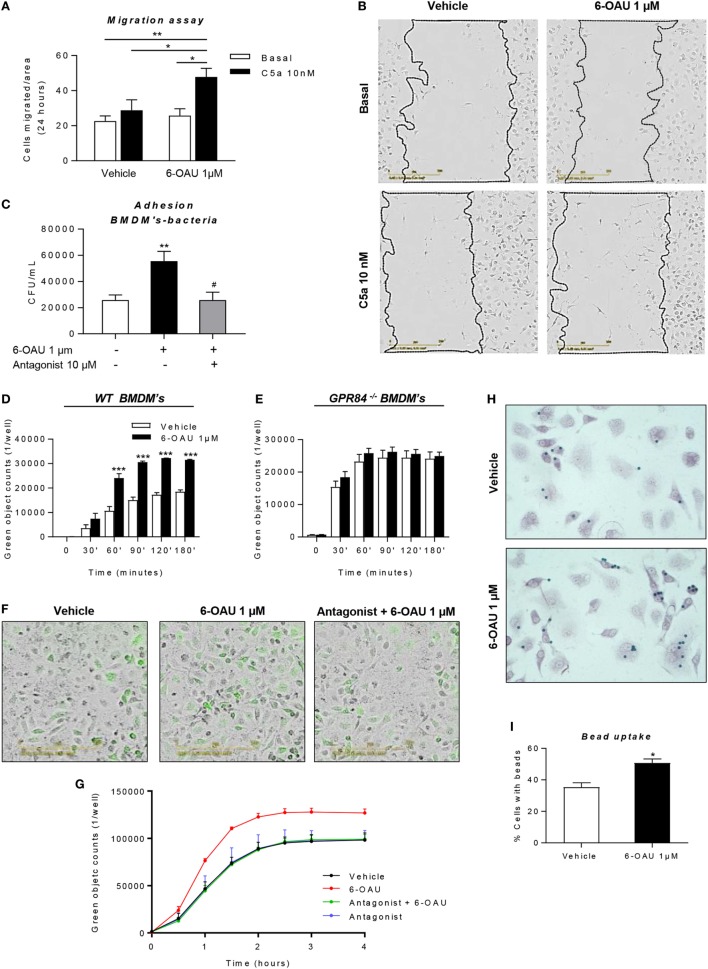
GPR84 is a member of the metabolic G protein-coupled receptor family, and its expression has been described predominantly in immune cells. GPR84 activation is involved in the inflammatory response, but the mechanisms by which it modulates inflammation have been incompletely described. In this study, we investigated GPR84 expression, activation, and function in macrophages to establish the role of the receptor during the inflammatory response. We observed that GPR84 expression in murine tissues is increased by endotoxemia, hyperglycemia, and hypercholesterolemia. Ex vivo studies revealed that GPR84 mRNA expression is increased by LPS and other pro-inflammatory molecules in different murine and human macrophage populations. Likewise, high glucose concentrations and the presence of oxidized LDL increased GPR84 expression in macrophages. Activation of the GPR84 receptor with a selective agonist, 6-(octylamino) pyrimidine-2,4(1H,3H)-dione (6-n-octylaminouracil, 6-OAU), enhanced the expression of phosphorylated Akt, p-ERK, and p65 nuclear translocation under inflammatory conditions and elevated the expression levels of the inflammatory mediators TNFα, IL-6, IL-12B, CCL2, CCL5, and CXCL1. In addition, GPR84 activation triggered increased bacterial adhesion and phagocytosis in macrophages. The enhanced inflammatory response mediated by 6-OAU was not observed in GPR84-/- cells nor in macrophages treated with a selective GPR84 antagonist. Collectively, our results reveal that GPR84 functions as an enhancer of inflammatory signaling in macrophages once inflammation is established. Therefore, molecules that antagonize the GPR84 receptor may be potential therapeutic tools in inflammatory and metabolic diseases.

Keywords: GPR84; immunometabolism; inflammation; macrophages; metabolic G protein-coupled receptors.


Figures

Figure 1
Figure 1
Gpr84 expression is increased in mouse tissues in acute inflammation. C57BL/6 male mice were injected i.p. with 0.1 mg/kg of LPS or PBS (controls). Animals were sacrificed at 2 and 8 h and Gpr84 expression was examined by q-PCR of the cDNA from mouse tissues. (A) Gpr84 mRNA levels at 2 h post PBS or LPS injection in adipose tissue, bone marrow, brain, and lung. (B) Gpr84 mRNA levels at 8 h post PBS or LPS injection in adipose tissue, bone marrow, brain, lung, kidney, and intestine. (C) Agarose gel electrophoresis of q-PCR products from mouse tissue cDNA of the 8 h endotoxemia experiment are shown. Products sizes are 139 bp for GPR84 and 72 bp for β-actin. Data presented as mean ± SEM. The number of animals is represented by dots in the graph. Statistical significance was assessed using a Student’s unpaired t-test. *P ≤ 0.05, **P ≤ 0.01, ***P ≤ 0.001 versus PBS control group.
Figure 2
Figure 2
Gpr84 expression is highly expressed by M1 pro-inflammatory macrophages. (A–F) mRNA expression of GPR84 was analyzed by q-PCR of cDNA prepared from bone marrow-derived macrophages (BMDMs) (A), biogel-elicited macrophages (B), resident peritoneal macrophages (C), RAW 264.7 cells (D), microglia cells (E), and human monocyte-derived macrophages (hMDMs) (F) challenged with either LPS or IL-4 for 16 h. (G–I) mRNA expression of GPR84 receptor was analyzed by q-PCR on BMDMs following exposure to TLR ligands and cytokines for 2 (G), 8 (H), and 16 (I) h. Error bars represent SEM of n = 2–4 separate experiments. Statistical significance was assessed using one-way ANOVA with Dunnett’s multiple comparison post hoc test. *P ≤ 0.05, **P ≤ 0.01, ***P ≤ 0.001 versus basal, #P ≤ 0.05, ##P ≤ 0.01, ###P ≤ 0.001 versus LPS.
Figure 3
Figure 3
Gpr84 expression is enhanced under hyperglycemia and hypercholesterolemia conditions. (A–E) Non-obese diabetic mice were assessed for diabetes by blood glucose test and, once diagnosed diabetic, they were sacrificed and Gpr84 expression was examined by q-PCR in the cDNA from adipose tissue (A), bone marrow (B), brain (C), kidney (D), and lung (E). Data are presented as mean ± SEM of n = 4–5 mice per group. Statistical significance was assessed using a Student’s unpaired t-test. *P ≤ 0.05 versus control group. (F) mRNA expression of GPR84 receptor was analyzed by qPCR on bone marrow-derived macrophages grown in low glucose media (5 mM) following exposure to high glucose shock (30 mM) for 4 h. Error bars represent SEM of n = 4 separate experiments. Statistical significance was assessed using one-way ANOVA with Dunnett’s multiple comparison post hoc test. *P ≤ 0.05, **P ≤ 0.01, ***P ≤ 0.001 versus basal; #P ≤ 0.05, ##P ≤ 0.01 versus d-glucose. (G,H) ApoE−/− mice were fed either high-fat diet or chow diet. Animals were sacrificed at 6 (G) and 12 (H) weeks of diet and Gpr84 expression was examined by q-PCR of cDNA prepared from aortic tissue. Data are presented as mean ± SEM of 4–5 mice per group. Statistical significance was assessed using a Student’s unpaired t-test. *P ≤ 0.05 versus ApoE−/− + chow diet. (I) mRNA expression of GPR84 receptor was analyzed by q-PCR of human monocyte-derived macrophages challenged with oxLDL for 48 h. Error bars represent SEM of n = 5 separate experiments. Statistical significance was assessed using a Student’s unpaired t-test. *P ≤ 0.05 versus vehicle.
Figure 4
Figure 4
6-OAU is a potent and specific surrogate agonist of GPR84. (A) Intracellular cyclic AMP levels were measured in CHO-GPR84 cells following forskolin stimulation and incubation with 6-OAU or capric acid. Data are represented as the mean ± SEM of the percentage of the response to forskolin in the absence of agonists from n = 3 independent experiments. (B–D) A real-time cell impedance assay was performed to measure changes in cell impedance in response to agonists. (B) Bone marrow-derived macrophages (BMDMs) (50,000 cells/well) were added 0.1 µg/ml LPS and were seeded into a 96-well E-plate allowed to adhere for 16 h. Afterward, cells were treated with vehicle (0.3% DMSO), 10 nM C5a, 10 µM capric acid, 10 µM lauric acid, or 10 µM undecanoic acid. CI measurements were taken every 10 s after compound addition. LPS (0.1 µg/ml) was added to WT BMDMs (C) and GPR84−/− BMDMs (D) seeded in a 96-well E-plate for 16 h before agonist addition. Cells were stimulated with either vehicle (0.3% DMSO), 10 nM C5a, or 6-OAU at the doses indicated in the legend. CI measurements were taken every 10 s after compound addition. Curves represent changes in cell index after agonist addition. Representative figures from n = 4 independent biological experiments are shown.
Figure 5
Figure 5
GPR84 signaling activates AKT, ERK, and NFκβ in WT, but not in GPR84−/− macrophages. (A) Bone marrow-derived macrophages (BMDMs) were treated with 0.1 µg/ml LPS for 2 h before stimulated with either vehicle (0.3% DMSO) or 1 µM 6-OAU for 1, 5, 10, 30, and 60 min. Cell lysates were prepared and western blotting conducted for either phosphorylated Akt (P-AKT) or ERK 1/2 (P-ERK), followed by stripping and re-staining for β-actin as a loading control. Representative images from n = 3 independent experiments are shown. (B) BMDMs were treated with LPS (0.1 µg/ml) for 2 h before stimulation with vehicle (0.3% DMSO) or 1 µM 6-OAU for 30 min followed by p65 staining. Confocal microscopy images are illustrative of two separate experiments. (C) BMDMs were treated with LPS (0.1 µg/ml) for 2 h before stimulation with either vehicle (0.3% DMSO) or 1 µM 6-OAU for 5, 10, 30, and 60 min. Western blotting for p65 was performed using samples from cytoplasmic and nuclear fractions of cell lysates, followed by stripping and re-staining for histone-3 in the nuclear fraction and α-tubulin in the cytoplasmic fraction as a loading control. Representative images from n = 3 independent experiments are shown.
Figure 6
Figure 6
GPR84 activation enhances pro-inflammatory mediator expression in macrophages. (A,C,E) Bone marrow-derived macrophages (BMDMs) were treated with 0.1 µg/ml LPS for 2 h before stimulation with vehicle (0.3% DMSO) or 1 µM 6-OAU for 30, 60, 90, 120, and 240 min. mRNA expression of Tnfα (A), Il-6 (C), and Ccl2 (E) was analyzed by q-PCR of WT and GPR84−/− BMDMs. Secreted protein levels of TNFα (B), IL-6 (D), and CCL2 (F) were measured by ELISA. Data presented as mean ± SEM of n = 4–6 separate experiments. Statistical significance was assessed using one-way ANOVA with Dunnett’s multiple comparison post hoc test. *P ≤ 0.05, **P ≤ 0.01, ***P ≤ 0.001 versus vehicle.
Figure 7
Figure 7
GPR84 antagonist abrogates the enhanced inflammatory response mediated by 6-OAU. (A) Intracellular cyclic AMP levels were measured in CHO-GPR84 cells pre-treated with the antagonist followed by forskolin and 6-OAU stimulation. Data are represented as the mean ± SEM of the percentage of the response to forskolin in the absence of agonists n = 3 independent experiments. (B–H) Bone marrow-derived macrophages were treated with LPS (0.1 µg/ml) for 2 h before pre-treatment with vehicle (0.3% DMSO), 10 µM antagonist for 30 min, or 200 ng/ml Pertussis toxin for 90 min. Afterward cells were stimulated with either vehicle (0.3% DMSO) or 1 µM 6-OAU for either 10′ for protein isolation or 1 h for RNA extraction. (B) Cell lysates were prepared and western blotting conducted for either phosphorylated Akt (P-AKT) or ERK 1/2 (P-ERK), followed by stripping and re-staining for β-actin as a loading control. Representative images from n = 3 independent experiments. (C–H) mRNA expression of Tnfα (C), Il-6 (D), Il-12 (E), Ccl5 (F), Ccl2 (G), and Cxcl1 (H) was analyzed by q-PCR. Data are presented as mean ± SEM of n = 4–7 separate experiments. Statistical significance was assessed using one-way ANOVA with Dunnett’s multiple comparison post hoc test. *P ≤ 0.05, **P ≤ 0.01, ***P ≤ 0.001 versus vehicle; #P ≤ 0.05, ##P ≤ 0.01, ###P ≤ 0.001 versus 6-OAU.
Figure 8
Figure 8
6-OAU mediated—GPR84 activation promotes macrophage migration, bacterial adhesion, and phagocytosis. Bone marrow-derived macrophages (BMDMs) were treated with LPS (0.1 µg/ml) for 2 h before stimulation with vehicle (0.3% DMSO) or 1 µM 6-OAU for 1 h. In inhibition experiments, cells were pre-treated with 10 µM antagonist before stimulation. (A,B) A near confluent monolayer of BMDMs was scratched and 10 nM C5a or vehicle was added to cells. (A) Quantification of the number of cells that had migrated into the scratch at t = 24 h. Data are presented as mean ± SEM of n = 4 separate experiments. Statistical significance was assessed using two-way ANOVA with Tukey’s multiple comparison test. (B) Images from the IncuCyte imaging software at 20× magnification showing cells invading the scratch after 24 h monitoring. Representative images from n = 4 independent experiments are shown. (C) E. coli strain DH5-α bacteria adherence to the macrophage surface were measured following the protocol given in the Section “Materials and Methods” and expressed as CFU per milliliter after BMDM lysis. (D–G) BMDMs were incubated with pH-rodo Green E. coli bioparticles (0.1 mg/ml), and fluorescence emission was measured in the IncuCyte imaging platform every 15 min for 4 h at 37°C. (D,E,G) Quantification of the green object counts per well (p96-well plate) in WT (D) and GPR84−/− (E) BMDMs. (G) Green object counts per well (p24-well plate) in WT BMDMs under inhibitory conditions. Data are presented as mean ± SEM from n = 4 biological replicates in technical duplicate. (F) Representative images from the IncuCyte software from one of n = 4 separate experiments are shown. Scale bar 200 µm. (H,I) BMDMs were incubated with opsonized 3 µm polystyrene beads for 1 h at 37°C and then fixed and stained with safranin. Twenty images per well were taken and bead numbers were quantified by an observer blind to treatment group. Data are presented as the number of cells with beads inside divided by the total number of cells per image. *P ≤ 0.05, **P ≤ 0.01, ***P ≤ 0.001 versus vehicle.

References

    1. Mathis D, Shoelson SE. Immunometabolism: an emerging frontier. Nat Rev Immunol (2011) 11(2):81.10.1038/nri2922 - DOI - PMC - PubMed
    1. Alvarez-Curto E, Milligan G. Metabolism meets immunity: the role of free fatty acid receptors in the immune system. Biochem Pharmacol (2016) 114:3–13.10.1016/j.bcp.2016.03.017 - DOI - PubMed
    1. Recio C, Lucy D, Iveson P, Iqbal AJ, Valaris S, Wynne G, et al. The role of metabolite-sensing G protein-coupled receptors in inflammation and metabolic disease. Antioxid Redox Signal (2018).10.1089/ars.2017.7168 - DOI - PubMed
    1. Medzhitov R. Origin and physiological roles of inflammation. Nature (2008) 454(7203):428–35.10.1038/nature07201 - DOI - PubMed
    1. Davies LC, Taylor PR. Tissue-resident macrophages: then and now. Immunology (2015) 144(4):541–8.10.1111/imm.12451 - DOI - PMC - PubMed