Expression and network analysis of YBX1 interactors for identification of new drug targets in lung adenocarcinoma
- PMID: 29973960
- PMCID: PMC6030768
- DOI: 10.7150/jgen.20581
Expression and network analysis of YBX1 interactors for identification of new drug targets in lung adenocarcinoma
Abstract
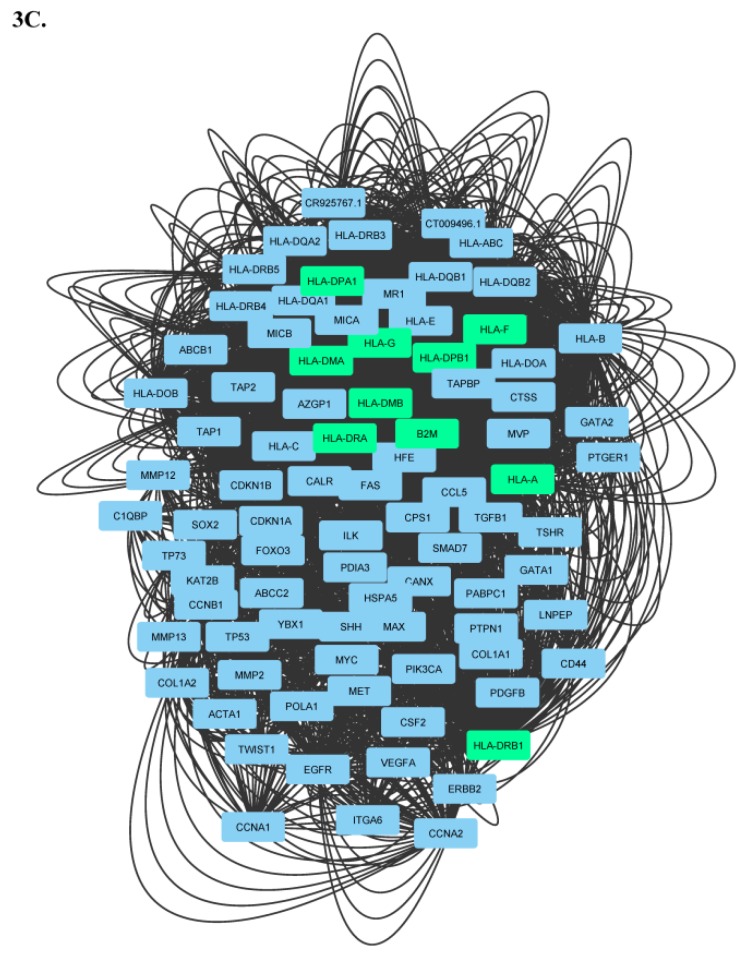
Y-Box Binding protein 1 (YBX-1) is known to be involved in various types of cancers. It's interactors also play major role in various cellular functions. Present work aimed to study the expression profile of the YBX-1 interactors during lung adenocarcinoma (LUAD). The differential expression analysis involved 57 genes from 95 lung adenocarcinoma samples, construction of gene network and topology analysis. A Total of 43 genes were found to be differentially expressed from which 17 genes were found to be down regulated and 26 genes were up-regulated. We observed that Polyadenylate-binding protein 1 (PABPC1), a protein involved in YBX1 translation, is highly correlated with YBX1. The interaction network analysis for a differentially expressed non-coding RNA Growth Arrest Specific 5 (GAS5) suggests that two proteins namely, Growth Arrest Specific 2 (GAS2) and Peripheral myelin protein 22 (PMP22) are potentially involved in LUAD progression. The network analysis and differential expression suggests that Collagen type 1 alpha 2 (COL1A2) can be potential biomarker and target for LUAD.
Keywords: RNA-Seq.; YBX1; lung adenocarcinoma; regulatory network.
Conflict of interest statement
Competing Interests: The authors have declared that no competing interest exists.
Figures


Similar articles
-
Interaction network analysis of YBX1 for identification of therapeutic targets in adenocarcinomas.J Biosci. 2019 Jun;44(2):27. J Biosci. 2019. PMID: 31180040
-
YBX1 as a prognostic biomarker and potential therapeutic target in hepatocellular carcinoma: A comprehensive investigation through bioinformatics analysis and in vitro study.Transl Oncol. 2024 Jul;45:101965. doi: 10.1016/j.tranon.2024.101965. Epub 2024 Apr 29. Transl Oncol. 2024. PMID: 38688048 Free PMC article.
-
lncRNA GAS5 enhances G1 cell cycle arrest via binding to YBX1 to regulate p21 expression in stomach cancer.Sci Rep. 2015 May 11;5:10159. doi: 10.1038/srep10159. Sci Rep. 2015. PMID: 25959498 Free PMC article.
-
Role of post-translational modification of the Y box binding protein 1 in human cancers.Genes Dis. 2015 May 27;2(3):240-246. doi: 10.1016/j.gendis.2015.05.001. eCollection 2015 Sep. Genes Dis. 2015. PMID: 30258867 Free PMC article. Review.
-
YBX1 at the crossroads of non-coding transcriptome, exosomal, and cytoplasmic granular signaling.Eur J Cell Biol. 2018 Apr;97(3):163-167. doi: 10.1016/j.ejcb.2018.02.003. Epub 2018 Feb 19. Eur J Cell Biol. 2018. PMID: 29478751 Review.
Cited by
-
Growth arrest-specific 2 protein family: Structure and function.Cell Prolif. 2021 Jan;54(1):e12934. doi: 10.1111/cpr.12934. Epub 2020 Oct 25. Cell Prolif. 2021. PMID: 33103301 Free PMC article. Review.
-
Relevant and Non-Redundant Feature Selection for Cancer Classification and Subtype Detection.Cancers (Basel). 2021 Aug 26;13(17):4297. doi: 10.3390/cancers13174297. Cancers (Basel). 2021. PMID: 34503106 Free PMC article.
-
YBX1: an RNA/DNA-binding protein that affects disease progression.Front Oncol. 2025 Jul 29;15:1635209. doi: 10.3389/fonc.2025.1635209. eCollection 2025. Front Oncol. 2025. PMID: 40799245 Free PMC article. Review.
-
Newly discovered roles of triosephosphate isomerase including functions within the nucleus.Mol Med. 2023 Jan 31;29(1):18. doi: 10.1186/s10020-023-00612-x. Mol Med. 2023. PMID: 36721084 Free PMC article. Review.
-
Elevated GAS2L3 Expression Correlates With Poor Prognosis in Patients With Glioma: A Study Based on Bioinformatics and Immunohistochemical Analysis.Front Genet. 2021 Mar 30;12:649270. doi: 10.3389/fgene.2021.649270. eCollection 2021. Front Genet. 2021. PMID: 33859674 Free PMC article.
References
-
- Siegel R, Naishadham D, Jemal A. Cancer Statistics. 2013. CA Cancer J Clin. 2013;63:11–30. - PubMed
-
- Jemal A, Bray F, Center MM, Ferlay J, Ward E, Forman D. Global Cancer Statistics: 2011. CA Cancer J Clin. 2011;61:69–90. - PubMed
-
- Travis WD, Brambilla E, Riely GJ. New pathologic classification of lung cancer: Relevance for clinical practice and clinical trials. J. Clin. Oncol. 2013;31:992–1001. - PubMed
-
- Hunter DJ. Gene - environment interactions in human diseases. Nat. Rev. Genet. 2005;6:287–298. - PubMed
LinkOut - more resources
Full Text Sources
Other Literature Sources
Research Materials
Miscellaneous