. 2018 Dec;48(12):4103-4117.
doi: 10.1007/s10803-018-3670-2.

California Autism Prevalence Trends from 1931 to 2014 and Comparison to National ASD Data from IDEA and ADDM

Affiliations

California Autism Prevalence Trends from 1931 to 2014 and Comparison to National ASD Data from IDEA and ADDM

Cynthia Nevison et al. J Autism Dev Disord. 2018 Dec.

Abstract

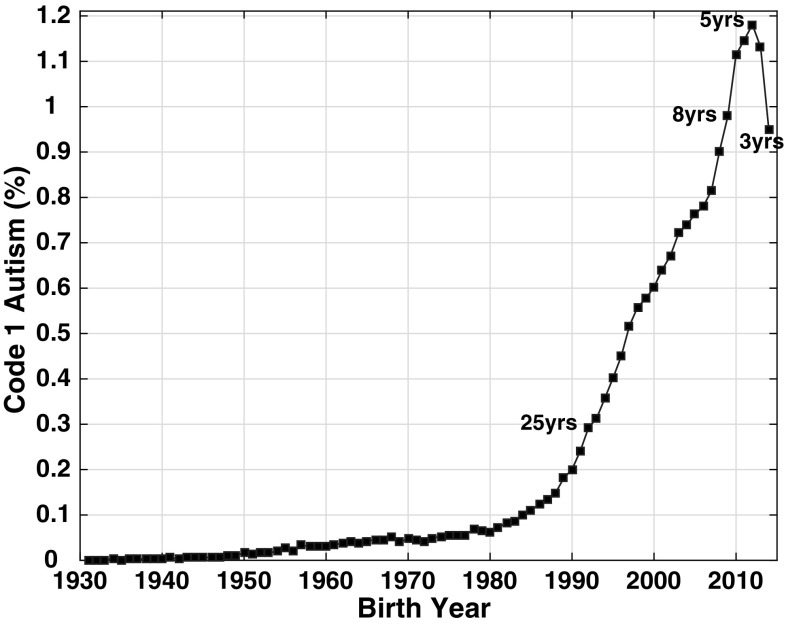
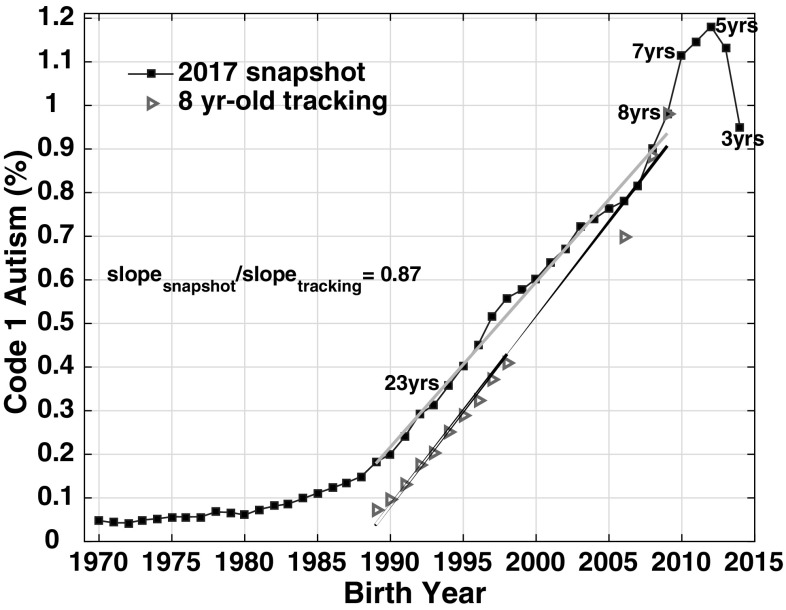
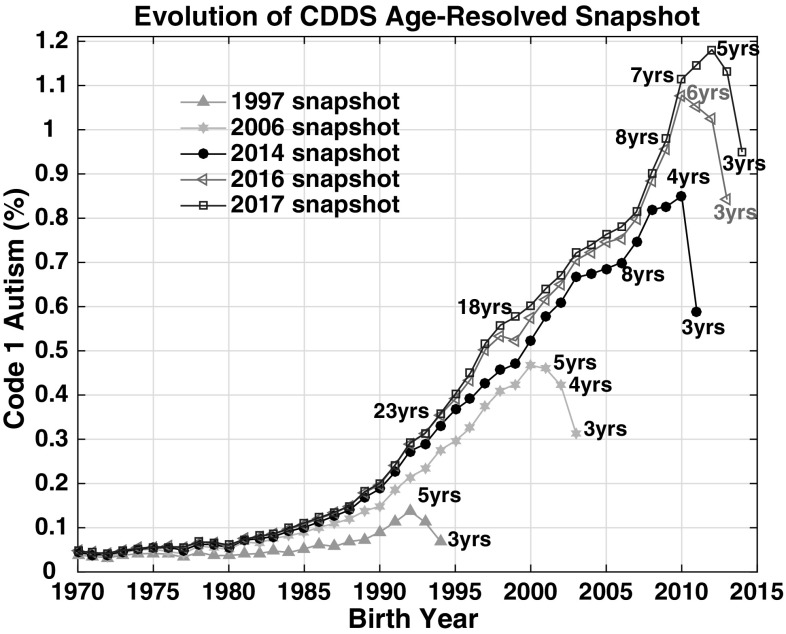
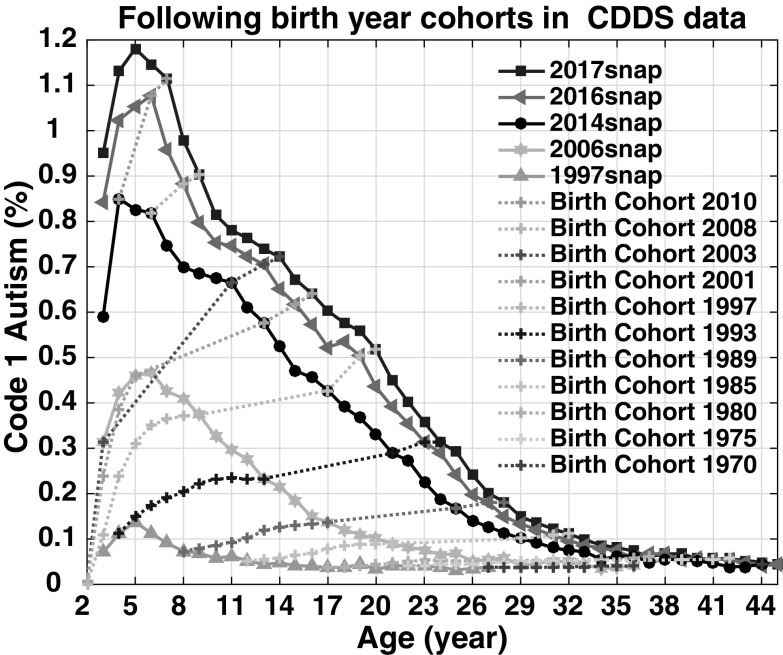
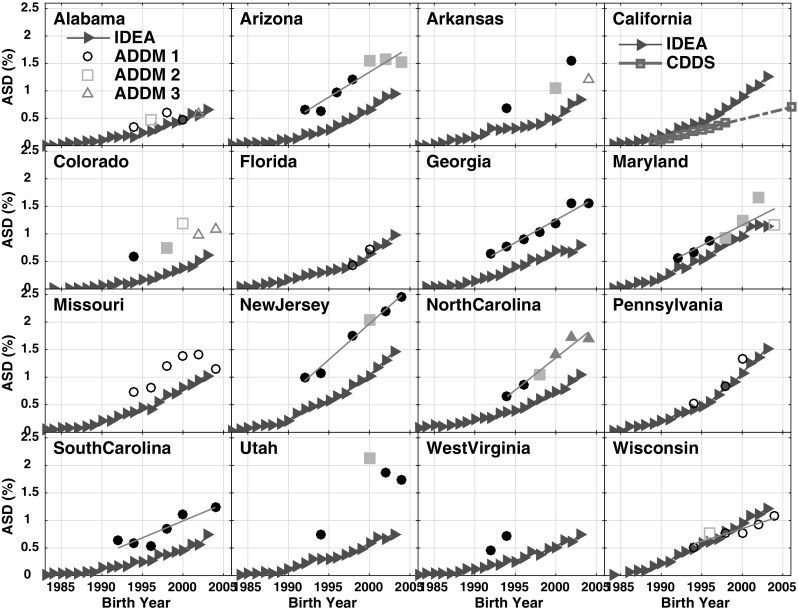
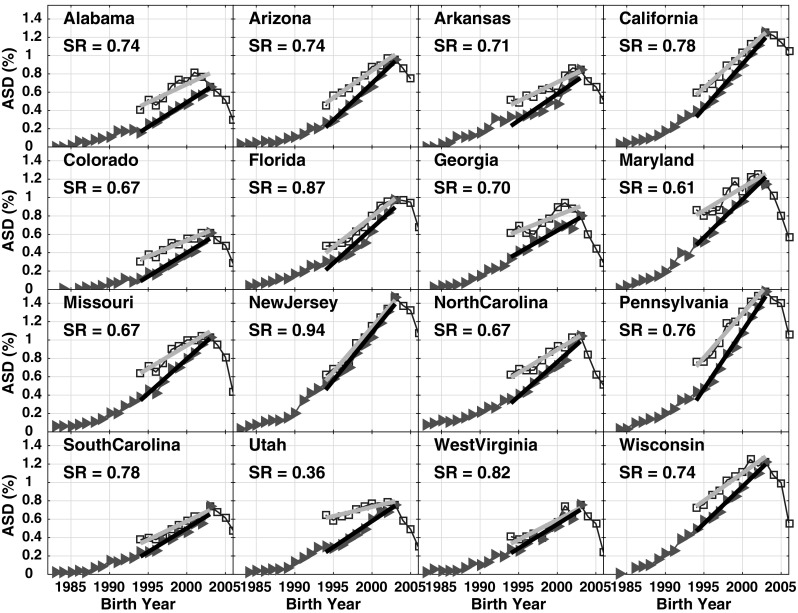
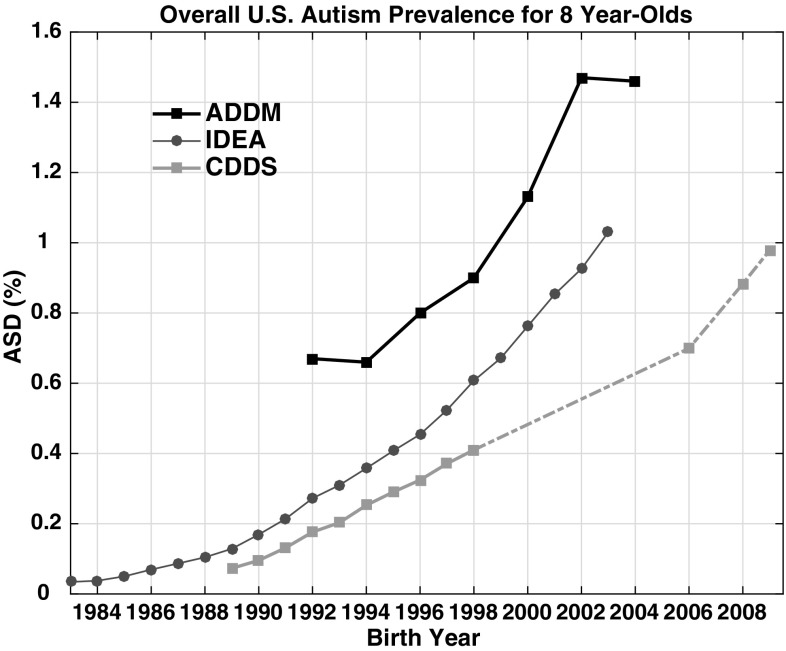
Time trends in U.S. autism prevalence from three ongoing datasets [Individuals with Disabilities Education Act, Autism and Developmental Disabilities Monitoring Network, and California Department of Developmental Services (CDDS)] are calculated using two different methods: (1) constant-age tracking of 8 year-olds and (2) age-resolved snapshots. The data are consistent across methods in showing a strong upward trend over time. The prevalence of autism in the CDDS dataset, the longest of the three data records, increased from 0.001% in the cohort born in 1931 to 1.2% among 5 year-olds born in 2012. This increase began around ~ 1940 at a rate that has gradually accelerated over time, including notable change points around birth years 1980, 1990 and, most recently, 2007.

Keywords: ADDM; ASD prevalence; Autism spectrum disorder; Autistic disorder; CDDS; IDEA; Time trends.


Conflict of interest statement

Conflict of interest

CN, MB and WZ declare that the research was conducted in the absence of any commercial or financial relationships that could be construed as a potential conflict of interest.

Ethics Approval

The ASD counts used in this study involved datasets in which all relevant personal information had been de-identified prior to our activities and in which the data were aggregated by age at the state level. This project therefore did not require institutional review and approval.

Figures

Fig. 1
Fig. 1
Age-resolved snapshot for 2017, showing the growth in California Department of Developmental Services (CDDS) Code 1 autism prevalence from 0.001% in birth year 1931 to 1.18% in birth year 2012. (Color figure online)
Fig. 2
Fig. 2
CDDS data from 1997 to 2006, 2014, 2016 and 2017 reports, comparing 8 year-old tracking (red triangles) to 2017 age-resolved snapshot (blue squares) slopes over birth year interval 1989–2009. The bsnap:btrack slope ratio, representing the ratio of the grey:black slopes, is 0.87. Selected ages are labeled on the blue age-resolved snapshot curve, indicating the age of each birth cohort in 2017. (Color figure online)
Fig. 3
Fig. 3
CDDS Code 1 autism data comparing 1997 (green triangles), 2006 (cyan squares), 2014 (black circles), 2016 (magenta triangles) and 2017 (blue squares) age-resolved snapshots. Selected ages are labeled on each snapshot curve, indicating the age of each birth cohort at the time each respective CDDS report was compiled. (Color figure online)
Fig. 4
Fig. 4
CDDS prevalence by age, period, and year of birth. Dotted lines represent children born in the denoted year as they age over time. The period curves use the same data as the age-resolved snapshots for 1997, 2006, 2014, 2016 and 2017 in Fig. 3, but are plotted versus age (i.e., in reverse order along the X-axis) rather than versus birth year. (Color figure online)
Fig. 5
Fig. 5
Comparison of data tracking ASD prevalence among 8 year-olds from 3 different networks. IDEA data (red triangles) tracking 8 year-olds over report years 1991–2011 (corresponding to birth years 1983–2003) are available for all states. In California, the IDEA data are compared to CDDS 8 year-olds (magenta squares) tracked from report years 1997–2006 and 2014 (birth years 1989–1998 and 2006). For all other states, the IDEA data are compared to ADDM 8 year-olds tracked biannually from birth years 1992–2004. Up to 3 different black or grey symbols are used for the ADDM data to denote shifts and inconsistencies in the number of counties sampled within each state in successive reports. In addition, the ADDM data are plotted as solid symbols for prevalence derived based on both health and education records and as open symbols when only health records were available. (Color figure online)
Fig. 6
Fig. 6
IDEA data from 1991 to 2011 reports, comparing 8 year-old tracking data (red triangles) to 2011 IDEA age-resolved snapshot data (blue squares). The slopes of the ASD prevalence increase over birth year interval 1994–2003 are determined by least squares linear regression and plotted as gray and black lines for the 2011 snapshot and 8 year-old tracking, respectively. The bsnap:btrack slope ratio (SR) is shown in each panel, representing the ratio of the grey:black slopes. (Color figure online)
Fig. 7
Fig. 7
Comparison of data tracking overall U.S. ASD prevalence among 8 year-olds from the IDEA and ADDM networks. Also shown are the CDDS 8 year-old data (covering CDER Code 1 autism cases in California only). (Color figure online)

Similar articles

Cited by

References

    1. American Psychiatric Association . Diagnostic and statistical manual of mental disorders. 3. Washington, D.C.: American Psychiatric Association; 1980.
    1. American Psychiatric Association . Diagnostic and statistical manual of mental disorders. 4. Washington, D.C.: American Psychiatric Association; 1994.
    1. American Psychiatric Association . Diagnostic and statistical manual of mental disorders. 5. Washington, D.C.: American Psychiatric Association; 2013.
    1. Autism Society San Francisco Bay Area. (2015). Autism rising: A report on the increasing autism rates in California.
    1. Becker KG. Autism and urbanization. American Journal of Public Health. 2010;100(7):1156–1157. doi: 10.2105/AJPH.2009.191007. - DOI - PMC - PubMed