. 2018 Jul 2;46(1):73-84.e7.
doi: 10.1016/j.devcel.2018.06.007.

MicroRNAs Overcome Cell Fate Barrier by Reducing EZH2-Controlled REST Stability during Neuronal Conversion of Human Adult Fibroblasts

Affiliations

MicroRNAs Overcome Cell Fate Barrier by Reducing EZH2-Controlled REST Stability during Neuronal Conversion of Human Adult Fibroblasts

Seong Won Lee et al. Dev Cell. .

Abstract

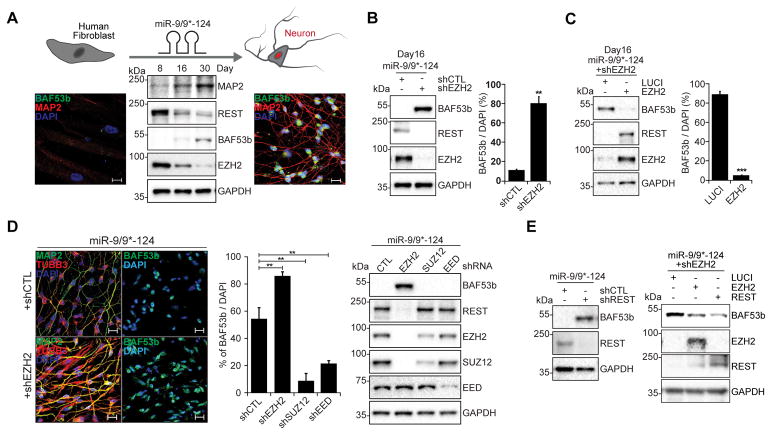
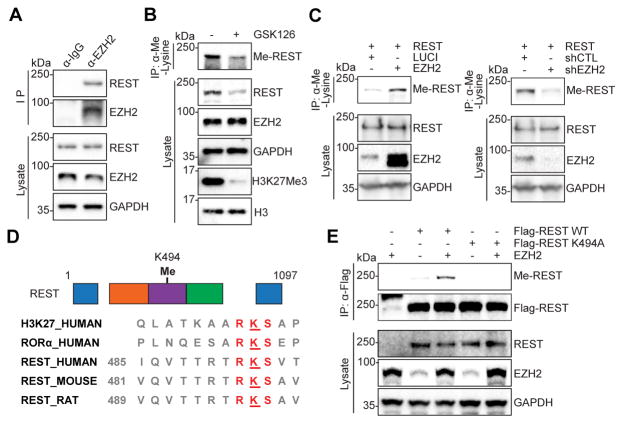
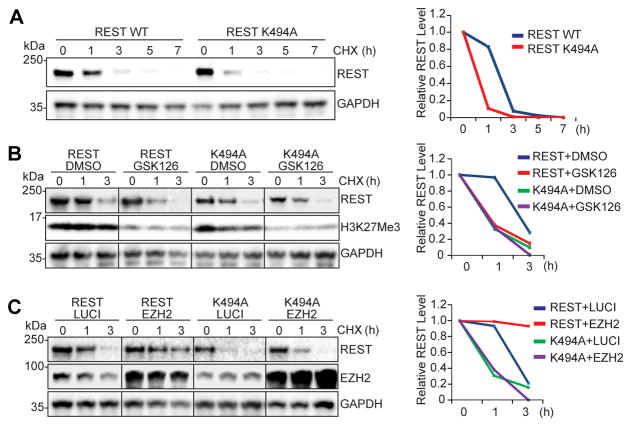
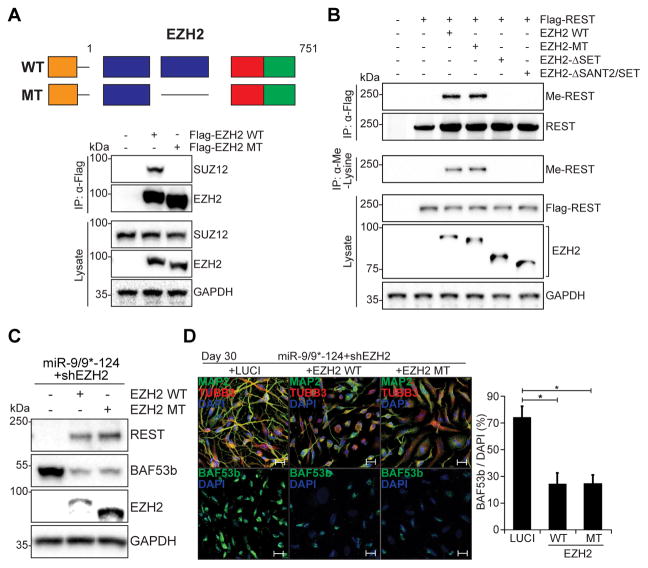
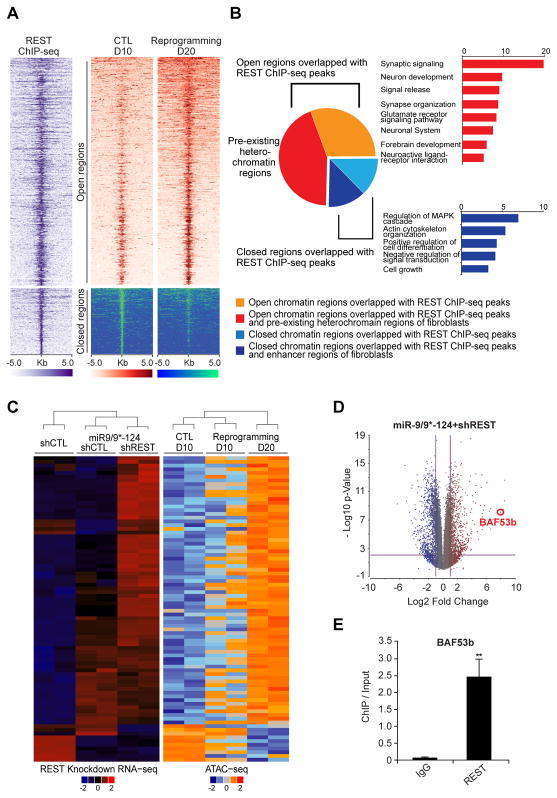
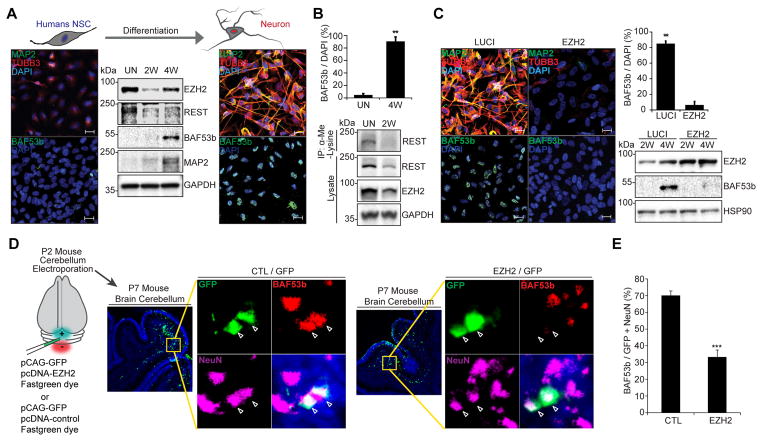
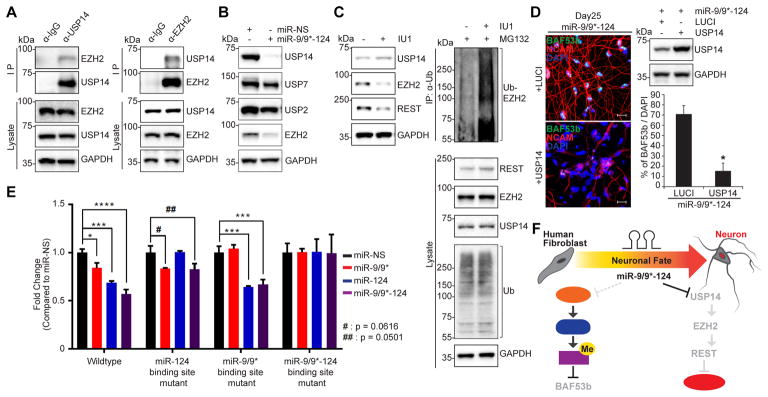
The ability to convert human somatic cells efficiently to neurons facilitates the utility of patient-derived neurons for studying neurological disorders. As such, ectopic expression of neuronal microRNAs (miRNAs), miR-9/9 and miR-124 (miR-9/9-124) in adult human fibroblasts has been found to evoke extensive reconfigurations of the chromatin and direct the fate conversion to neurons. However, how miR-9/9-124 break the cell fate barrier to activate the neuronal program remains to be defined. Here, we identified an anti-neurogenic function of EZH2 in fibroblasts that acts outside its role as a subunit of Polycomb Repressive Complex 2 to directly methylate and stabilize REST, a transcriptional repressor of neuronal genes. During neuronal conversion, miR-9/9-124 induced the repression of the EZH2-REST axis by downregulating USP14, accounting for the opening of chromatin regions harboring REST binding sites. Our findings underscore the interplay between miRNAs and protein stability cascade underlying the activation of neuronal program.

Keywords: ACTL6b; BAF complex; EZH2; REST; USP14; chromatin remodeling complex; microRNAs; neuronal reprogramming; protein modification; protein stability control.


Conflict of interest statement

DECLARATION OF INTERESTS

The authors declare no competing interests.

Figures

Figure 1
Figure 1. Repression of EZH2 and REST during miRNA-mediated neuronal conversion
(A) BAF53b and MAP2 expression in cells expressing miR-NS (left) or miR-9/9*-124 (right) at reprogramming day 30 (D30, 30 days after transduction with miR-NS or miR-9/9*-124). Scale bars represent 20 μm. Immunoblot analysis of reprogramming HAFs at D8, 16, and 30 (middle). (B) Immunoblot analysis (left) and quantification of BAF53b-positive cells (right) of reprogramming cells at D16 co-transduced with shCTL or shEZH2. shCTL: n = 219; shEZH2: n = 196; **p < 0.01 by t-test. Data are represented as mean ± SD. (C) Left, immunoblot analysis of reprogramming cells expressing shEZH2 co-transduced with luciferase (LUCI) or EZH2 at D16. Right, quantification of BAF53b-positive cells in reprogramming cells expressing shEZH2 co-transduced with luciferase (LUCI) or EZH2 at D30. LUCI: n = 254; EZH2: n = 184; ***p < 0.001 by t-test. Data are represented as mean ± SD. (D) Immunostaining analysis (left) and quantification of BAF53b-positive cells (middle) of reprogramming cells expressing shCTL or shEZH2 at D30. Scale bars represent 20 μm. shCTL: n = 659; shEZH2: n = 619; shSUZ12: n = 415; shEED: n = 511; **p < 0.01 by t-test. Data are represented as mean ± SD. Immunoblot analysis of reprogramming cells expressing shCTL or shRNAs-targeting Polycomb subunits at D16 (right). (E) Left, BAF53b and REST expression in reprogramming cells expressing shCTL or shREST at D16. Right, immunoblot analysis of reprogramming cells expressing shEZH2 co-transduced with EZH2 or REST at D30. All cells were counted from three or more randomly chosen fields.
Figure 2
Figure 2. EZH2 directly methylates REST
(A) Immunoprecipitation analysis of HAFs with anti-IgG or anti-EZH2 antibody followed by immunoblot analysis with anti-REST antibody. (B) Immunoprecipitation analysis of HAFs treated with DMSO or GSK126 (3 uM, 48 hr) using anti-pan-methyl-lysine antibody followed by immunoblot analysis with anti-REST antibody. (C) Immunoprecipitation analysis of HEK293T cells co-transfected with REST and EZH2 (left) or shEZH2 (right) using anti-pan-methyl-lysine antibody followed by immunoblot analysis with anti-REST antibody. (D) The methylation site, K494 of REST within lysine-rich domain and sequence comparison between methylation sites of Histone3/RORα and K494 of REST in human, mouse, and rat. RD, repression domain; DBD, DNA binding domain; K-rich, Lysine rich domain; P-rich, Proline rich domain. (E) Immunoprecipitation analysis of HEK293T cells co-transfected with Flag-REST-WT or K494A using anti-Flag antibody followed by immunoblot analysis with anti-pan-methyl-lysine antibody and anti-Flag antibody.
Figure 3
Figure 3. EZH2 stabilizes REST by methylation
(A) Comparison of REST wildtype (WT) and K494A expression in HEK293T cells treated with cycloheximide (CHX) at 100 uM (left). Quantification of relative REST expression in normalized to GAPDH (right). (B) Left, immunoblot analysis of HEK293T cells expressing REST WT or K494A treated with cycloheximide (CHX) at 100 uM for 0, 1, and 3 hr. Cells were pre-treated with DMSO or GSK126. Right, quantification of REST expression normalized to GAPDH. (C) Left, Immunoblot analysis of HEK293T cells expressing REST WT or K494A co-transfected with LUCI or EZH2 treated with cycloheximide (CHX) at 100 uM for 0, 1, and 3 hr. Right, quantification of REST expression normalized to GAPDH.
Figure 4
Figure 4. PRC2-independent function of EZH2 controls REST stability
(A) Top, domain structure of Flag-tagged EZH2 wildtype (WT) and SANT2-deletion mutant (MT). SANT1 and SANT2, SANT domains; CXC, cysteine-rich domain; SET, SET domain. Bottom, immunoprecipitation analysis of HEK293T cells transfected with Flag-EZH2-WT or -MT using anti-Flag antibody followed by immunoblot analysis with anti-SUZ12 antibody and anti-Flag antibody. (B) Immunoprecipitation analysis of HEK293T cells co-transfected with Flag-REST and EZH2 wildtype (WT), SANT2-domain deletion mutant (MT), SET-domain deletion mutant (ΔSET), or double mutant (ΔSANT2/SET) using anti-Flag or anti-pan-methyl-lysine antibody. (C) Immunoblot analysis of reprogramming cells expressing shEZH2 co-transduced with EZH2 WT or MT at D30. (D) Immunostaining analysis (left) and quantification of BAF53b-positive cells (right) from three randomly picked fields of reprogramming cells expressing shEZH2 co-transduced with EZH2 WT or MT at D30. Scale bars represent 20 μm. LUCI: n = 353; EZH2-WT: n = 290; EZH2-MT: n = 352; *p < 0.05 by t-test. Data are represented as mean ± SD.
Figure 5
Figure 5. miR-9/9*-124-mediated repression of REST enhances chromatin accessibility
(A) Heatmaps showing signal intensity of 1,267 differential peaks in opened and closed chromatin peaks in response to miR-9/9*-124 overlapped with REST binding sites by comparing genomic regions identified by ATAC-seq in control cells (CTL) at day 10 (D10) and reprogramming cells at D20 to genome-wide REST binding sites (ENCODE). (B) Left, The genomic distribution of the opened (951 peaks) and closed (316 peaks) chromatin regions containing REST binding sites in (A). 562 peaks of opened regions overlapped with pre-existing heterochromatin in human fibroblasts marked by H3K9me3/H3K27me3 (red) and 163 peaks of closed regions overlapped with enhancer in fibroblasts marked by H3K27ac/H3K4me1 (blue). Right, Gene Ontology (GO) enrichment analysis of genes associated with opened heterochromatin regions (top) or closed enhancer regions (bottom) in fibroblasts containing REST binding sites. (C) Hierarchical clustering showing 71 upregulated genes from the accessible peaks containing REST binding sites overlapped with heterochromatin regions in human fibroblasts, and 13 downregulated genes from peaks of closed regions containing REST binding sites overlapped with enhancer regions in (B) by comparing DEGs (logFC > 2 or < −2, adjusted p < 0.01) of RNA-seq analysis between HAFs expressing control shRNA (shCTL), reprogramming cells expressing shCTL or shREST at day 7 (left) and ATAC-seq signal intensities in control cell (CTL) at day 10 (D10), reprogramming cells at day 10 (D10) and day 20 (D20) (right). (D) Volcano plots of upregulated (red) or downregulated (blue) DEGs (logFC > 2 or < −2, adjusted p < 0.01) of RNA-seq analysis of reprogramming cells expressing shCTL or shREST at D7. (E) ChIP-qPCR analysis of REST-enrichment on BAF53b promoter region in HAFs. n = 3, **p < 0.01 by t-test. Data are represented as mean ± SEM.
Figure 6
Figure 6. Antagonistic relationship between the EZH2-REST axis and BAF53b activation is required for neuronal development
(A) Immunostaining analysis of ReNcells undifferentiated (UN, left) and differentiated for 4 weeks (4W, right). Scale bars represent 20 μm. Immunoblot analysis of ReNcells at UN, 2W or 4W (middle). (B) Quantification of BAF53b-positive cells in (A) (top). UN: n = 332; 4W: n = 315; **p < 0.01 by t-test. Data are represented as mean ± SD. Immunoprecipitation analysis of ReNcells at UN or 2W with anti-pan-methyl-lysine antibody followed by immunoblot analysis with anti-REST antibody (bottom). (C) Immunostaining analysis of ReNcells transduced with LUCI or EZH2 at 4W (left). Scale bars represent 20 μm. Quantification of BAF53b-positive cells (right, top). LUCI: n = 265; EZH2: n = 262; **p < 0.01: by t-test. Data are represented as mean ± SD. Immunoblot analysis of ReNcells with LUCI or EZH2 at 2W and 4W (right, bottom). (D) GFP, BAF53b and NeuN expression in cerebellum of P7 mouse brain co-transfected with GFP and control (CTL) and EZH2. (E) Quantification of BAF53b-positive cells in GFP and NeuN positive cells. CTL: n = 163, EZH2: n = 198, ***p < 0.001 by t-test. Data are represented as mean ± SEM. All cells were counted from three or more brain sections from two independent mice.
Figure 7
Figure 7. USP14 repression by miR-9/9*-124 deactivates EZH2
(A) Immunoprecipitation analysis of HAFs with anti-IgG or anti-USP14 (left) and anti-IgG or anti-EZH2 (right) antibody followed by immunoblot analysis. (B) Immunoblot analysis of reprogramming cells expressing miR-NS or miR-9/9*-124 at D7. (C) Left, immunoblot analysis of HAFs treated with DMSO or IU1, USP14 inhibitor for 72 hr. Right, immunoprecipitation analysis of HAFs treated with DMSO or IU1 for 72 hr in the presence of MG132 (20uM, 4hr) using anti-Ubiquitin antibody followed by immunoblot analysis with anti-EZH2 antibody. (D) Left, immunostaining analysis of reprogramming cells transduced with control (LUCI) or USP14 at D25 (left). Scale bars represent 20 μm. Right, top, USP14 expression in cells in (E, left). Right, bottom, quantification of BAF53b-positive cells from three randomly picked fields of cells in (E, left) LUCI: n = 306; USP14: n = 267; *p < 0.05: by t-test. Data are represented as mean ± SD. (E) Luciferase assays with HEK293T cells co-transfected with miR-NS, miR-9/9* only, miR-124 only, or miR-9/9* and miR-124 together (miR-9/9*-124) and USP14 3′UTRs containing point mutations to the seed match regions of miR-9/9* and miR-124 (wildtype or mutants of miR-124 only, miR-9/9* only, or miR-9/9*-124). *p < 0.05, ***p < 0.001, #p = 0.0616, ##p = 0.0501 by t-test. Data are represented as mean ± SD from four independent biological replicates. (F) A proposed model to illustrate a non-canonical function of EZH2 in regulating REST stability and BAF53b activation during neuronal development.

Similar articles

Cited by

References

    1. Abernathy DG, Kim WK, McCoy MJ, Lake AM, Ouwenga R, Lee SW, Xing X, Li D, Lee HJ, Heuckeroth RO, et al. MicroRNAs Induce a Permissive Chromatin Environment that Enables Neuronal Subtype-Specific Reprogramming of Adult Human Fibroblasts. Cell Stem Cell. 2017;21:332–348. e9. - PMC - PubMed
    1. Ballas N, Grunseich C, Lu DD, Speh JC, Mandel G. REST and its corepressors mediate plasticity of neuronal gene chromatin throughout neurogenesis. Cell. 2005;121:645–57. - PubMed
    1. Battaglioli E, Andres ME, Rose DW, Chenoweth JG, Rosenfeld MG, Anderson ME, Mandel G. REST repression of neuronal genes requires components of the hSWI. SNF complex. J Biol Chem. 2002;277:41038–45. - PubMed
    1. Biggar KK, Li SS. Non-histone protein methylation as a regulator of cellular signalling and function. Nat Rev Mol Cell Biol. 2015;16:5–17. - PubMed
    1. Cao Q, Wang X, Zhao M, Yang R, Malik R, Qiao Y, Poliakov A, Yocum AK, Li Y, Chen W, et al. The central role of EED in the orchestration of polycomb group complexes. Nat Commun. 2014;5:3127. - PMC - PubMed

Publication types

MeSH terms