Review
. 2018 Dec;91(1092):20170825.
doi: 10.1259/bjr.20170825. Epub 2018 Jul 23.

Clinical application and technical considerations of T1 & T2(*) mapping in cardiac, liver, and renal imaging

Affiliations
Review

Clinical application and technical considerations of T1 & T2(*) mapping in cardiac, liver, and renal imaging

Ilona A Dekkers et al. Br J Radiol. 2018 Dec.

Abstract

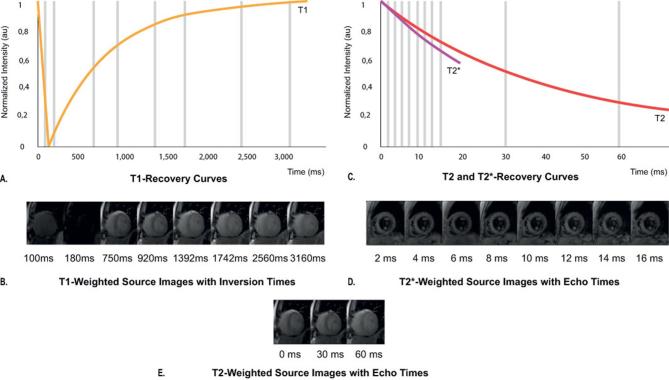
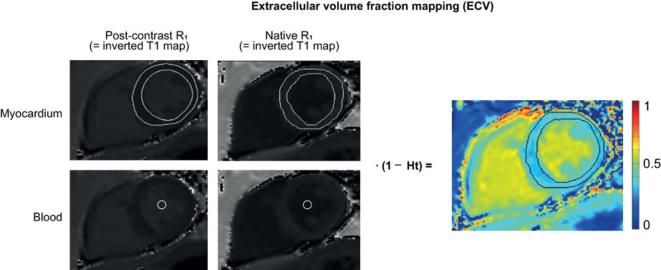
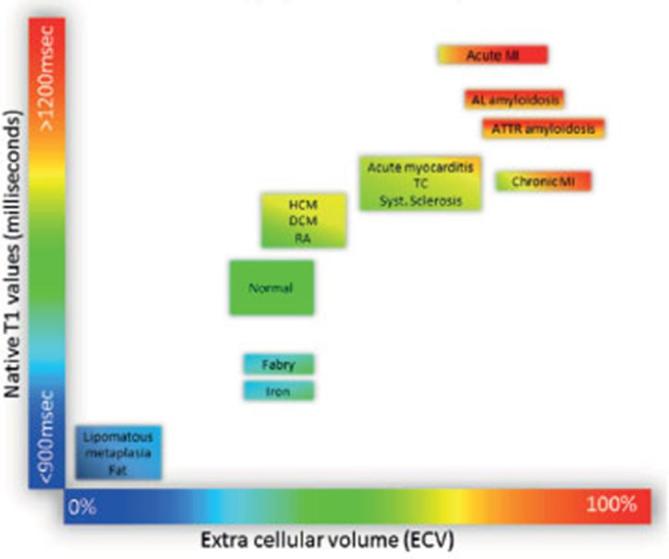
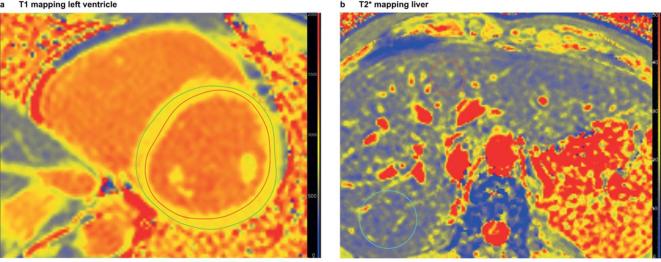
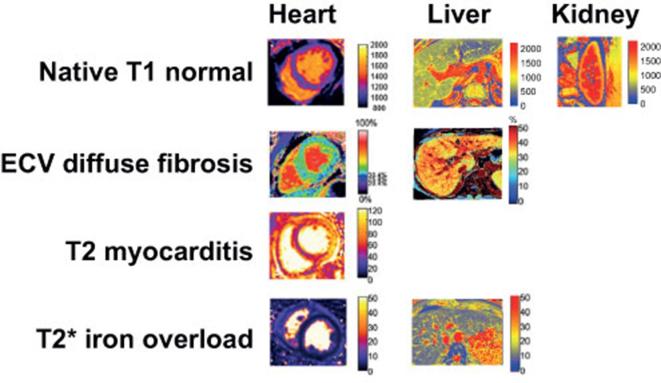
Pathological tissue alterations due to disease processes such as fibrosis, edema and infiltrative disease can be non-invasively visualized and quantified by MRI using T1 and T2 relaxation properties. Pixel-wise mapping of T1 and T2 image sequences enable direct quantification of T1, T2(*), and extracellular volume values of the target organ of interest. Tissue characterization based on T1 and T2(*) mapping is currently making the transition from a research tool to a clinical modality, as clinical usefulness has been established for several diseases such as myocarditis, amyloidosis, Anderson-Fabry and iron deposition. Other potential clinical applications besides the heart include, quantification of steatosis, cirrhosis, hepatic siderosis and renal fibrosis. Here, we provide an overview of potential clinical applications of T1 andT2(*) mapping for imaging of cardiac, liver and renal disease. Furthermore, we give an overview of important technical considerations necessary for clinical implementation of quantitative parametric imaging, involving data acquisition, data analysis, quality assessment, and interpretation. In order to achieve clinical implementation of these techniques, standardization of T1 and T2(*) mapping methodology and validation of impact on clinical decision making is needed.


Figures

Figure 1.
Figure 1.
Magnetization inversion recovery for T1, T2and T2* mapping. T1 recovery curve showing increase in the longitudinal magnetization with longer inversion times due to T1 recovery, left curve (A). Different images are obtained following an inversion pulse at multiple different inversion times for T1 mapping during the same phase of the cardiac cycle in subsequent heart beats (B). T2 and T2* recovery curves showing that as the TE increases, the myocardial signal intensity decreases due to T2 decay, (long curve), and due to static field inhomogeneities for T2* decay (short curve) (C). Different gradient echo images are acquired at different echo times for T2* mapping (D), and different spin-based preparation images are acquired at different echo times for T2 mapping (E).
Figure 2.
Figure 2.
Calculation of ECV. Calculation of ECV using the inverse of the signal in each pixel (1/T1) is used to generate an R1 map (F). The ΔR1 map of the blood pool (ΔR1blood) and myocardium (ΔRmyocard) is generated by subtracting the corresponding precontrast R1 map from the post-contrast R1 map. ΔR1 map pixel values are multiplied by one minus the hematocrit level, and then divided by the mean ΔR1blood in order to calculate ECV. The final result is a colour encoded parametric map displaying the pixel-by-pixel ECV values. ECV, extra cellular volume.
Figure 3.
Figure 3.
Example of correspondence of ECV and LGE in a patient with PVCs with focal fibrosis. LGE shows some enhancement basal septal, which is confirmed by the ECV map constructed using the pre- and post-contrast T1 maps. The ECV in the region of interest was 45% localized in focal septal hypertrophy, which is the likely origin of the PVC's. Quantitative T1 and ECV maps were automatically reconstructed on a voxel-by-voxel basis after data acquisition using the T1 map processing tool (Medis Research Edition, v. 3.0, Leiden). ECV, extra cellular volume; LGE, late gadolinium enhancement; PCV, premature ventricular contraction.
Figure 4.
Figure 4.
Example of added value of ECV compared to LGE in a patient with familial hypertrophic cardiomyopathy with diffuse fibrosis. Non-dilated left ventricle with septal hypertrophy with diffuse fibrosis [serum hematocrit of 45%, native T1 septum 1315 ms (N < 1350 ms), and ECV 42% (N < 35%)]. Quantitative T1 and ECV maps were automatically reconstructed on a voxel-by-voxel basis after data acquisition using the T1 map processing tool (Medis Research , v. 3.0, Leiden). ECV, extra cellular volume; LGE, late gadolinium enhancement.
Figure 5.
Figure 5.
Tissue characterization using native T1 and ECV fraction. Absolute values for native T1 depend greatly on field strength (1.5 or 3 T), pulse sequence (MOLLI or ShMOLLI), scanner manufacturer and post-processing. For the purpose of comparability, only studies using 1.5 T scanners were considered in this figure. Reprinted from Haaf et al publisher BioMed Central under the terms of the Creative Commons Licence. ECV, extra cellular volume; MOLLI, modified look-locker imaging; ShMOLLI, shortened MOLLI.
Figure 6.
Figure 6.
T2* mapping of heart (left) and liver (right) in a childhood cancer survivor at risk of secondary hemosiderosis after multiple blood transfusions and chemotherapy for acute lymphatic leukemia. Parametric imaging of heart and liver using StarQuant (Philips) heart and LiverMultiScan (Perspectum). The myocardial T2* value was 38 ms (normal reference > 20 ms), and liver T2* value was 13.3 ms, indicating normal T2* values of the heart and minimal iron deposition in the liver. Quantitative T2 maps were automatically reconstructed on a voxel-by-voxel basis after data acquisition using the T2 map processing tool (Medis Research Edition, v. 3.0, Leiden).
Figure 7.
Figure 7.
Typical appearance of T1, ECV, T2, and T2* maps in heart, liver, and kidney of healthy subjects (upper row) and in patients with myocardial and liver disease (second to fourth row) (Medis Research Edition, v. 3.0, Leiden). Adapted by permission from BioMed Central under the terms of the Creative Commons Licence, and adapted by permission from BMJ Publishing Group Limited.ECV, extra cellular volume.

References

    1. Rockey DC, Bell PD, Hill JA. Fibrosis —a common pathway to organ injury and failure. N Engl J Med Overseas Ed 2015; 372: 1138–49. doi: 10.1056/NEJMra1300575 - DOI - PubMed
    1. Zeisberg M, Kalluri R. Cellular Mechanisms of Tissue Fibrosis. 1. Common and organ-specific mechanisms associated with tissue fibrosis. Am J Physiol 2013; 304: C216–C225. doi: 10.1152/ajpcell.00328.2012 - DOI - PMC - PubMed
    1. Scallan J, Huxley V, Korthuis R, Fluid C. Exchange: regulation, functions, and pathology. Integrated systems physiology: from molecule to function to disease. San Rafael, CA: The British Institute of Radiology.; 2010.
    1. Abdel-Aty H, Schulz-Menger J. Cardiovascular magnetic resonance T2-weighted imaging of myocardial edema in acute myocardial infarction. Recent Pat Cardiovascular Drug Discov 2007; 2: 63–8. doi: 10.2174/157489007779606167 - DOI - PubMed
    1. Pattanayak P, Bleumke DA. Tissue characterization of the myocardium: state of the art characterization by magnetic resonance and computed tomography imaging. Radiol Clin North Am 2015; 53: 413–23. - PMC - PubMed

MeSH terms