. 2018 Jul 5;14(7):e1007510.
doi: 10.1371/journal.pgen.1007510. eCollection 2018 Jul.

Genetic basis and evolution of rapid cycling in railway populations of tetraploid Arabidopsis arenosa

Affiliations

Genetic basis and evolution of rapid cycling in railway populations of tetraploid Arabidopsis arenosa

Pierre Baduel et al. PLoS Genet. .

Abstract

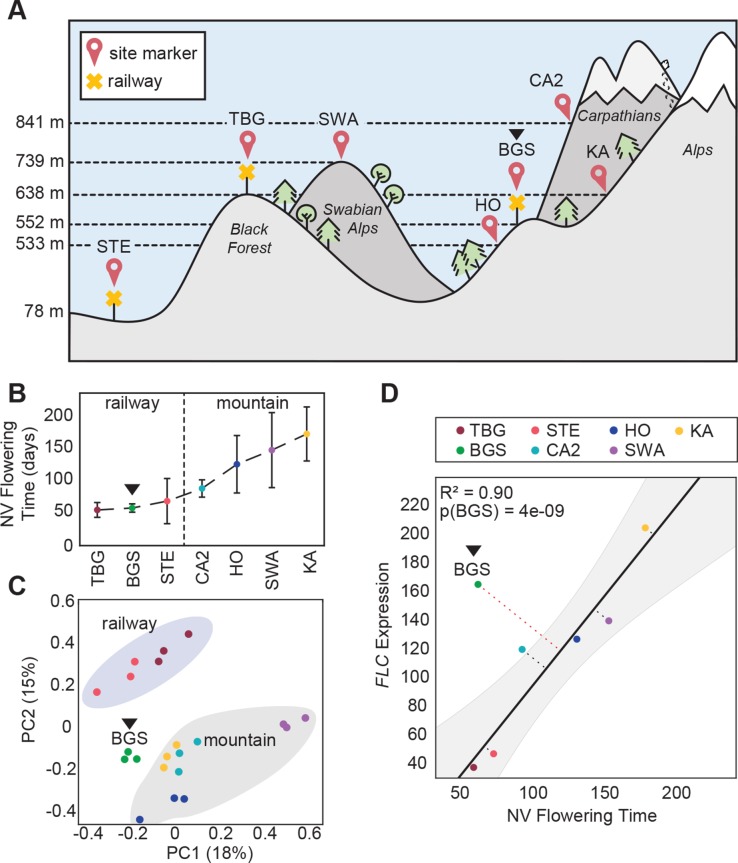
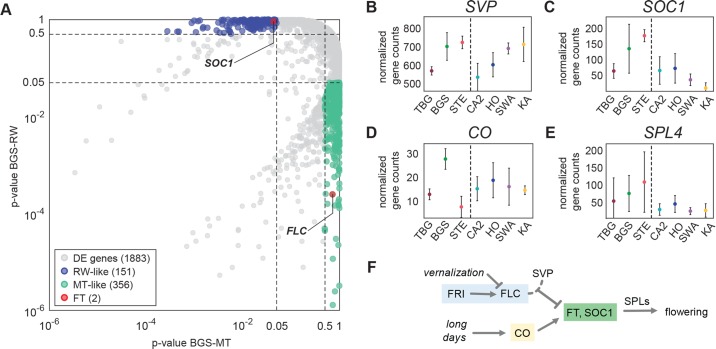
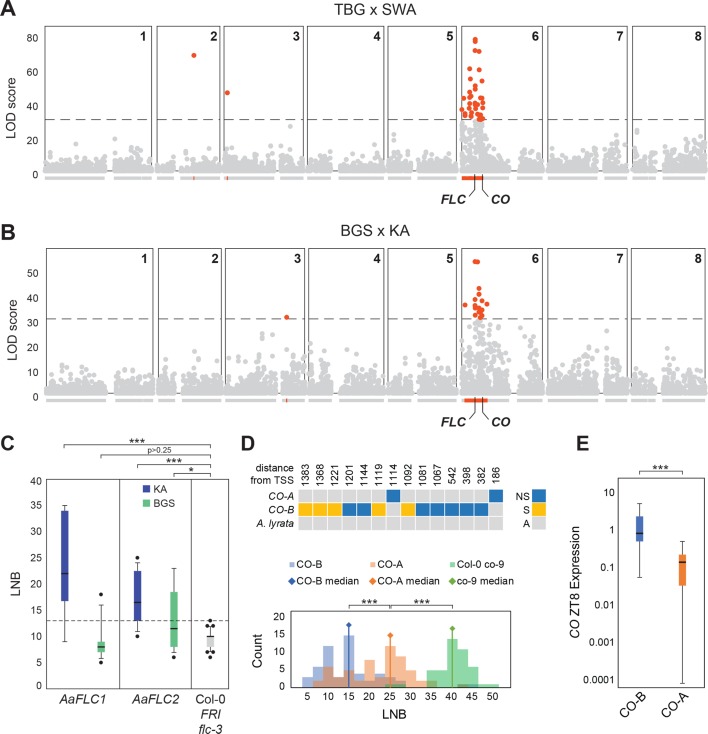
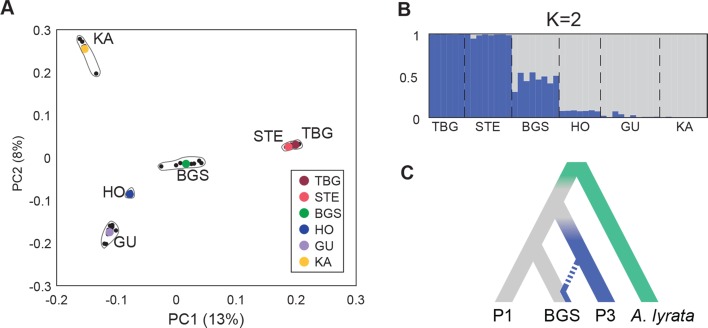
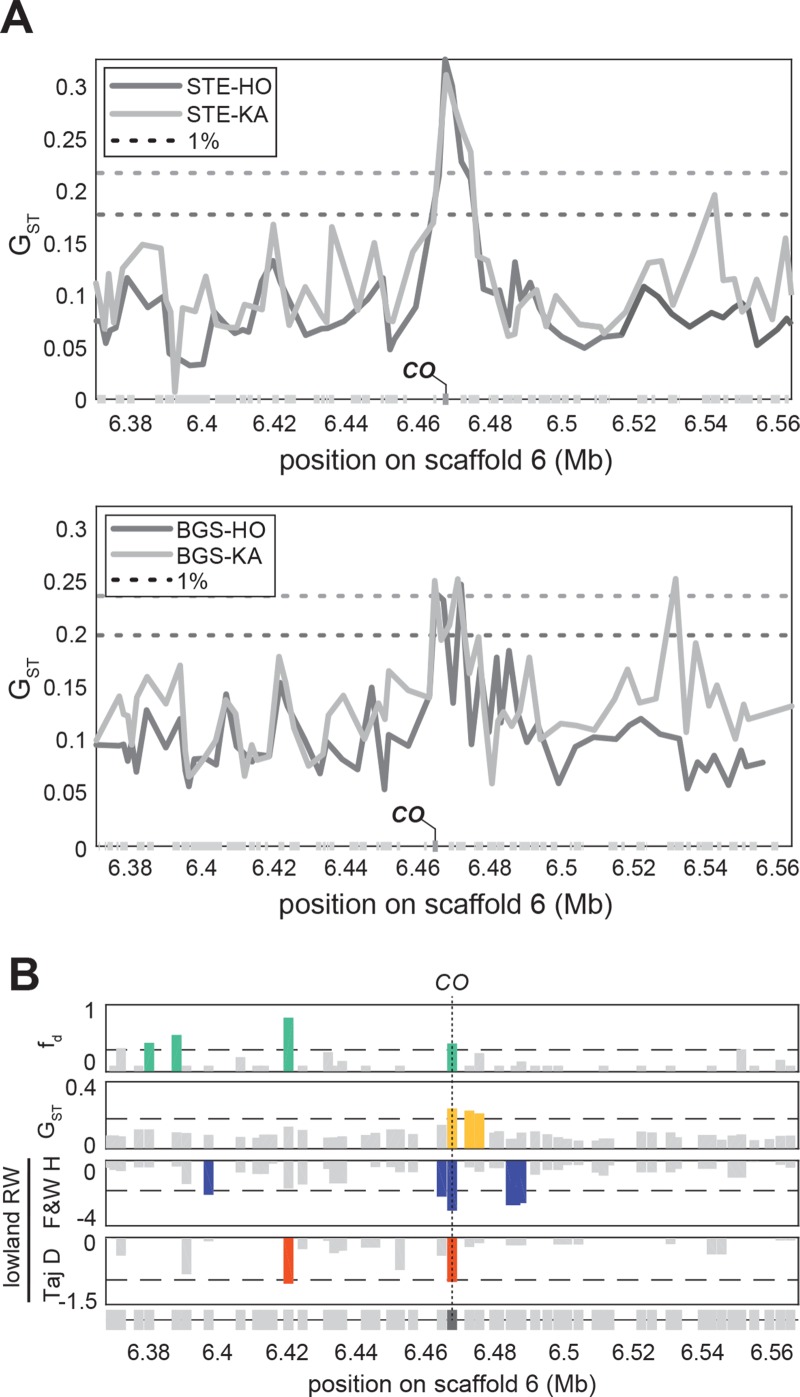
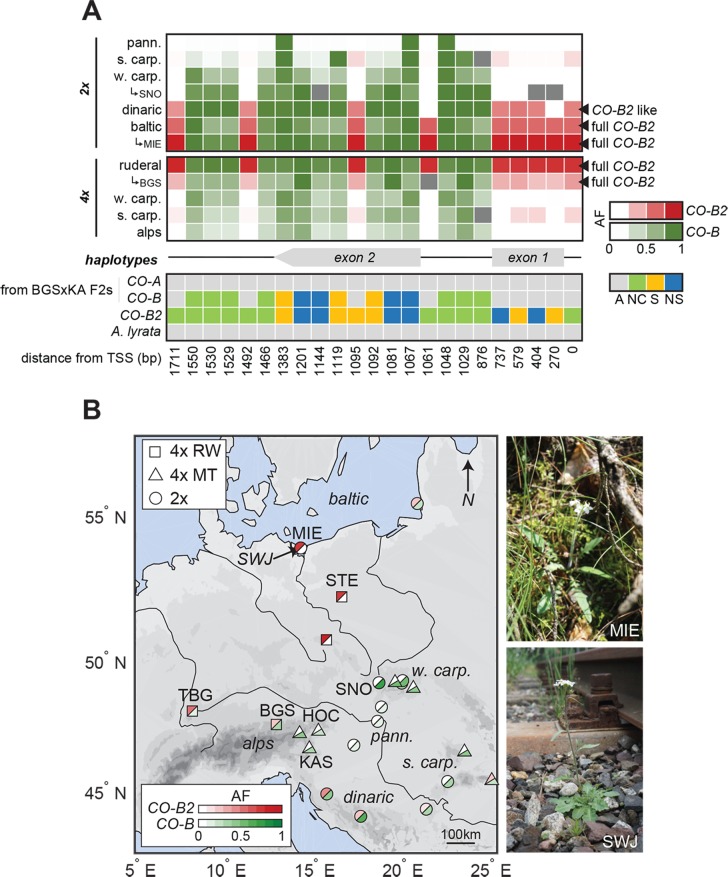
Spatially structured plant populations with diverse adaptations provide powerful models to investigate evolution. Human-generated ruderal habitats are abundant and low-competition, but are challenging for plants not adapted to them. Ruderal habitats also sometimes form networked corridors (e.g. roadsides and railways) that allow rapid long-distance spread of successfully adapted variants. Here we use transcriptomic and genomic analyses, coupled with genetic mapping and transgenic follow-up, to understand the evolution of rapid cycling during adaptation to railway sites in autotetraploid Arabidopsis arenosa. We focus mostly on a hybrid population that is likely a secondary colonist of a railway site. These mountain railway plants are phenotypically similar to their cosmopolitan cousins. We thus hypothesized that colonization primarily involved the flow of adaptive alleles from the cosmopolitan railway variant. But our data shows that it is not that simple: while there is evidence of selection having acted on introgressed alleles, selection also acted on rare standing variation, and new mutations may also contribute. Among the genes we show have allelic divergence with functional relevance to flowering time are known regulators of flowering, including FLC and CONSTANS. Prior implications of these genes in weediness and rapid cycling supports the idea that these are "evolutionary hotspots" for these traits. We also find that one of two alleles of CONSTANS under selection in the secondary colonist was selected from rare standing variation in mountain populations, while the other was introgressed from the cosmopolitan railway populations. The latter allele likely arose in diploid populations over 700km away, highlighting how ruderal populations could act as allele conduits and thus influence local adaptation.


Conflict of interest statement

The authors have declared that no competing interests exist.

Figures

Fig 1
Fig 1. BGS, a transcriptomic outlier among railway populations.
(A) Schematic representation of the habitats and altitudes where the railway populations (yellow cross markers): TBG, STE, and BGS (black triangle across all subfigures) and mountain populations: SWA, KA, HO, CA2 were sampled (GPS coordinates in S1 Table). (B) Vernalization response of populations reproduced from Baduel et al. as the difference between non-vernalized and vernalized flowering time. All railway populations present almost identical null vernalization responses. (C) First two principal components (PC1 and 2 with percentage of variance explained) of Principal Component Analysis (PCA) of the expression profiles of the 500-most variable genes. Railway and mountain populations group closely together by site-type. (D) Correlation analysis between FLC average expression and average non-vernalized (NV) flowering time. The linear regression model after exclusion of BGS is plotted in solid black. Grey area represents the 95% predicted confidence intervals around regression line. Dotted lines are the residual (orthogonal distance) for each data point from the regression line. The p-value for the likelihood to obtain a residual as observed with BGS from residual distribution is indicated as p(BGS).
Fig 2
Fig 2. Gene expression patterns in BGS.
(A) Railway (RW) and mountain (MT) like expression patterns in BGS measured by BGS-MT (x-axis) and BGS-RW (y-axis) comparisons among genes differentially expressed (DE) between mountain and lowland railway populations. (B, C, D, E) Normalized expression levels of SVP (B), SOC1 (C), CO (D), and SPL4 (E) across populations (error bars: SD). (F) Schematic representation of the interaction between vernalization (blue) and photoperiod (yellow) pathways. On one side the vernalization pathway represses the expression of flowering activators FT and SOC1 through the FLC-SVP complex, while on the other the photoperiod pathway integrator CO activates them. Among the cascade of downstream targets of SOC1 and CO are SPL factors including, SPL4 [74].
Fig 3
Fig 3. Phenotypic impact of FLC and CO in BGS.
(A-B) BSA mapping of flowering time in TBG x SWA and BGS x KA F2s. Distribution of single-marker LOD scores for time to bolting across the 8 scaffolds in TBG x SWA (A) and BGS x KA F2s (B) above the gene models for each scaffold. High LOD (LOD>30) markers and genes within high-LOD regions are highlighted in red. (C) Boxplot of flowering time measured by leaf number at bolting (LNB) of Kanamycin-resistant T1s with 35S-driven cDNAs of both AaFLC1 (blue) and AaFLC2 (green) from KA (left panel) and BGS (middle panel). For comparison the flowering time of the FRI flc-3 Col-0 background line is plotted in the third panel in grey. The latest flowering time observed in the background line (LNB = 13) is represented by a dotted line. The numbers above each box indicate the correlations between LNB and FLC expression (S2 Fig). Two late-flowering transgenic individuals obtained with BGS AaFLC1 that nevertheless have low FLC expression are indicated with black triangles. (D) Distribution of flowering time (LNB) of Kanamycin-resistant T1s with genomic constructs of CO-A (orange) and CO-B (blue) which differ by 14 SNPs within their CDS (upper panel) compared to co-9 mutants (green). The medians of each distribution are indicated by diamonds. (E) Normalized CO expression at ZT8 of CO-A (orange) and CO-B (blue) T1s. (* = p < 0.05, ** = p < 0.01; *** = p < 0.001).
Fig 4
Fig 4. BGS shares genomic variation with lowland railway and mountain backgrounds.
(A) First two principal components (PC1 and 2 with percentage of variance explained) of Principal Component Analysis (PCA) of the genomes from 47 re-sequenced individuals of three railway (TBG, STE, BGS) and three mountain (HO, GU, KA) populations. (B) Genomic clustering of individuals using STRUCTURE with K = 2. Each individual is represented by a single vertical line broken into K = 2 segment with length of each colored bar proportional to the posterior probability of belonging to each cluster. (C) Population history model used for ABBA-BABA evaluation of introgression fraction within BGS, with background and donor populations P1 and P3 and A. lyrata used as outgroup.
Fig 5
Fig 5. Railway-specific selection on a highly-differentiated railway haplotype of CONSTANS.
(A) Marks of differentiation between one lowland railway population STE (upper panel) or BGS (lower panel) and two mountain populations (HO and KA) evaluated with GST across CO region. Dotted lines are respective genome-wide 1% threshold levels. (B) Gene-wise marks of introgression (f^d), railway-mountain differentiation (GST), and railway-specific positive selection (Fay & Wu’s H, and Tajima’s D) across CO region. For each gene, only the least extreme values are represented. Dotted lines are 3*f^d(KA,BGS,TBG) (upper panel) or most extreme genome-wide 5% threshold levels.
Fig 6
Fig 6. Origin of railway CO-B2 in association with high-order CNVs found in diploids.
(A) Upper panel: Average allele-frequency of 23 high-frequency railway CO variants in 5 diploid and 4 tetraploid clades. Population frequencies are detailed for SNO, MIE, and BGS which were differing significantly from their respective clades. High allele frequencies of the 9 signature railway polymorphisms (CO-B2 allele) are in red and of the 14 CO-B polymorphisms in green. Lower panel: Comparison of the 3 CO haplotypes (CO-A, CO-B, CO-B2) along the 23 high-frequency railway CO variants color-coded by impact on the coding sequence (non-synonymous in blue, synonymous in yellow, and non-coding in green) compared to A. lyrata (grey). (B) Map of 11 tetraploid and 12 diploid populations from Monnahan et al. color-coded by their average frequency of CO-B2 signature polymorphisms in red and CO-B polymorphisms in green. Pictures of diploid MIE and the adjacent tetraploid railway population SWJ during July 2017 field collections from likely interploidy introgression region on the Baltic.

Similar articles

Cited by

References

    1. Hall MC, Willis JH. Divergent selection on flowering time contributes to local adaptation in Mimulus guttatus populations. Evolution. 2006. December;60(12):2466–77. - PubMed
    1. Franks SJ, Sim S, Weis AE. Rapid evolution of flowering time by an annual plant in response to a climate fluctuation. Proc Natl Acad Sci U S A. 2007. January 23;104(4):1278–82. 10.1073/pnas.0608379104 - DOI - PMC - PubMed
    1. Fox GA. Drought and the evolution of flowering time in desert annuals. American Journal of Botany. 1990. 77: 1508–18.
    1. Sherrard ME, Maherali H. The adaptive significance of drought escape in Avena barbata, an annual grass. Evolution (N Y). 2006. December;60(12):2478–89. - PubMed
    1. Mckay JK, Richards JH, Mitchell-Olds T. Genetics of drought adaptation in Arabidopsis thaliana: I. Pleiotropy contributes to genetic correlations among ecological traits. Mol Ecol. 2003. May;12(5):1137–51. - PubMed

Publication types