. 2018 Jul 5;14(7):e1006303.
doi: 10.1371/journal.pcbi.1006303. eCollection 2018 Jul.

Paxillin phosphorylation at serine 273 and its effects on Rac, Rho and adhesion dynamics

Affiliations

Paxillin phosphorylation at serine 273 and its effects on Rac, Rho and adhesion dynamics

Kaixi Tang et al. PLoS Comput Biol. .

Abstract

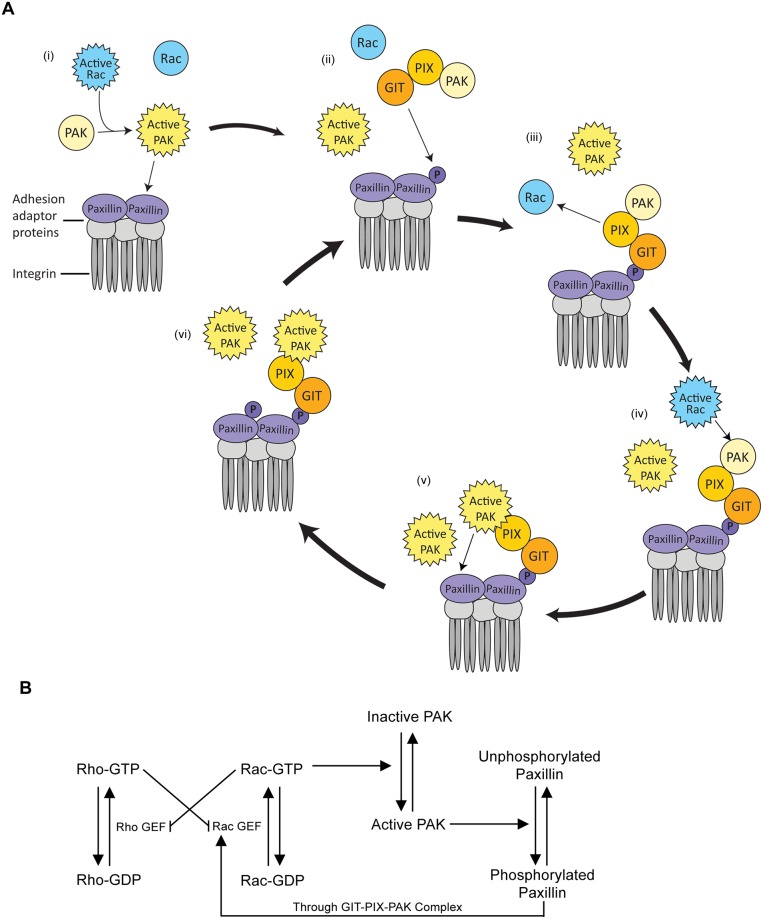
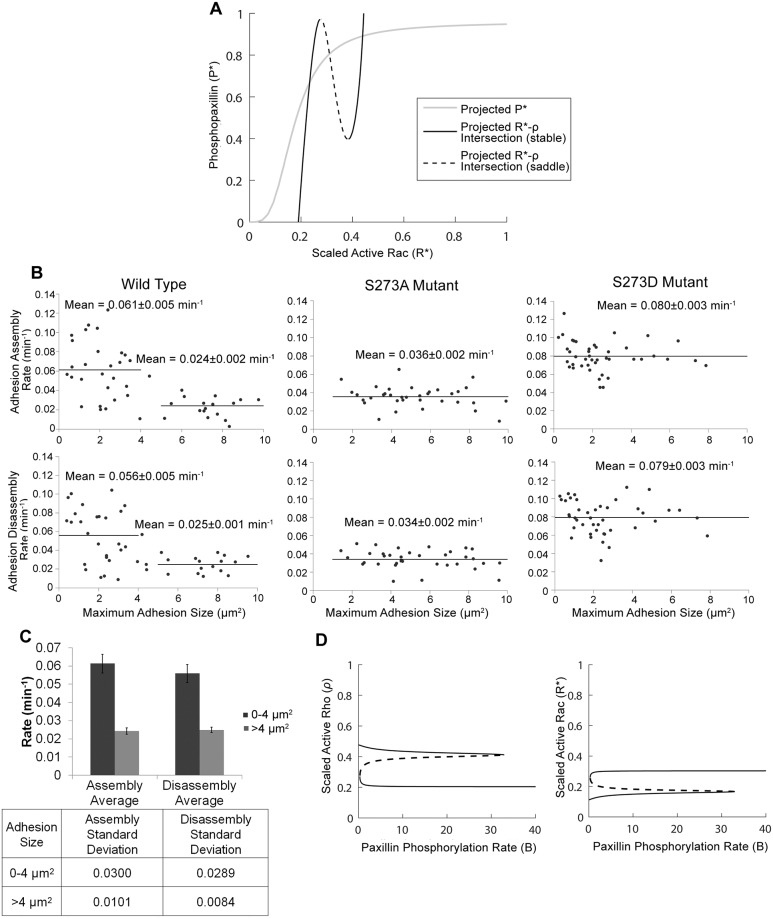
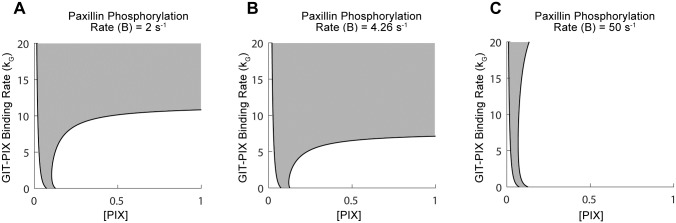
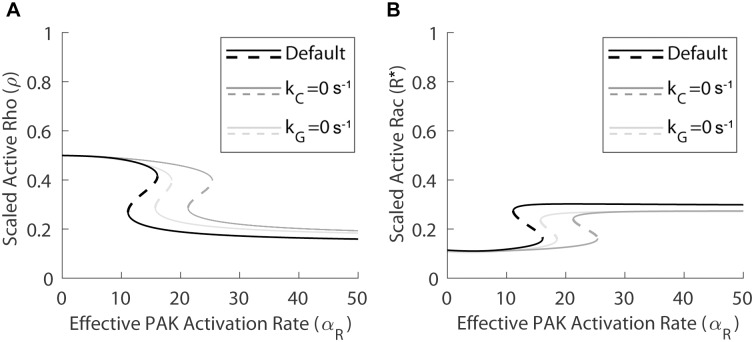
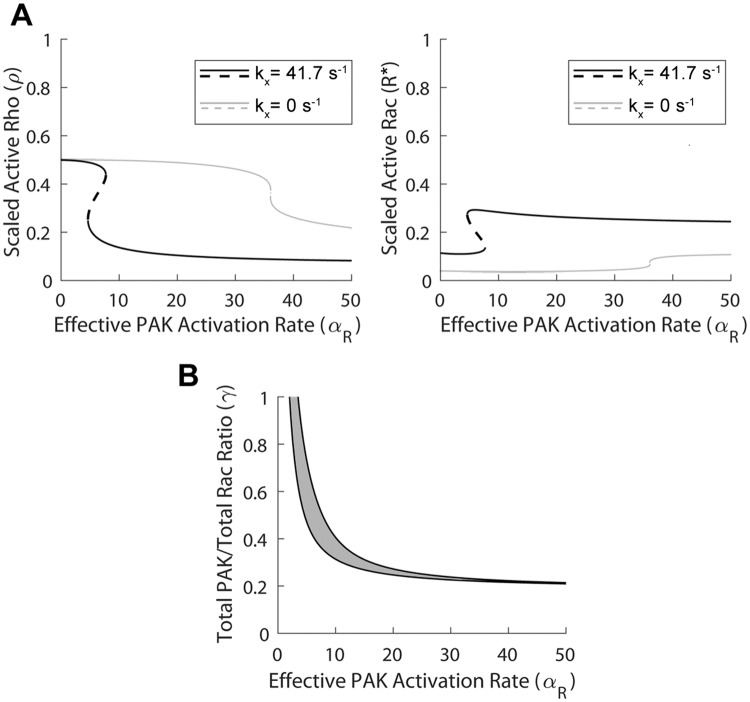
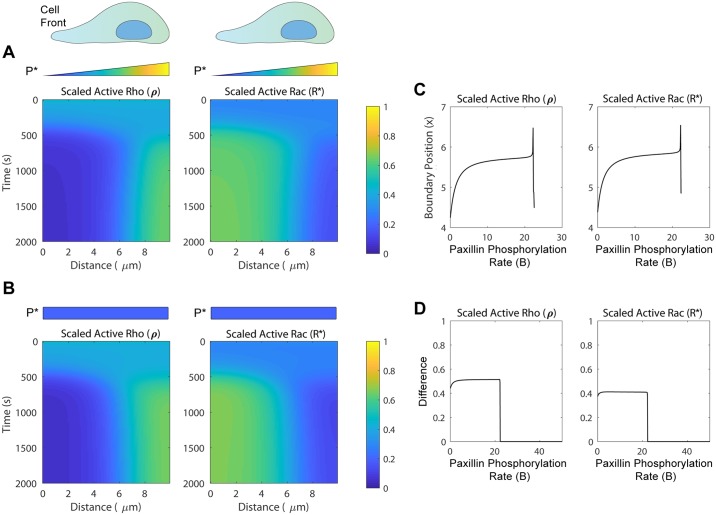
Focal adhesions are protein complexes that anchor cells to the extracellular matrix. During migration, the growth and disassembly of these structures are spatiotemporally regulated, with new adhesions forming at the leading edge of the cell and mature adhesions disassembling at the rear. Signalling proteins and structural cytoskeletal components tightly regulate adhesion dynamics. Paxillin, an adaptor protein within adhesions, is one of these proteins. Its phosphorylation at serine 273 (S273) is crucial for maintaining fast adhesion assembly and disassembly. Paxillin is known to bind to a GIT1-βPIX-PAK1 complex, which increases the local activation of the small GTPase Rac. To understand quantitatively the behaviour of this system and how it relates to adhesion assembly/disassembly, we developed a mathematical model describing the dynamics of the small GTPases Rac and Rho as determined by paxillin S273 phosphorylation. Our model revealed that the system possesses bistability, where switching between uninduced (active Rho) and induced (active Rac) states can occur through a change in rate of paxillin phosphorylation or PAK1 activation. The bistable switch is characterized by the presence of memory, minimal change in the levels of active Rac and Rho within the induced and uninduced states, respectively, and the limited regime of monostability associated with the uninduced state. These results were validated experimentally by showing the presence of bimodality in adhesion assembly and disassembly rates, and demonstrating that Rac activity increases after treating Chinese Hamster Ovary cells with okadaic acid (a paxillin phosphatase inhibitor), followed by a modest recovery after 20 min washout. Spatial gradients of phosphorylated paxillin in a reaction-diffusion model gave rise to distinct regions of Rac and Rho activities, resembling polarization of a cell into front and rear. Perturbing several parameters of the model also revealed important insights into how signalling components upstream and downstream of paxillin phosphorylation affect dynamics.


Conflict of interest statement

The authors have declared that no competing interests exist.

Figures

Fig 1
Fig 1. Diagram illustrating the molecular interactions of paxillin with the GIT-PIX-PAK complex and the Rac/Rho crosstalk.
(A) In the cycle of paxillin dynamics, multiple steps are involved: i) Active Rac binds to and activates PAK, which in turn phosphorylates paxillin at S273. (ii) Phosphorylated paxillin, Paxp, binds the GIT-PIX-PAK complex. (iii) Paxp-bound PIX activates additional Rac proteins. (iv) Newly activated Rac phosphorylates PAK present within the GIT-PIX-PAK complex. (v) PAK present within the GIT-PIX-PAK complex phosphorylates neighbouring paxillin molecules. (vi) Phosphorylation of a neighbouring monomeric paxillin promotes its binding to GIT-PIX-PAK complexes, closing the positive feedback loop of paxillin phosphorylation, Rac activation, and PAK activation. (B) Rac and Rho both cycle between inactive (GDP-bound) and active (GTP-bound) forms, where activation occurs by GTPase-specific GEFs (including PIX), and inactivation occurs by GTPase-specific GAPs. Rac and Rho are also assumed to mutually inhibit each other through nonspecific downregulation of each other’s GTPase-specific GEFs. Rac activation/inactivation is coupled to paxillin phosphorylation by PAK activation and GIT-PIX-PAK complex formation as described by the cycle in A.
Fig 2
Fig 2. The effects of initial level of phosphorylated paxillin (P*) and maximum paxillin-phosphorylation rate (B).
(A) Black (solid and dashed) lines represent the projected intersections of the active Rho ρ- and active Rac R*-nullsurfaces on the P*- R* plane, while gray line represents the projection of the P*-nullsurface on the same plane. The intersections of the solid (dashed) black lines (line) with the gray line represent the projected stable steady states (saddle). The slope of the dashed back line determines the sensitivity of the model to perturbations in the initial value of P*. Specifically, if the gray line is inclined, and the initial values of ρ and R* are chosen to be fixed near the dashed line of the P*-R* plane, then the system will be sensitive to vertical changes in the initial value of P*. (B) Adhesion assembly (top row) and disassembly (bottom row) rates in CHO-K1 cells expressing WT-paxillin (left panels), paxillin S273A mutant (middle panels), or paxillin S273D mutant (right panels), plotted in terms of maximum adhesion size. Cells expressing WT-paxillin show two subpopulations of adhesions exhibiting distinct assembly and disassembly rates: slow assembly/disassembly for large adhesions and fast assembly/disassembly for small adhesions. Cells expressing either S273A or S273D mutant have only one of these two populations: slow or fast, respectively. (C) Mean ± standard deviation (upper) along with the standard deviation (lower) of assembly and disassembly rates of adhesions by size in CHO-K1 cells expressing WT paxillin-EGFP. Two asterisks (**) indicate p < 0.01 by the two-tailed, unequal variance t-test. (D) Bifurcation diagrams of ρ (left) and R* (right) with respect to B, showing the steady state levels of these two variables in the induced (elevated R*) and uninduced (elevated ρ) states; solid lines represent stable steady states, dashed lines represent saddle points. Bistability persists for B ∈ (0.3,32.7), whereas monostable regimes of uninduced and induced states lie to the left and right of the bistable regime, respectively.
Fig 3
Fig 3. The effects of free PIX concentration ([PIX]) on bistability.
Two-parameter bifurcation of the model with respect to the GIT-PIX binding rate, kG, and [PIX] demarcating the regime of bistability (gray) and monostability (white) associated with the uninduced (to the left of the bistable regime) and induced (to the right of the bistable regime) states. The regime of bistability shrinks as the value of maximum paxillin-phosphorylation rate B increases from 2 s-1 (A), to 4.26 s-1 (B) to 50 s-1 (C). The boundary of the bistable regime is defined by the two curves of saddle nodes.
Fig 4
Fig 4. The effect of varying PAK-RacGTP binding rate (αR) depends on the Paxp-GIT and GIT-PIX interactions.
Bifurcation diagrams of active Rho ρ (left) and active Rac R* (right) with respect to αR, showing the steady state levels of these two variables in the induced (elevated R*) and uninduced (elevated ρ) states; solid lines represent stable steady states, dashed lines represent saddle points. Under normal conditions (black curves), the system is bistable for αR ∈ (11.1, 16.1). After setting kC = 0 to eliminate the Paxp-GIT interaction (dark gray curves), the bistable regime shifts rightward to (21.3, 25.4), making it more difficult (easier) to reach the induced (uninduced) state. After setting kG = 0 to eliminate the GIT-PIX interaction (light gray curves), the bistable regime also shifts rightward to (15.7, 18.5).
Fig 5
Fig 5. Dependence of PAK activation rate (αR) on [PAKtot]-to-[Ractot] ratio (γ) and PIX-PAK binding rate (kX).
(A) Bifurcation diagrams of active Rho ρ (left) and active Rac R* (right) with respect to αR when γ = 0.5, showing the steady state levels of these two variables in the induced (elevated R*) and uninduced (elevated ρ) states; solid lines represent stable steady states, dashed lines represent saddle points. Although the induced state is conserved for both kX = 41.7 s-1 (default value) (black lines) and kX = 0 s-1 (gray lines), bistability regime in the latter case is much smaller and it exhibits a significant rightward shift. (B) Two-parameter bifurcation of the model with respect to αR and γ, demarcating the regimes of bistability (gray) and monostability (white) associated with the uninduced (to the left of the bistable regime) and induced (to the right of the bistable regime) states. The boundary of the bistable regime is defined by the two curves of saddle nodes. Notice that when γ is large, PIX-PAK binding plays a smaller role in causing the induced state (compared to when the value of γ is smaller).
Fig 6
Fig 6. Heat-maps showing polarization in the spatiotemporal dynamics of active Rho (ρ) and active Rac (R*).
(A) Simulation of the spatiotemporal model, starting with uniform initial levels of active Rho ρ and active Rac R*, and a sigmoidally decreasing gradient in initial level of phosphopaxillin P* with respect to x (i.e., high near x = 0 μm and low near x = L μm). (B) Simulation of the spatiotemporal model, with uniform initial levels of ρ, R* and P*, but with a sigmoidally decreasing maximum paxillin-phosphorylation rate B with respect to x (i.e., high near x = 0 μm and decays linearly to 0 as x increases). In both (A) and (B), active Rho ρ (left) and active Rac R* (right) have two distinct regions of activity which persist, indicating a polarization-like effect with a front (near x = 0 μm) and back (near x = L μm). (C) The B-dependent location of the boundary between the two polarized regions of Rac and Rho activity seen in (A). The boundary is defined as the position in space where the level of active Rho ρ (left), or active Rac R* (right) is halfway between their maximum and minimum levels. This boundary shifts to the right (i.e. towards the back of the “cell”) as B is increased until approximately B = 22.2 s-1, where it disappears due to the loss of active Rac/Rho gradient. (D) The B-dependent difference in the levels of active Rho ρ (left) and active Rac R* (right) obtained in the two polarized regions of panel (A). Notice how the difference disappears at B = 22.2 s-1, indicating loss of polarity.

Similar articles

Cited by

References

    1. Jiang J, Li L, He Y, Zhao M. Collective cell migration: Implications for wound healing and cancer invasion. Burn Trauma. 2013;1: 21 10.4103/2321-3868.113331 - DOI - PMC - PubMed
    1. Scarpa E, Mayor R. Collective cell migration in development. J Cell Biol. 2016;212: 143–155. 10.1083/jcb.201508047 - DOI - PMC - PubMed
    1. Friedl P, Wolf K. Plasticity of cell migration: A multiscale tuning model. Journal of Cell Biology. 2010. pp. 11–19. 10.1083/jcb.200909003 - DOI - PMC - PubMed
    1. Parri M, Chiarugi P. Rac and Rho GTPases in cancer cell motility control. Cell Communication and Signaling. 2010. 10.1186/1478-811X-8-23 - DOI - PMC - PubMed
    1. Yamaguchi H, Wyckoff J, Condeelis J. Cell migration in tumors. Current Opinion in Cell Biology. 2005. pp. 559–564. 10.1016/j.ceb.2005.08.002 - DOI - PubMed

Publication types