

B lymphocytes can be activated to act as antigen presenting cells to promote anti-tumor responses
- PMID: 29975708
- PMCID: PMC6033398
- DOI: 10.1371/journal.pone.0199034
B lymphocytes can be activated to act as antigen presenting cells to promote anti-tumor responses
Abstract
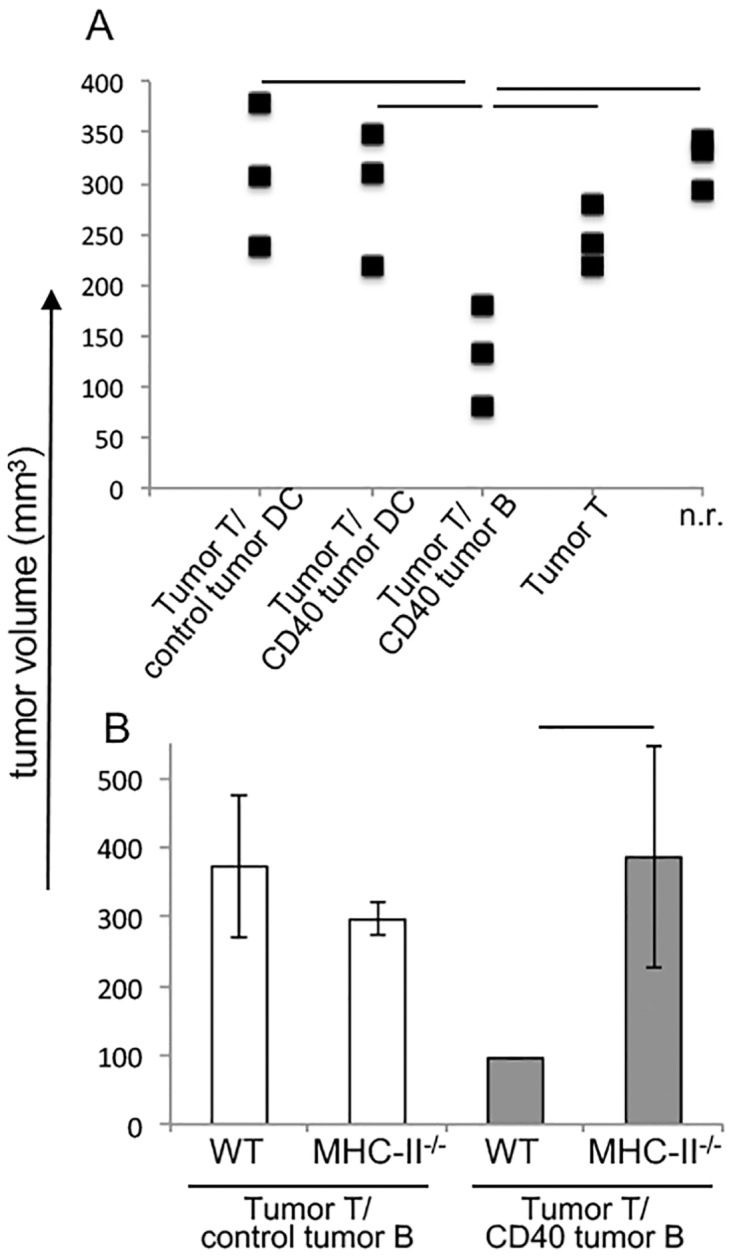
Immune evasion by tumors includes several different mechanisms, including the inefficiency of antigen presenting cells (APCs) to trigger anti-tumor T cell responses. B lymphocytes may display a pro-tumoral role but can also be modulated to function as antigen presenting cells to T lymphocytes, capable of triggering anti-cancer immune responses. While dendritic cells, DCs, are the best APC population to activate naive T cells, DCs or their precursors, monocytes, are frequently modulated by tumors, displaying a tolerogenic phenotype in cancer patients. In patients with cervical cancer, we observed that monocyte derived DCs are tolerogenic, inhibiting allogeneic T cell activation compared to the same population obtained from patients with precursor lesions or cervicitis. In this work, we show that B lymphocytes from cervical cancer patients respond to treatment with sCD40L and IL-4 by increasing the CD80+CD86+ population, therefore potentially increasing their ability to activate T cells. To test if B lymphocytes could actually trigger anti-tumor T cell responses, we designed an experimental model where we harvested T and B lymphocytes, or dendritic cells, from tumor bearing donors, and after APC stimulation, transplanted them, together with T cells into RAG1-/- recipients, previously injected with tumor cells. We were able to show that anti-CD40 activated B lymphocytes could trigger secondary T cell responses, dependent on MHC-II expression. Moreover, we showed that dendritic cells were resistant to the anti-CD40 treatment and unable to stimulate anti-tumor responses. In summary, our results suggest that B lymphocytes may be used as a tool for immunotherapy against cancer.
Conflict of interest statement
The authors have declared that no competing interests exist.
Figures


Similar articles
-
Simultaneous targeting of CD3 on T cells and CD40 on B or dendritic cells augments the antitumor reactivity of tumor-primed lymph node cells.J Immunol. 2005 Aug 1;175(3):1424-32. doi: 10.4049/jimmunol.175.3.1424. J Immunol. 2005. PMID: 16034078
-
The linkage of innate to adaptive immunity via maturing dendritic cells in vivo requires CD40 ligation in addition to antigen presentation and CD80/86 costimulation.J Exp Med. 2004 Jun 21;199(12):1607-18. doi: 10.1084/jem.20040317. Epub 2004 Jun 14. J Exp Med. 2004. PMID: 15197224 Free PMC article.
-
Evaluation of B7-1 (CD80) and B7-2 (CD86) costimulatory molecules and dendritic cells on the immune response in leprosy.Nihon Hansenbyo Gakkai Zasshi. 2001 Feb;70(1):15-24. doi: 10.5025/hansen.70.15. Nihon Hansenbyo Gakkai Zasshi. 2001. PMID: 11244783
-
Molecular mechanism and function of CD40/CD40L engagement in the immune system.Immunol Rev. 2009 May;229(1):152-72. doi: 10.1111/j.1600-065X.2009.00782.x. Immunol Rev. 2009. PMID: 19426221 Free PMC article. Review.
-
Treatment of autoimmunity by inhibition of T cell costimulation.Adv Exp Med Biol. 2001;490:113-7. doi: 10.1007/978-1-4615-1243-1_12. Adv Exp Med Biol. 2001. PMID: 11505969 Review. No abstract available.
Cited by
-
Identification of the Expression Patterns and Potential Prognostic Role of 5-Methylcytosine Regulators in Hepatocellular Carcinoma.Front Cell Dev Biol. 2022 Feb 16;10:842220. doi: 10.3389/fcell.2022.842220. eCollection 2022. Front Cell Dev Biol. 2022. PMID: 35252205 Free PMC article.
-
B Cells in Neuroinflammation: New Perspectives and Mechanistic Insights.Cells. 2021 Jun 26;10(7):1605. doi: 10.3390/cells10071605. Cells. 2021. PMID: 34206848 Free PMC article. Review.
-
Fcγ-Receptor-Independent Controlled Activation of CD40 Canonical Signaling by Novel Therapeutic Antibodies for Cancer Therapy.Antibodies (Basel). 2024 Apr 18;13(2):31. doi: 10.3390/antib13020031. Antibodies (Basel). 2024. PMID: 38651411 Free PMC article.
-
Decoding tumor-infiltrating lymphocytes heterogeneity in ductal carcinoma in situ: immune microenvironment dynamics and prognostic insights.Discov Oncol. 2025 Jul 28;16(1):1435. doi: 10.1007/s12672-025-03288-3. Discov Oncol. 2025. PMID: 40721545 Free PMC article. Review.
-
Dual Effect of Immune Cells within Tumour Microenvironment: Pro- and Anti-Tumour Effects and Their Triggers.Cancers (Basel). 2022 Mar 25;14(7):1681. doi: 10.3390/cancers14071681. Cancers (Basel). 2022. PMID: 35406451 Free PMC article. Review.
References
-
- Walboomers J.M., Jacobs M.V., Manos M.M., Bosch F.X., Kummer J.A., Shah K.V., et al. Human papillomavirus is a necessary cause of invasive cervical cancer worldwide. J Pathol. 1999; 189:12–9. doi: 10.1002/(SICI)1096-9896(199909)189:1<12::AID-PATH431>3.0.CO;2-F - DOI - PubMed
-
- IARC monographs on Human Papillomavirus, volume 90 Lyon, France, IARC, 2007.
-
- Schiffman M., Wentzensen N. Human papillomavirus (HPV) infection and the multi-stage carcinogenesis of cervical cancer. Cancer Epidemiol Biomarkers Prev. 2013; 22: 553–560. doi: 10.1158/1055-9965.EPI-12-1406 - DOI - PMC - PubMed
-
- Boccardo E., Lepique A.P., Villa L.L. The role of inflammation in HPV carcinogenesis. Carcinogenesis. 2010; 31:1905–12. doi: 10.1093/carcin/bgq176 - DOI - PubMed
-
- Piersma S.J., Jordanova E.S., van Poelgeest M.I., Kwappenberg K.M., van der Hulst J.M., Drijfhout J.W., et al. High number of intraepithelial CD8+ tumor-infiltrating lymphocytes is associated with the absence of lymph node metastases in patients with large early-stage cervical cancer. Cancer Res. 2007; 67:354–61. doi: 10.1158/0008-5472.CAN-06-3388 - DOI - PubMed
Publication types
MeSH terms
Substances
LinkOut - more resources
Full Text Sources
Other Literature Sources
Medical
Molecular Biology Databases
Research Materials
Miscellaneous
