

The role of mitochondria in anchoring dynein to the cell cortex extends beyond clustering the anchor protein
- PMID: 29976118
- PMCID: PMC6110599
- DOI: 10.1080/15384101.2018.1480226
The role of mitochondria in anchoring dynein to the cell cortex extends beyond clustering the anchor protein
Abstract
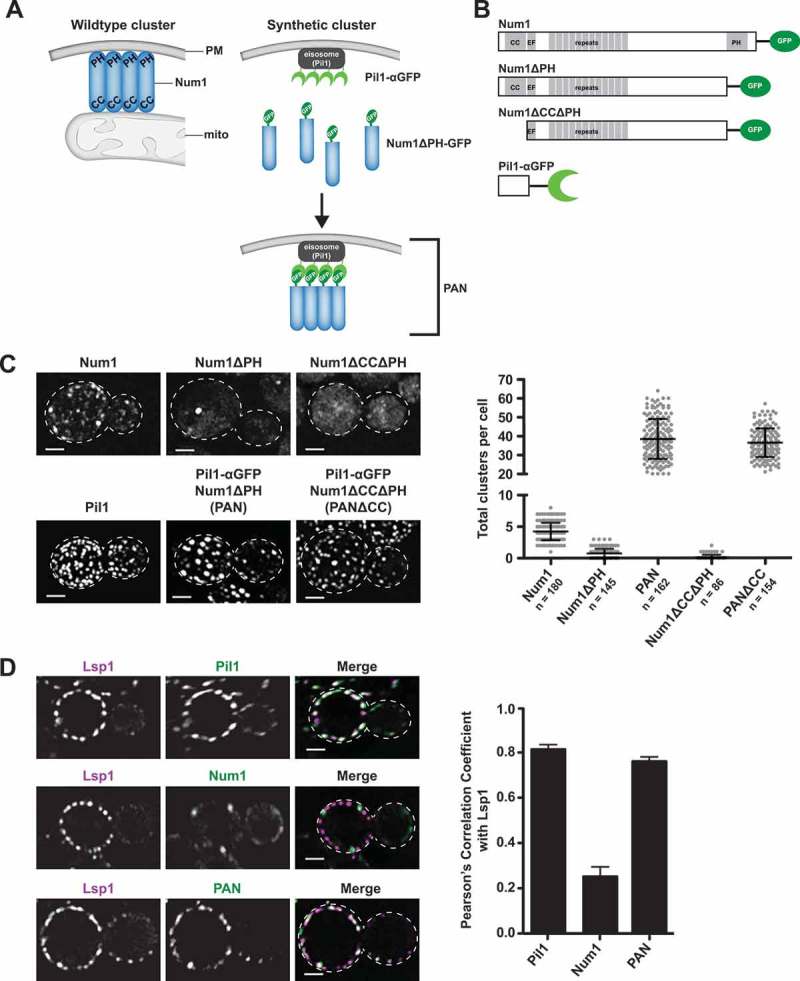
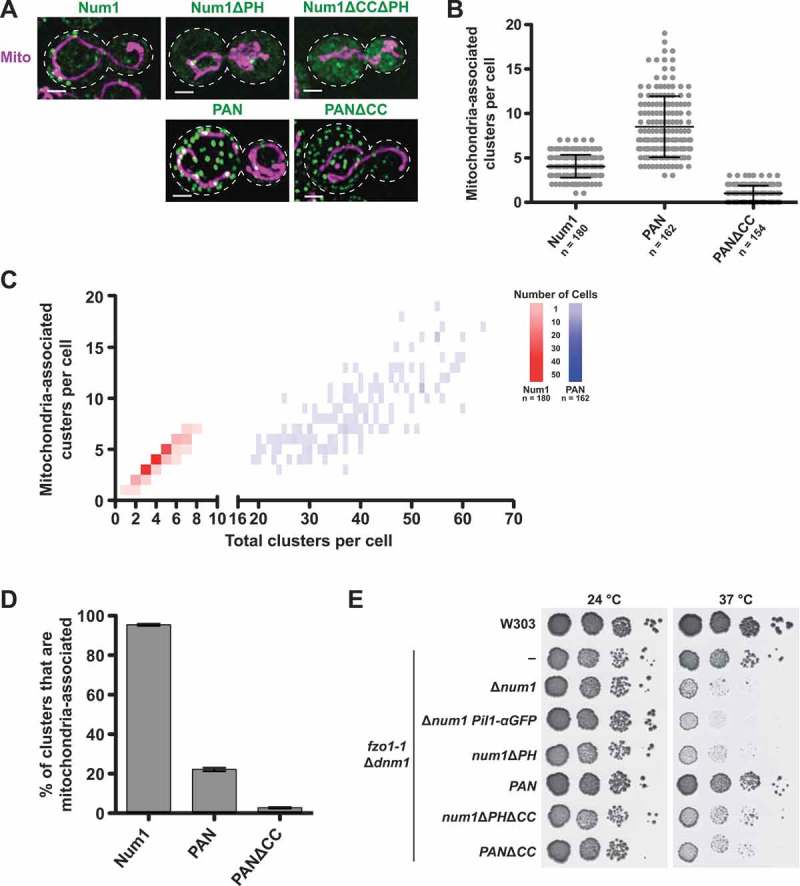
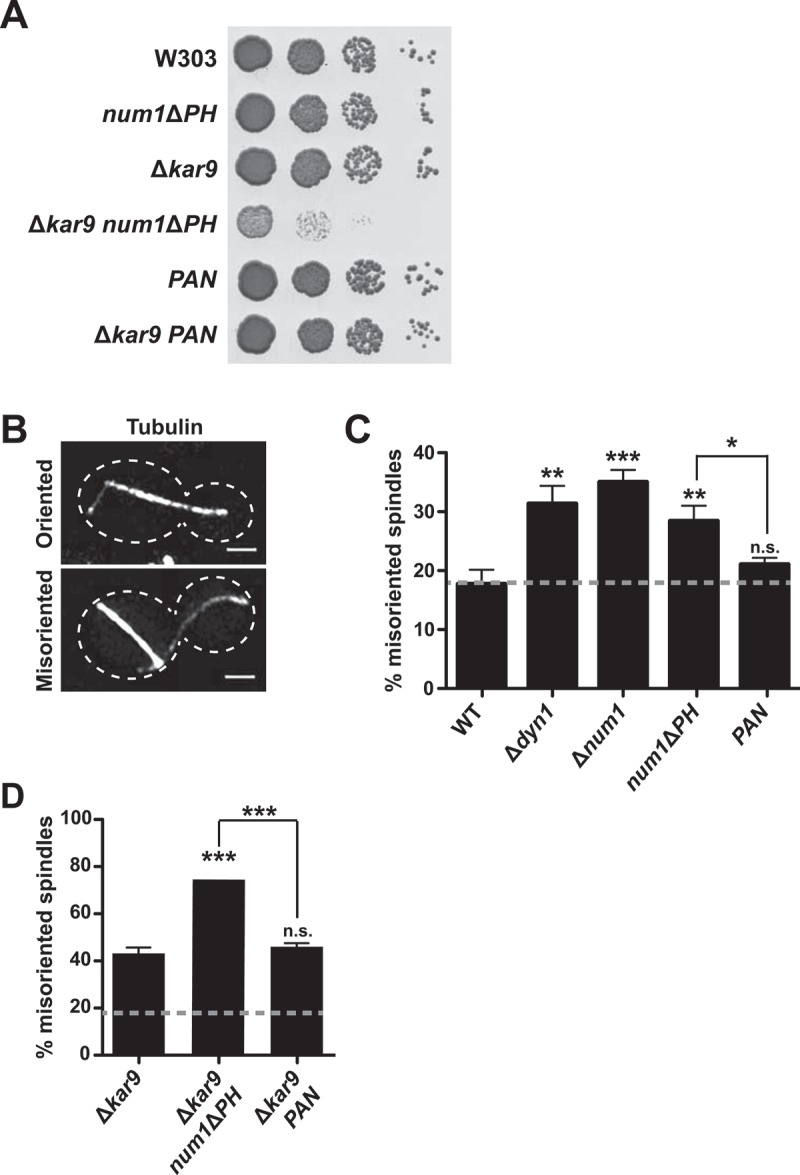
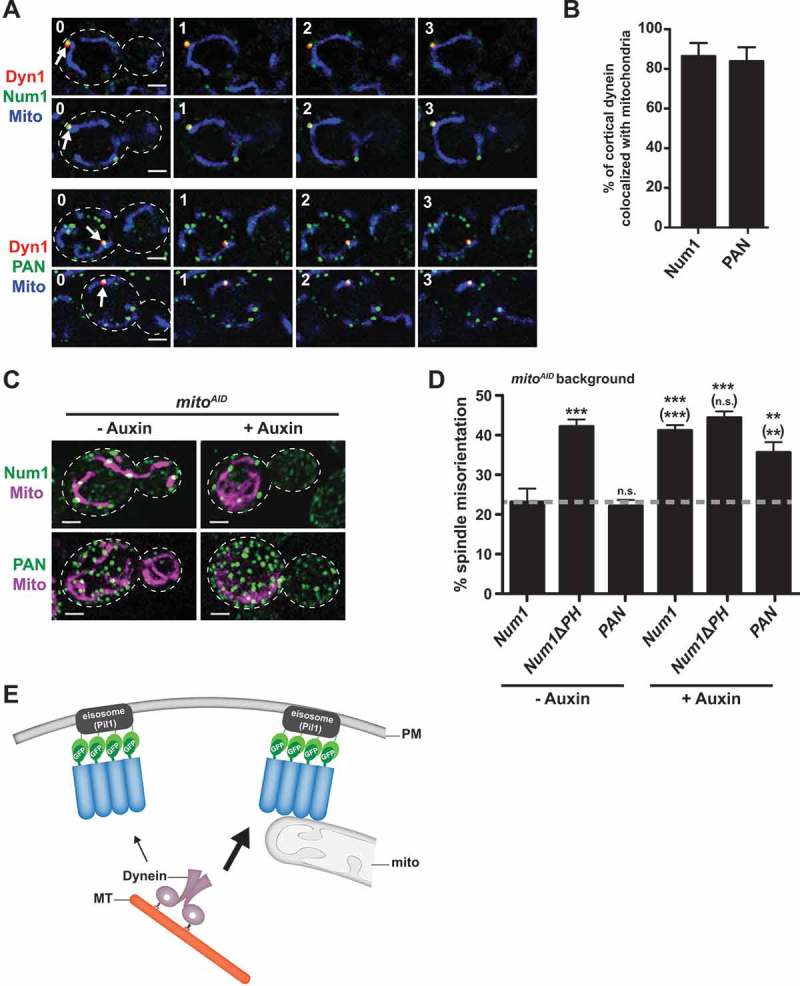
Organelle distribution is regulated over the course of the cell cycle to ensure that each of the cells produced at the completion of division inherits a full complement of organelles. In yeast, the protein Num1 functions in the positioning and inheritance of two essential organelles, mitochondria and the nucleus. Specifically, Num1 anchors mitochondria as well as dynein to the cell cortex, and this anchoring activity is required for proper mitochondrial distribution and dynein-mediated nuclear inheritance. The assembly of Num1 into clusters at the plasma membrane is critical for both of its anchoring functions. We have previously shown that mitochondria drive the assembly of Num1 clusters and that these mitochondria-assembled Num1 clusters serve as cortical attachment sites for dynein. Here we further examine the role for mitochondria in dynein anchoring. Using a GFP-αGFP nanobody targeting system, we synthetically clustered Num1 on eisosomes to bypass the requirement for mitochondria in Num1 cluster formation. Utilizing this system, we found that mitochondria positively impact the ability of synthetically clustered Num1 to anchor dynein and support dynein function even when mitochondria are no longer required for cluster formation. Thus, the role of mitochondria in regulating dynein function extends beyond simply concentrating Num1; mitochondria likely promote an arrangement of Num1 within a cluster that is competent for dynein anchoring. This functional dependency between mitochondrial and nuclear positioning pathways likely serves as a mechanism to order and integrate major cellular organization systems over the course of the cell cycle.
Keywords: Mitochondrial positioning; dynein; inter-organelle contact sites.
Figures
Similar articles
-
Hierarchical integration of mitochondrial and nuclear positioning pathways by the Num1 EF hand.Mol Biol Cell. 2022 Feb 1;33(2):ar20. doi: 10.1091/mbc.E21-12-0610-T. Epub 2022 Jan 5. Mol Biol Cell. 2022. PMID: 34985939 Free PMC article.
-
A conserved mechanism for mitochondria-dependent dynein anchoring.Mol Biol Cell. 2019 Mar 1;30(5):691-702. doi: 10.1091/mbc.E18-07-0466. Epub 2019 Jan 16. Mol Biol Cell. 2019. PMID: 30649994 Free PMC article.
-
Mitochondria-driven assembly of a cortical anchor for mitochondria and dynein.J Cell Biol. 2017 Oct 2;216(10):3061-3071. doi: 10.1083/jcb.201702022. Epub 2017 Aug 23. J Cell Biol. 2017. PMID: 28835466 Free PMC article.
-
Num1 versus NuMA: insights from two functionally homologous proteins.Biophys Rev. 2018 Dec;10(6):1631-1636. doi: 10.1007/s12551-018-0472-x. Epub 2018 Nov 6. Biophys Rev. 2018. PMID: 30402673 Free PMC article. Review.
-
Asymmetric inheritance of mitochondria in yeast.Biol Chem. 2020 May 26;401(6-7):779-791. doi: 10.1515/hsz-2019-0439. Biol Chem. 2020. PMID: 31967958 Review.
Cited by
-
Hierarchical integration of mitochondrial and nuclear positioning pathways by the Num1 EF hand.Mol Biol Cell. 2022 Feb 1;33(2):ar20. doi: 10.1091/mbc.E21-12-0610-T. Epub 2022 Jan 5. Mol Biol Cell. 2022. PMID: 34985939 Free PMC article.
-
The Generation of Dynein Networks by Multi-Layered Regulation and Their Implication in Cell Division.Front Cell Dev Biol. 2020 Jan 31;8:22. doi: 10.3389/fcell.2020.00022. eCollection 2020. Front Cell Dev Biol. 2020. PMID: 32083077 Free PMC article. Review.
-
Mitochondrial Dynamics: Working with the Cytoskeleton and Intracellular Organelles to Mediate Mechanotransduction.Aging Dis. 2023 Oct 1;14(5):1511-1532. doi: 10.14336/AD.2023.0201. Aging Dis. 2023. PMID: 37196113 Free PMC article. Review.
-
Links of Cytoskeletal Integrity with Disease and Aging.Cells. 2022 Sep 16;11(18):2896. doi: 10.3390/cells11182896. Cells. 2022. PMID: 36139471 Free PMC article. Review.
-
Temporal control of contact site formation reveals a relationship between mitochondrial division and Num1-mediated mitochondrial tethering.Mol Biol Cell. 2023 Oct 1;34(11):ar108. doi: 10.1091/mbc.E23-05-0168. Epub 2023 Aug 16. Mol Biol Cell. 2023. PMID: 37585290 Free PMC article.
References
-
- Kormanec J, Schaaff-Gerstenschlager I, Zimmermann FK, et al. Nuclear migration in Saccharomyces cerevisiae is controlled by the highly repetitive 313 kDa NUM1 protein. Mol Gen Genet. 1991;230:277–287. PMID:1745235. - PubMed
Publication types
MeSH terms
Substances
Grants and funding
LinkOut - more resources
Full Text Sources
Other Literature Sources
Molecular Biology Databases
Research Materials