. 2018 Jul 5;19(1):522.
doi: 10.1186/s12864-018-4901-9.

LTR-retrotransposon transcriptome modulation in response to endotoxin-induced stress in PBMCs

Affiliations

LTR-retrotransposon transcriptome modulation in response to endotoxin-induced stress in PBMCs

Marine Mommert et al. BMC Genomics. .

Abstract

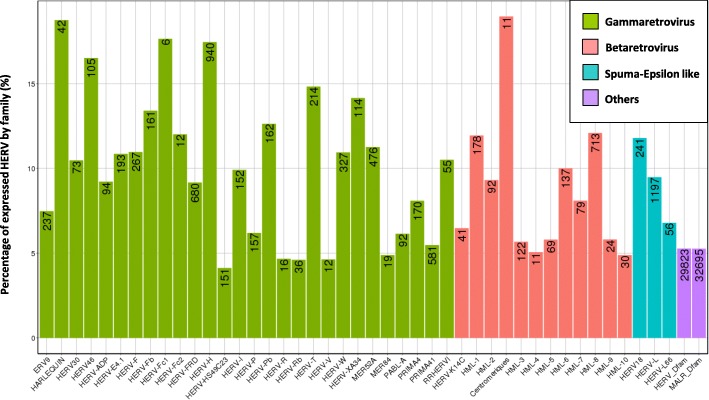
Background: Human Endogenous Retroviruses (HERVs) and Mammalian apparent LTR-retrotransposons (MaLRs) represent the 8% of our genome and are distributed among our 46 chromosomes. These LTR-retrotransposons are thought to be essentially silent except in cancer, autoimmunity and placental development. Their Long Terminal Repeats (LTRs) constitute putative promoter or polyA regulatory sequences. In this study, we used a recently described high-density microarray which can be used to study HERV/MaLR transcriptome including 353,994 HERV/MaLR loci and 1559 immunity-related genes.

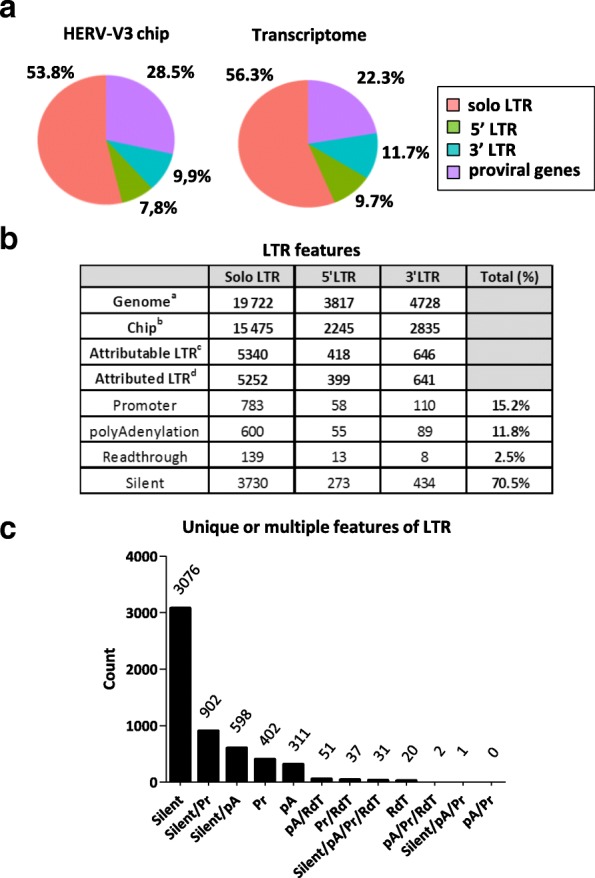
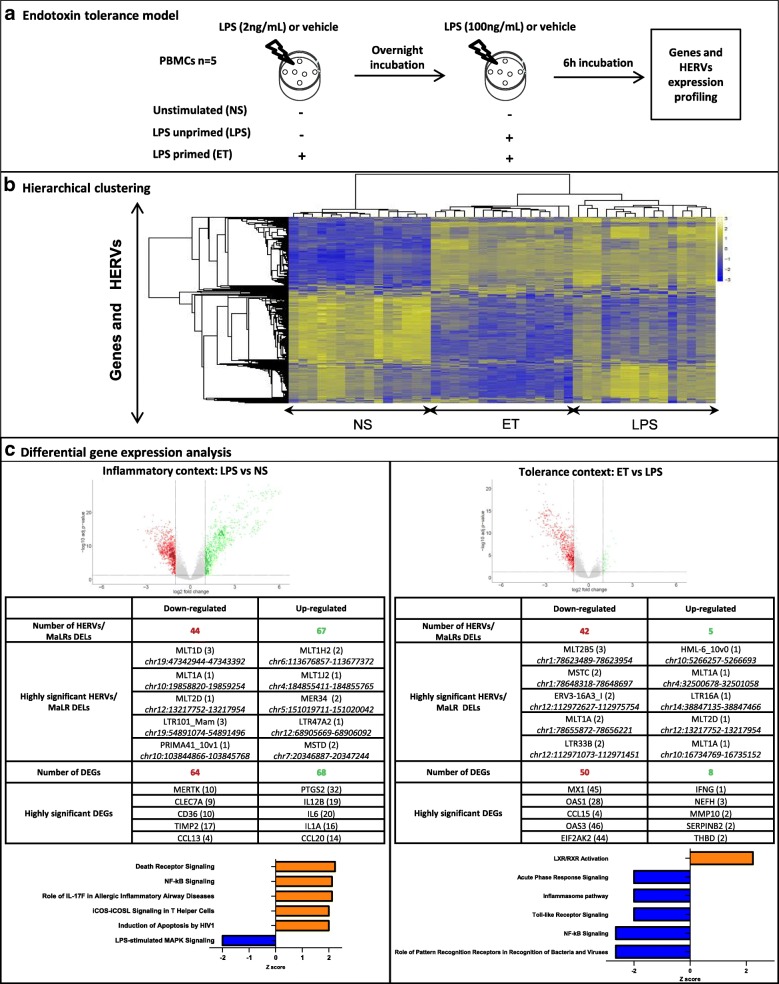
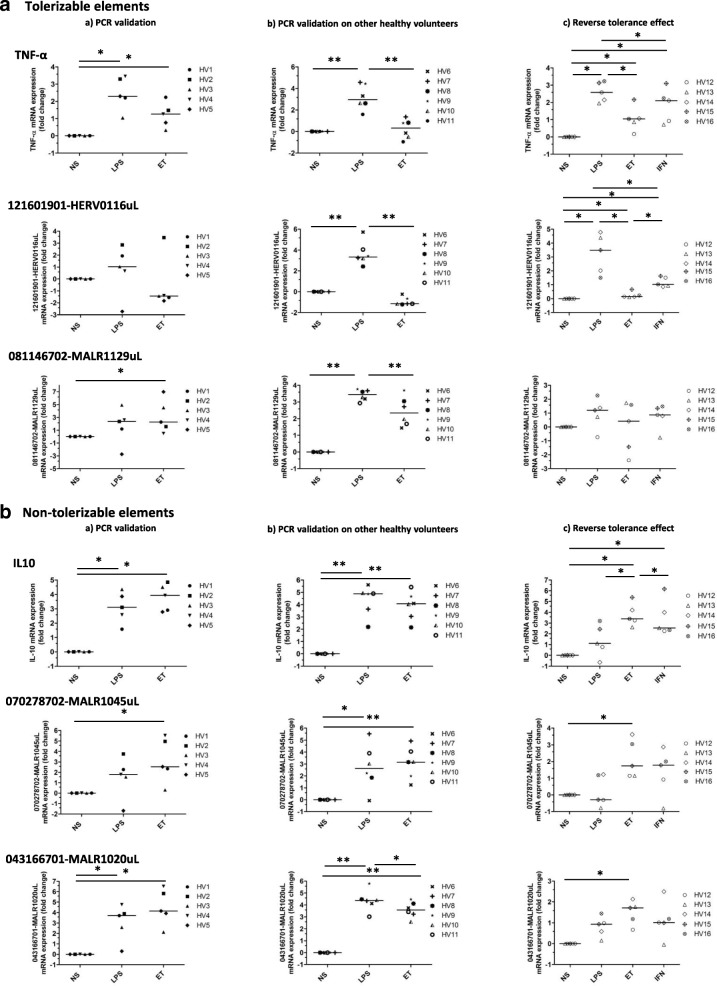
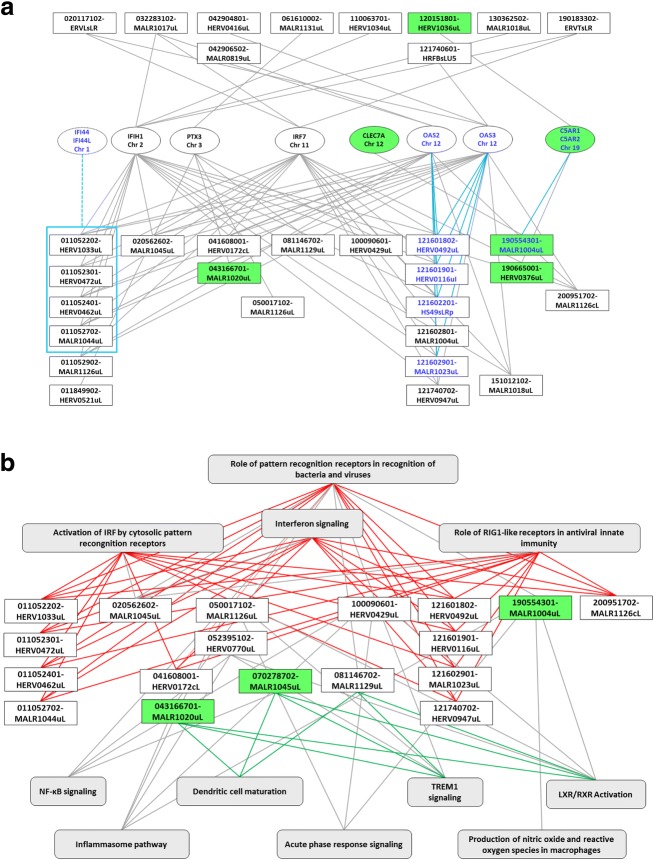
Results: We described, for the first time, the HERV transcriptome in peripheral blood mononuclear cells (PBMCs) using a cellular model mimicking inflammatory response and monocyte anergy observed after septic shock. About 5.6% of the HERV/MaLR repertoire is transcribed in PBMCs. Roughly one-tenth [5.7-13.1%] of LTRs exhibit a putative constitutive promoter or polyA function while one-quarter [19.5-27.6%] may shift from silent to active. Evidence was given that some HERVs/MaLRs and genes may share similar regulation control under lipopolysaccharide (LPS) stimulation conditions. Stimulus-dependent response confirms that HERV expression is tightly regulated in PBMCs. Altogether, these observations make it possible to integrate 62 HERVs/MaLRs and 26 genes in 11 canonical pathways and suggest a link between HERV expression and immune response. The transcriptional modulation of HERVs located close to genes such as OAS2/3 and IFI44/IFI44L or at a great distance from genes was discussed.

Conclusion: This microarray-based approach revealed the expression of about 47,466 distinct HERV loci and identified 951 putative promoter LTRs and 744 putative polyA LTRs in PBMCs. HERV/MaLR expression was shown to be tightly modulated under several stimuli including high-dose and low-dose LPS and Interferon-γ (IFN-γ). HERV incorporation at the crossroads of immune response pathways paves the way for further functional studies and analyses of the HERV transcriptome in altered immune responses in vivo such as in sepsis.

Keywords: Endotoxin tolerance; HERV transcriptome; LPS; PBMCs; Sepsis; Signalling pathways.


Conflict of interest statement

Ethics approval and consent to participate

Citrated pouches or heparinised tubes blood were obtained from EFS (Etablissement Français du Sang) and used immediately. According to EFS standardised procedures for blood donation and to provisions of the articles R.1243–49 and following ones of the French Public Health Code, a written non-opposition to the use of his donation for research purposes was obtained from healthy volunteers. The blood donors’ personal data were anonymised before blood transfer to our research lab. We obtained the favourable notice of the Local Ethical Committee (Comité de Protection des Personnes Sud-Est II, Bâtiment Pinel, 59 Boulevard Pinel, 69,500 Bron) and the acceptance of the Ministère de la Recherche (declaration DC-2008-64) for handling and conservation of these samples.

Consent for publication

Not applicable.

Competing interests

The authors declare that they have no competing interests.

Publisher’s Note

Springer Nature remains neutral with regard to jurisdictional claims in published maps and institutional affiliations.

Figures

Fig. 1
Fig. 1
The HERV transcriptome in PBMCs. Percentages and absolute counts of positive signal-associated probesets within individual groups of the “HERV_prototypes” repertoire and HERV_Dfam and MaLR_Dfam repertoires. A probeset was included as reflecting a significant transcriptional activity if its normalised intensity was over an intensity threshold of 25.5 in at least 14 out of the 45 samples (for all conditions). This conservatory threshold was defined as the minimal intensity level shared by all repertoires that exhibited an acceptable variability, i.e. the 75th percentile of the distribution of the variation coefficient as a function of intensity should be lower than 10% (illustrated in Additional file 1: Figure S1). HERV prototype groups were grouped by retrovirus classes, namely gammaretrovirus (green), betaretrovirus (red) and spuma-epsilon like retrovirus (blue). The HERV and MaLR Dfam repertoires were each depicted as a global homogeneous entity (purple)
Fig. 2
Fig. 2
Genomic, transcriptomic and functional projections of the HERV prototype repertoire. a HERV structure distribution. The 42 HERV groups corresponding to the “HERV_prototypes” repertoire are voluntarily depicted as 100% of the HERV-V3 chip. Solo LTR, 5’ LTR, 3’ LTR and proviral genes account for 100% of the HERV chip in the proportion described in Additional file 2: Table S1b. The transcriptome pie-chart is obtained from results detailed in Additional file 2: Table S1c. b LTR features. The descriptive table summarises the assignment of features. a,b,c,d Loss of information from HERV database to understandable functions. a Summary of Additional file 2: Table S1a, b Summary of Additional file 2: Table S1b, c Enumeration of LTRs whose function is attributable, i.e. defined as LTRs combining U3 and U5 adjacent structures on the genome and existing probesets onto the chip allowing discrimination between U3 and U5 expression signals, d Enumeration of LTRs whose function is attributed using both a 24.5 positive threshold and a fold change of 3 between U3 and U5 regions. More specifically, to retain sensitivity and robustness with regard to function assignation, we voluntarily selected a lower expression level cut-off of 24.5 for positive signal attribution. As such, the LTR was referred to as promoter (Pr), polyadenylation signal (pA), readthrough (RdT) or Silent. All other remaining LTRs were classified as undetermined. c Specialisation of LTR features. Number of LTRs from the “HERV_prototypes” repertoire according to all the combinations of functions observed in each of the 45 PBMC samples. Silent LTR, Pr: LTR referred to as a promoter, pA: LTR referred to as a polyadenylation signal, RdT: read-through. The combinations obtained could either contain one (e.g. Pr), two (e.g. Silent/Pr), three (e/g. Silent/pA/Pr), or four functions (Silent/pA/Pr/RdT). 987 LTRs were excluded from the analysis as classified at least once as undetermined
Fig. 3
Fig. 3
Genes and HERV/MaLR modulation following LPS stimulation. a Schematic representation of the dose-dependent LPS challenges known as the endotoxin tolerance model. Biological triplicates of PBMCs from 5 healthy volunteers were cultured and stimulated. Efficiency of stimulations was validated with TNF-α and IL10 quantitation by ELISA (Additional file 4: Figure S3) prior to HERV-V3 microarray experiments. b Heatmap from hierarchical clustering (correlation distance, complete method) of the 1% most variable probesets (all repertoires included), group samples according to their stimulation condition. Non-stimulated (NS), low-dose LPS primed PBMCs (ET), single high-dose lipopolysaccharide challenge (LPS); high-expression level (yellow), low-expression level (blue). c Differential gene and HERV/MaLR expression analysis. The first row shows volcano plots derived from the differential expression analysis; on the left for LPS vs NS (inflammatory context), and on the right for ET vs LPS conditions (immunocompromised/unresponsiveness context). The x-axis represents the log2 fold change values, and the y-axis the log10 adjusted p-values. Each point represents these values for a probeset. Coloured points show the significantly modulated probesets (adjusted p-value < 0.05, log2FC < − 1 (red) or log2FC > 1 (green)). The tables in the middle row present the number of statistically significantly differentially expressed elements, at locus level (DELs) for HERVs/MaLRs and differentially expressed genes (DEGs). Down-modulated loci are in red, up-modulated loci are in green. For HERV/MaLR elements, the name, number of differentially expressed probesets (between brackets) and chromosomal locations (in italic) are indicated (GRCh38 version of genome). For genes, the current gene symbol and the number of differentially expressed probesets (between brackets) are indicated. The last row represents canonical pathways identified using Ingenuity Pathways Analysis tool (https://analysis.ingenuity.com) and signals derived from HTA probesets contained on the HERV-V3 chip. Canonical pathways predicted to be significantly activated (orange) or inhibited (blue) between LPS vs NS and ET vs LPS conditions are depicted (z-scores ≥2 and z-scores ≤ − 2; p-value cut off of 0.05, Fisher’s exact test)
Fig. 4
Fig. 4
RT-qPCR validation of differentially expressed candidate loci following various LPS dose challenges. This figure illustrates the RT-qPCR expression of a tolerisable genes (TNF-α) and HERV/MaLR elements (121601901-HERV0116uL and 081146702-MALR1129uL) exhibiting a TNF-α–like pattern of expression and b non-tolerisable genes (IL10) and HERV/MaLR elements (070278702-MALR1045uL and 043166701-MALR1020uL) exhibiting an IL10–like pattern of expression. Expression was measured using mRNA derived from the stimulated and unstimulated PBMCs of the healthy volunteers used in the discovery microarray experiment (first column, (Aa and Ba)), mRNA derived from the stimulated and unstimulated PBMCs of 6 additional healthy volunteers managed in the same way (second column, (Ab and Bb)), and finally mRNA derived from the stimulated and unstimulated PBMCs of 5 additional healthy volunteers (third column, (Ac and Bc)). This last column includes additional IFN-γ dependant reversibility of tolerance, consisting of a 2 ng/mL LPS priming step overnight, followed by a 100 ng/mL IFN-γ stimulation step overnight, and finally the 100 ng/mL LPS stimulation step for 6 hours. All PCR reactions were performed in duplicate for each condition. Expression of the housekeeping genes PPIB and RPLP0 was monitored for normalisation. The fold change (FC) was determined using the 2-ΔΔCt method. The final value of the unstimulated condition was arbitrarily set to one and other values scaled-up in order to provide a final relative differential expression (data were represented by a median and using the log2 scale). Statistically significant differences between two conditions are marked (wilkoxon signed rank test. **: p-value < 0.05 and * p-value < 0.1)
Fig. 5
Fig. 5
Expression profile-based integration of HERVs/MaLRs in immunity genes related pathways. a The gene-centred network illustrates HERV/MaLR integration in the “role of pattern recognition receptors in recognition of bacteria and viruses” pathway (PRR). Seven genes specific for this pathway are depicted (oval frames) together with their parental chromosome. HERV/MaLR elements associated with these unique genes were identified using both Ingenuity Pathway Analysis and co-expression between HERVs/MaLRs and genes. Tolerisable and non-tolerisable elements are represented by empty or green boxes, respectively. Ten HERV/MaLR elements belong exclusively to the PRR pathway (top rectangular frames), while 22 HERVs/MaLRs loci are shared by several pathways (bottom rectangular frames). Five HERV/MaLR elements are located at a distance of less than 40 kb from the OAS3 and OAS2 or C5AR1/C5AR2 genes (dark blue font and turquoise connectors, C5AR2 absent from the microarray). Four HERV/MaLR elements are located in a 40 kb window (large turquoise rectangle) flanked by IFI44 and IFI44L genes (connected by a dotted line as absent from the microarray). b HERVs/MALRs integration in several pathways. The HERV/MaLR-centred network illustrates the integration of HERVs and MaLRs elements within 11 networks (grey boxes). Tolerisable and non-tolerisable elements are represented by empty or green boxes, respectively. Ten out of 15 tolerisable HERV/MaLR elements are exclusively linked to the 4 pathways at the top (red connectors), “activation of IRF by cytosolic pattern recognition receptors”, “role of pattern recognition receptors in recognition of bacteria and viruses”, “interferon signalling” and “role of RIG1-like receptors in antiviral innate immunity”. Three elements are exclusively associated with 3 pathways (2 out of the 3 non-tolerisable elements and 1 tolerisable element), “dendritic cell maturation”, “TREM1 signalling”, and “LXR/RXR activation” (green connectors)

Similar articles

Cited by

References

    1. Lander ES, Linton LM, Birren B, Nusbaum C, Zody MC, Baldwin J, Devon K, Dewar K, Doyle M, FitzHugh W, et al. Initial sequencing and analysis of the human genome. Nature. 2001;409(6822):860–921. doi: 10.1038/35057062. - DOI - PubMed
    1. Villesen P, Aagaard L, Wiuf C, Pedersen FS. Identification of endogenous retroviral reading frames in the human genome. Retrovirology. 2004;1:32. doi: 10.1186/1742-4690-1-32. - DOI - PMC - PubMed
    1. Bolze PA, Mommert M, Mallet F. Contribution of Syncytins and other endogenous retroviral envelopes to human placenta pathologies. Prog Mol Biol Transl Sci. 2017;145:111–162. doi: 10.1016/bs.pmbts.2016.12.005. - DOI - PubMed
    1. Bannert N, Kurth R. Retroelements and the human genome: new perspectives on an old relation. Proc Natl Acad Sci U S A. 2004;101(Suppl 2):14572–9. - PMC - PubMed
    1. Perot P, Bolze P-A, Mallet F. From viruses to genes: syncytins. In: Witzany G, editor. Viruses, Essential Agents of Life. Netherlands: Springer; 2012. p. 325–61.

MeSH terms