. 2018 Nov 20;138(21):2379-2394.
doi: 10.1161/CIRCULATIONAHA.118.033842.

SMAD4 Prevents Flow Induced Arteriovenous Malformations by Inhibiting Casein Kinase 2

Affiliations

SMAD4 Prevents Flow Induced Arteriovenous Malformations by Inhibiting Casein Kinase 2

Roxana Ola et al. Circulation. .

Abstract

Background: Hereditary hemorrhagic telangiectasia (HHT) is an inherited vascular disorder that causes arteriovenous malformations (AVMs). Mutations in the genes encoding Endoglin ( ENG) and activin-receptor-like kinase 1 ( AVCRL1 encoding ALK1) cause HHT type 1 and 2, respectively. Mutations in the SMAD4 gene are present in families with juvenile polyposis-HHT syndrome that involves AVMs. SMAD4 is a downstream effector of transforming growth factor-β (TGFβ)/bone morphogenetic protein (BMP) family ligands that signal via activin-like kinase receptors (ALKs). Ligand-neutralizing antibodies or inducible, endothelial-specific Alk1 deletion induce AVMs in mouse models as a result of increased PI3K (phosphatidylinositol 3-kinase)/AKT (protein kinase B) signaling. Here we addressed if SMAD4 was required for BMP9-ALK1 effects on PI3K/AKT pathway activation.

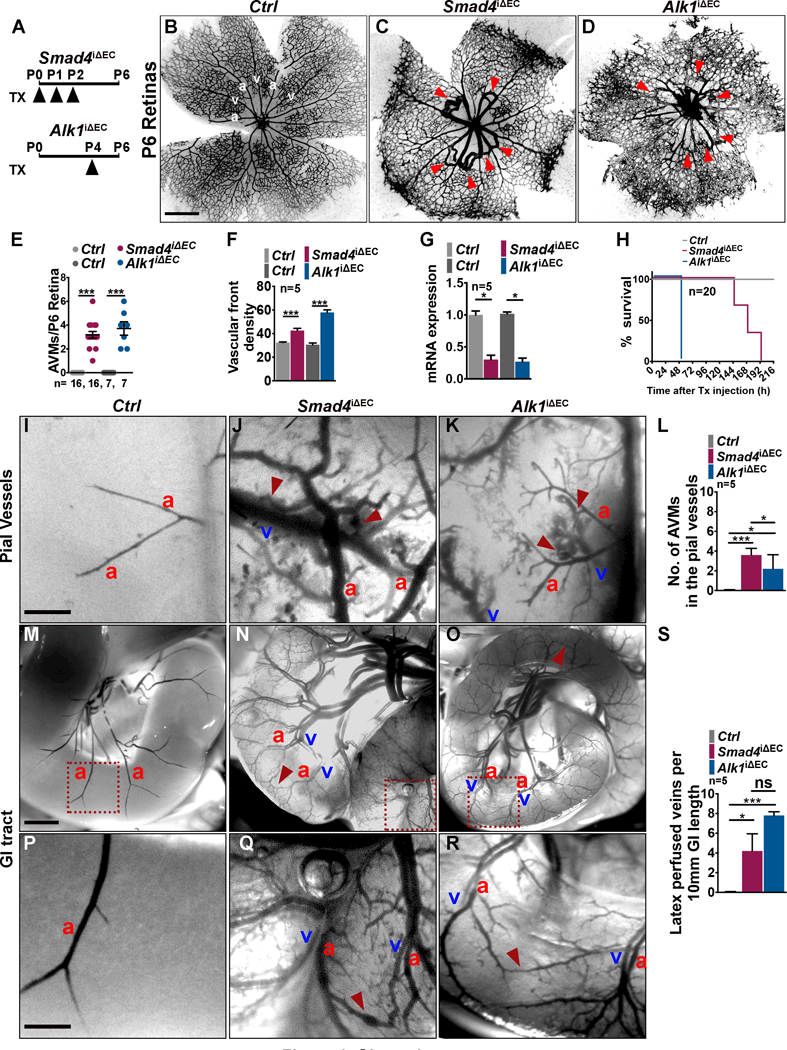
Methods: The authors generated tamoxifen-inducible, postnatal, endothelial-specific Smad4 mutant mice ( Smad4iΔEC).

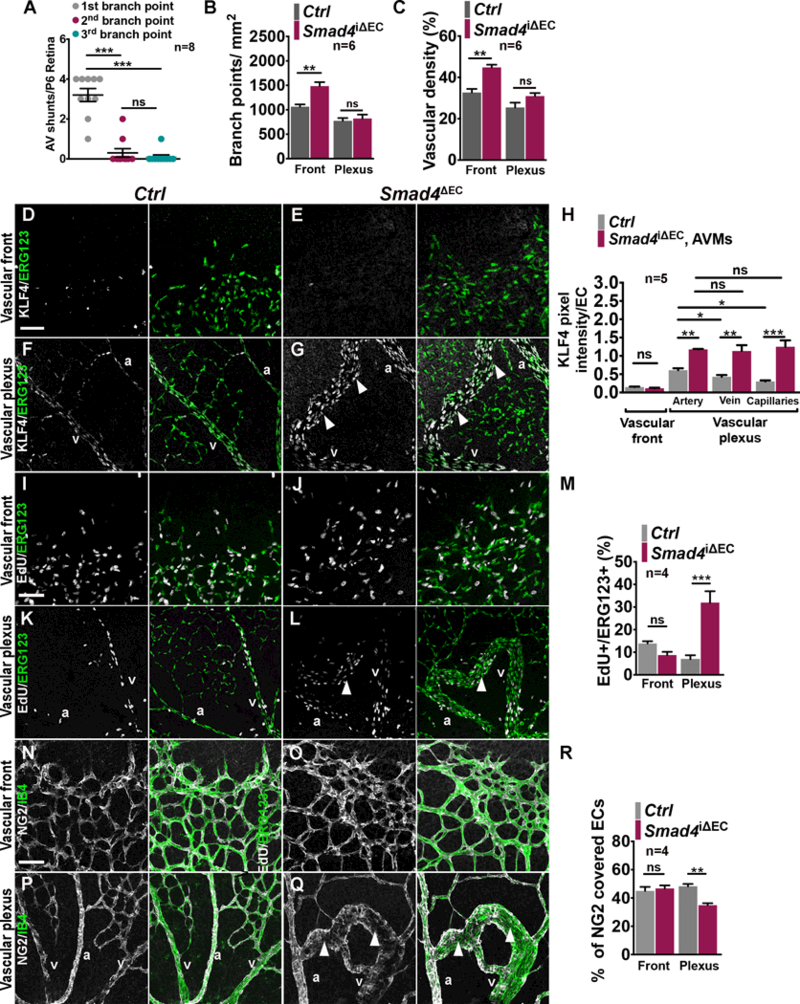
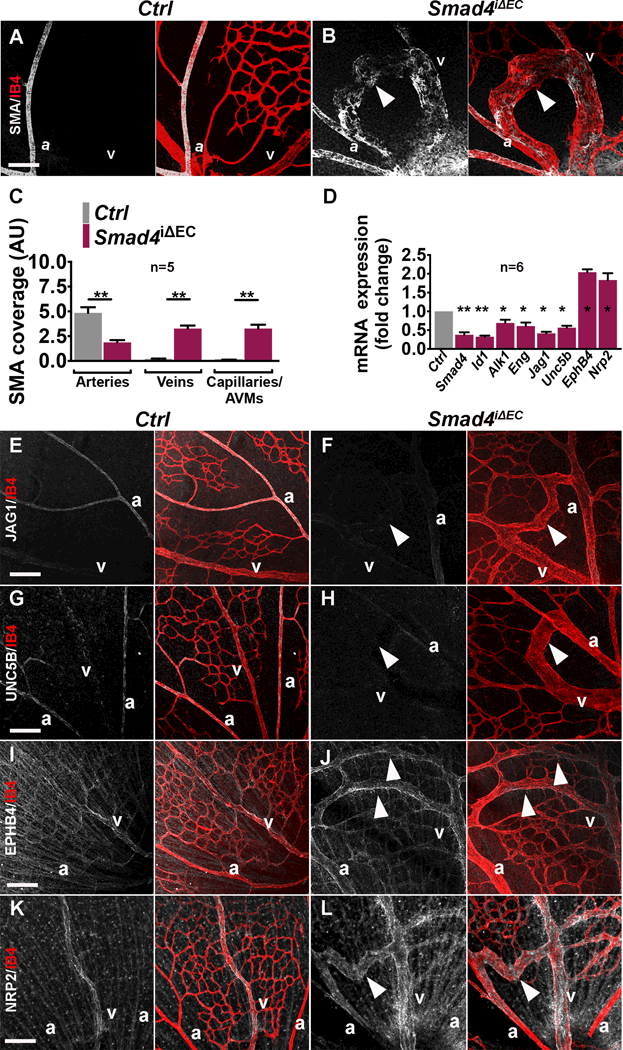
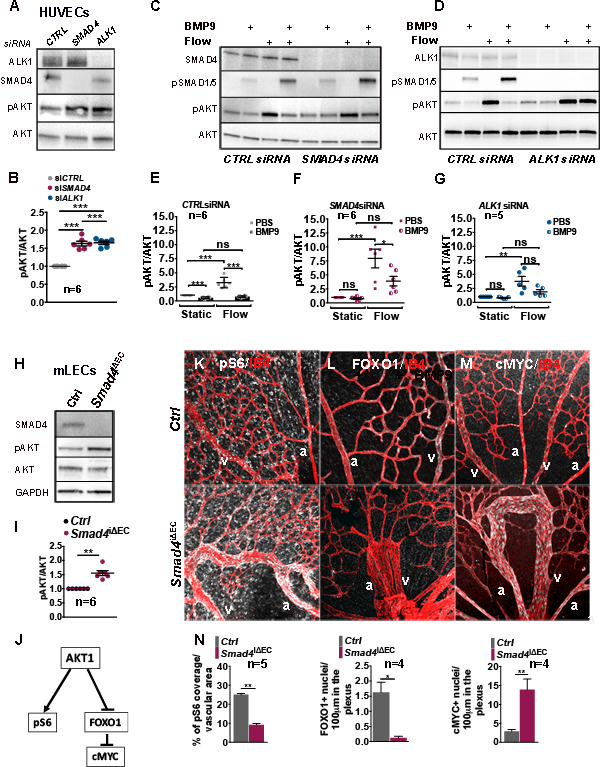
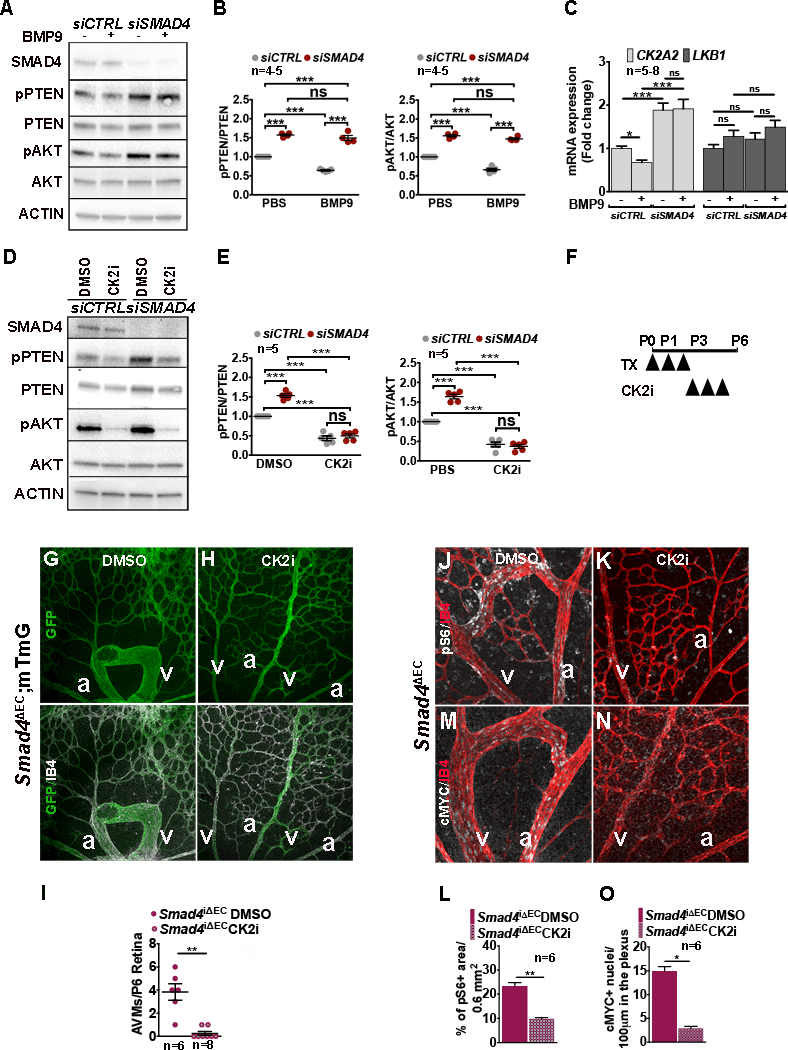
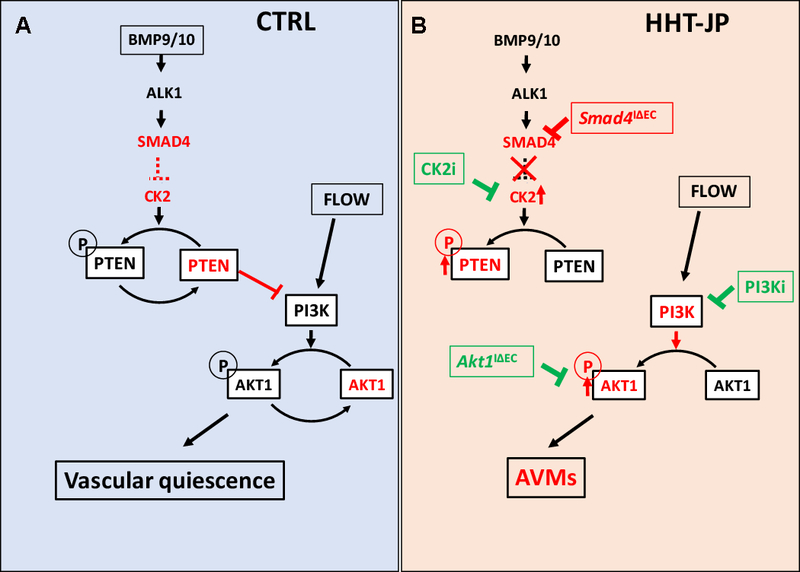
Results: We found that loss of endothelial Smad4 resulted in AVM formation and lethality. AVMs formed in regions with high blood flow in developing retinas and other tissues. Mechanistically, BMP9 signaling antagonized flow-induced AKT activation in an ALK1- and SMAD4-dependent manner. Smad4iΔEC endothelial cells in AVMs displayed increased PI3K/AKT signaling, and pharmacological PI3K inhibitors or endothelial Akt1 deletion both rescued AVM formation in Smad4iΔEC mice. BMP9-induced SMAD4 inhibited casein kinase 2 ( CK2) transcription, in turn limiting PTEN phosphorylation and AKT activation. Consequently, CK2 inhibition prevented AVM formation in Smad4iΔEC mice.

Conclusions: Our study reveals SMAD4 as an essential effector of BMP9-10/ALK1 signaling that affects AVM pathogenesis via regulation of CK2 expression and PI3K/AKT1 activation.

Keywords: Telangiectasia, hereditary hemorrhagic; activin receptors, type II; arteriovenous malformations; casein kinase; phosphatidylinositol 3-kinase; proto-oncogene proteins c-akt.


Conflict of interest statement

Conflict of Interest Disclosures

None.

Figures

Figure 1.
Figure 1.. Postnatal endothelial specific Smad4 deletion leads to AVM formation
(A) Schematic representation of the experimental strategy used to delete Smad4 or Alk1 in mice (P0–P6). Arrowheads indicate intra-gastric injection of 100μg Tx at P0, P1 and P2 in Smad4iΔEC or at P4 in Alk1iΔEC pups. (BD) IB4 staining (negative images of the fluorescent signal) of retinal flat mounts from Ctrl (B) Smad4iΔEC (C) and Alk1iΔEC (D) Tx injected P6 mice. Red arrowheads indicate retinal AVMs in (C) and (D). (E) Quantification of AVM number. (F) Quantification of vessel density in the vascular front (percent of total area). (G) Smad4 and Alk1 mRNA expression by qPCR in purified mLECs from P6 Tx injected mice. n are indicated in each graph. Error bars: s.e.m, *P<0.05, ***P<0.001, Mann–Whitney U-test. (H) Survival curves for Ctrl, Smad4iΔEC and Alk1iΔEC pups. n=20 mice/group. (IK) Vascular labeling with latex dye (blue) of pial vessels in Ctrl (I), Smad4 iΔEC (J) and Alk1iΔEC (K). (L) Quantification of the number of AVMs in the pial vessels. (MO) Vascular labeling with latex dye (blue) of the gastrointestional (GI) tract in Ctrl (M), Smad4 iΔEC (N) and Alk1iΔEC (O) P6 pups. (P-R) Higher magnification of insets in M-O. Red arrowheads in J, K, N, O, Q and R indicate AVMs in Smad4iΔEC and Alk1iΔEC pial vessels and GI tract. (S) Quantification of the number of the latex perfused veins in the GI tract. Error bars: s.e.m, *P<0.05, ***P<0.001, One Way Anova. a: artery, v: vein. Scale bars: 300μm in AC and 1mm in HJ, L-N, P-R.
Figure 2.
Figure 2.. Flow-induced altered cell behavior in Smad4iΔEC retinas
(A) Quantification of AVMs forming at the first, second or third branch point away from the optic nerve in P6 Smad4iΔEC retinas. Error bars: s.e.m, ns-non significant, ***P<0.001, One Way Anova. Quantification of the number of branch points (B) and vascular density (percent of total area) (C) in the sprouting front and vascular plexus in Ctrl and Smad4iΔEC P6 retinas. (DG) Labeling for KLF4 (white) and ERG123 in the sprouting front versus vascular plexus in Ctrl (D, F) and Smad4 iΔEC (E, G) P6 retinas. White arrowheads in (G) indicate an AVM. (H) Quantification of the KLF4 pixel intensity per ERG123+ ECs in the sprouting front versus vascular plexus (arteries, veins and capillaries in Ctrl versus AVMs in Smad4iΔEC retinas). Error bars: s.e.m, ns-non significant, *P<0.05, **P<0.01, ***P<0.001, Two Way Anova. (I-L) Labeling for EdU (white) and ERG1,2,3 51in the sprouting front versus vascular plexus of retinas from P6 Ctrl (I,K) and Smad4iΔEC mice (J,L). White arrowheads in (L) indicate the ERG123+ EdU+ cells in the AVM. (M) Quantification of the number of ERG1,2,3 and EdU double positive nuclei per vascular area in the vascular front versus vascular plexus. (NQ) Labelling for NG2 (white) and IB4 in the sprouting front and vascular plexus in Ctrl (N, P) and Smad4iΔEC (O, Q) P6 retinas. White arrowheads in (Q) indicate pericyte-depleted regions in an AVM. (R) Quantification of the percentage of EC surface area covered by NG2 in the sprouting front versus vascular plexus. n are indicated in each graph. Error bars: s.e.m, ns-non significant,**P<0.01, ***P<0.001, Mann–Whitney U-test for H, M, R. a: artery, v: vein. Scale Bars:100μm.
Figure 3.
Figure 3.. Arterial-Venous identity changes upon Smad4 deletion
(A, B) Smooth muscle actin (SMA-white) and IB4 (red) staining of retinal flat mounts from Ctrl (A) and Smad4iΔEC (B) P6 Tx injected mice. White arrowhead in (B) indicates an AVM. (C) Quantification of the intensity of SMA coverage (AU) in the arteries, veins, and capillaries/AVMs in the vascular plexus of Ctrl and Smad4iΔEC retinas. (D) qPCR analysis of mLECs from P6 Ctrl versus Smad4iΔEC pups. n are indicated in each graph. Error bars: s.e.m, *P<0.05, **P<0.01, Mann–Whitney U-test. (EL) Double labelling of retinal flat mounts from Ctrl (E, G, I, K) and Smad4iΔEC mice (F, H, J, L) with IB4 (red) and anti-JAG1 (white) in (E, F), anti-UNC5B (white) in (G, H), anti-EPHB4 (white) in (I, J), and anti-NRP2 (white) in (K, L). White arrowheads in F, H, J, L indicate AVMs. a: artery, v: vein. n are indicated in each graph. Scale bars: 100μm.
Figure 4.
Figure 4.. Enhanced flow-induced AKT signaling in Smad4 mutant endothelium
(A) Western blot analysis of HUVECs transfected with CTRL, SMAD4 or ALK1 siRNAs for 60 hours. (B) Quantification of pAKT (S473) levels normalized to total AKT. Error bars: s.e.m., ***P<0.001, One-Way Anova. (C-D) Analysis of HUVECs transfected with CTRL and SMAD4siRNAs (C) or CTRL and ALK1 siRNAs (D) and treated or not with 10ng/ml BMP9 for 90min followed by 30’ exposure to flow. (E, F, G) Quantification of pAKT (S473) levels normalized to total AKT in CTRL, SMAD4 and ALK1siRNAs. Error bars: s.e.m., *P<0.05, **P<0.01, ***P<0.001, Two-Way Anova. (H) Western Blot analysis of mLECs from P6 Ctrl versus Smad4iΔEC pups. (I) Quantification of pAKT (S473) levels normalized to total AKT. Error bars: s.e.m., **P<0.01, Mann–Whitney U-test. (J) Schematic representation of AKT downstream signaling components including pS6, FOXO1 and cMYC. (K-M) Labeling of pS6 (white, K), FOXO1 (white, L), cMYC (white, M) and IB4 (red) of retinal flat mounts from Tx injected P6 Ctrl and Smad4iΔEC pups. (N) Quantification of pS6, nuclear FOXO1 and cMYC in the vascular plexus of P6 Ctrl and Smad4iΔEC pups. Error bars: s.e.m, *P<0.05, **P<0.01, Mann–Whitney U-test. a: artery, v: vein. Scale bars: 100μm in KM.
Figure 5.
Figure 5.. PI3K and AKT1 inhibition prevents AVM formation in Smad4iΔEC mice
(A) Schematic representation of PI3K inhibition in Smad4iΔEC mice. Arrowheads indicate the administration of Tx (100μg) at P0-P2 and Wortmannin (PI3Ki, 0.4 mg kg−1) or PBS (vehicle) at P3-P5. (B, C) IB4 staining of retinal flat mounts (negative images of the fluorescent signal) from P6 Smad4iΔEC injected with vehicle or PI3Ki. Red arrowheads indicate AVMs. (D) Quantification of the AVM number in Smad4iΔEC injected with vehicle or PI3Ki. (E) Quantification of the percentage of pS6+ vascular area per field of view in P6 Smad4iΔEC treated with PBS or PI3Ki. (F, G) Quantification of the number of IB4+FOXO1+ (F) or IB4+cMYC+ (G) nuclei per 100μm vessel length in the vascular plexus in P6 Smad4iΔEC treated with PBS or PI3Ki. (H) Schematic representation of Smad4 and Akt1 gene deletion. Arrowheads indicate intra-gastric injection of 100μg Tx at P0 to P2 in Smad4iΔEC;AktiΔEC/+ and Smad4iΔEC;Akt iΔEC mice. (I, J) IB4 staining (negative images of the fluorescent signal) of retinal flat mounts from P6 Smad4iΔEC;AktiΔEC/+(I) and Smad4iΔEC;Akt iΔEC(J) mice. (K) Quantification of AVM number in Smad4iΔEC;AktiΔEC/+ and Smad4iΔEC;Akt iΔEC. Error bars: s.e.m., ***P<0.001, Mann–Whitney U-test. (L) Quantification of the percentage of pS6+ vascular area per field of view. (M) Survival curve of Smad4iΔEC;AktiΔEC/+and Smad4iΔEC;Akt iΔEC pups after Tx injection. n=8 mice/group. n are indicated in each graph. Error bars: s.e.m., *P<0.05, **P<0.01, Mann–Whitney U-test. a: artery, v: vein. Scale bars: 200μm in B, C, I, J.
Figure 6.
Figure 6.. BMP9 limits PTEN phosphorylation and AVM formation via CK2
(A) Western Blot analysis of HUVECs transfected with CTRL or SMAD4 siRNA for 60 hours and treated with 10ng/ml of BMP9 for 2 hours in serum free medium. (B) Quantifications of pAKT (S473) and pPTEN (Ser380/Thr382/383) levels normalized to total AKT and total PTEN, respectively. (C) Expression analysis of CK2A2 and LKB1 genes by qPCR in HUVECs transfected with CTRL or SMAD4 siRNA and treated or not with 10ng/ml BMP9 for 45min. (D) Western Blot analysis of HUVECs transfected with CTRL or SMAD4 siRNA for 60 hours and treated with 10 μg/ml of CK2 inhibitor (CK2i) for 2 hours. (E) Quantifications of pAKT and pPTEN levels normalized to total AKT and total PTEN respectively. Error bars: s.e.m., ns- non significant, *P<0.05 ***P<0.001, Two-Way Anova. (F) Schematic representation of CK2 inhibition in Smad4iΔEC;mTmG P6 mice. Arrowheads indicate intra-gastric injections of 100μg Tx at P0-P2 and injections of CK2 inhibitor at P3-P5. (G, H) Labeling with anti-GFP and IB4 (white) of retinal flat mounts from Smad4iΔEC;mTmG mice treated with vehicle (DMSO) (G) or CK2i (H). (I) Quantification of the AVM number in DMSO versus CK2i treated Smad4 iΔEC;mTmG P6 mice. (J, K) Anti-pS6 (white) and IB4 (red) staining of retinal flat mounts from Smad4iΔEC treated with DMSO (J) or with CK2i (K). (L) Quantification of the percentage of pS6+ vascular area per field of view in Smad4 iΔEC treated with DMSO or CK2i. (M, N) Anti-cMYC (white) and IB4 (red) staining of retinal flat mounts from P6 Smad4 iΔEC treated with DMSO (M) or with CK2i (N). (O) Quantification of the number of cMYC+ nuclei per 100μm vessel length in the vascular plexus in Smad4iΔEC treated with DMSO or CK2i. White arrowheads in (G, J, M) indicate AVMs. n are indicated in each graph. Error bars: s.e.m., ns-non significant, *P<0.05, **P<0.01, Mann–Whitney U-test. a: artery, v: vein. Scale bars: 100μm.
Figure 7.
Figure 7.. Model for SMAD4 function downstream of BMP9/10
(A) BMP9/10 binding to endothelial ALK1 activates SMAD4 to inhibit (directly or indirectly, dashed line) the expression of CK2, which phosphorylates PTEN. Via this mechanism, SMAD4 counteracts flow-induced PI3K-AKT signaling to maintain a quiescent endothelium. (B) Blocking SMAD4 signaling results in increased CK2 expression, in turn leading to increased PTEN phosphorylation and over activation of flow-induced PI3K-AKT signaling, which results in AVMs characteristic of HHT-JP. CK2 or PI3K inhibition or genetic deletion of Akt1 prevent AVM formation in Smad4 iΔEC vessels.

References

    1. Shovlin CL. Hereditary haemorrhagic telangiectasia: pathophysiology, diagnosis and treatment. Blood Rev 2010;24:203–219. - PubMed
    1. Gallione CJ, Klaus DJ, Yeh EY, Stenzel TT, Xue Y, Anthony KB, McAllister KA, Baldwin MA, Berg JN, Lux A, Smith JD, Vary CP, Craigen WJ, Westermann CJ, Warner ML, Miller YE, Jackson CE, Guttmacher AE and Marchuk DA. Mutation and expression analysis of the endoglin gene in hereditary hemorrhagic telangiectasia reveals null alleles. Hum Mutat 1998;11:286–294. - PubMed
    1. Johnson DW, Berg JN, Baldwin MA, Gallione CJ, Marondel I, Yoon SJ, Stenzel TT, Speer M, Pericak-Vance MA, Diamond A, Guttmacher AE, Jackson CE, Attisano L, Kucherlapati R, Porteous ME and Marchuk DA. Mutations in the activin receptor-like kinase 1 gene in hereditary haemorrhagic telangiectasia type 2. Nat Genet 1996;13:189–195. - PubMed
    1. McDonald J, Bayrak-Toydemir P and Pyeritz RE. Hereditary hemorrhagic telangiectasia: an overview of diagnosis, management, and pathogenesis. Genet Med 2011;13:607–616. - PubMed
    1. Goumans MJ, Zwijsen A, Ten Dijke P and Bailly S. Bone Morphogenetic Proteins in Vascular Homeostasis and Disease. Cold Spring Harb Perspect Biol 2017;10:a031989. - PMC - PubMed

Publication types

MeSH terms