. 2018 Sep 1;78(17):5060-5071.
doi: 10.1158/0008-5472.CAN-18-0569. Epub 2018 Jul 5.

Replication Stress Drives Constitutive Activation of the DNA Damage Response and Radioresistance in Glioblastoma Stem-like Cells

Affiliations

Replication Stress Drives Constitutive Activation of the DNA Damage Response and Radioresistance in Glioblastoma Stem-like Cells

Ross D Carruthers et al. Cancer Res. .

Abstract

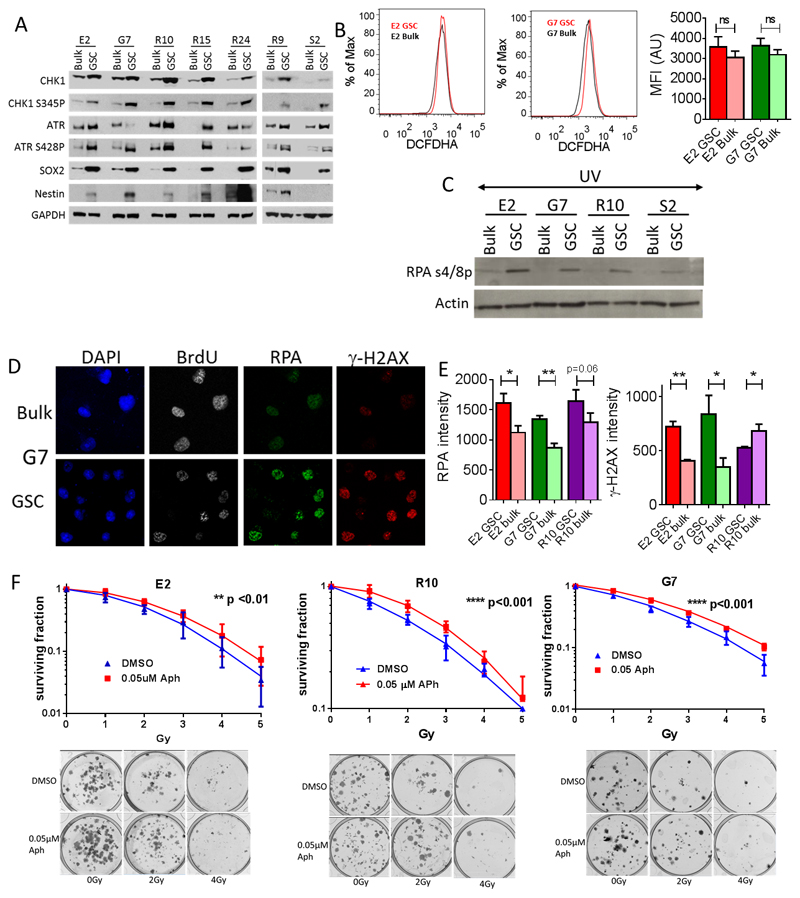
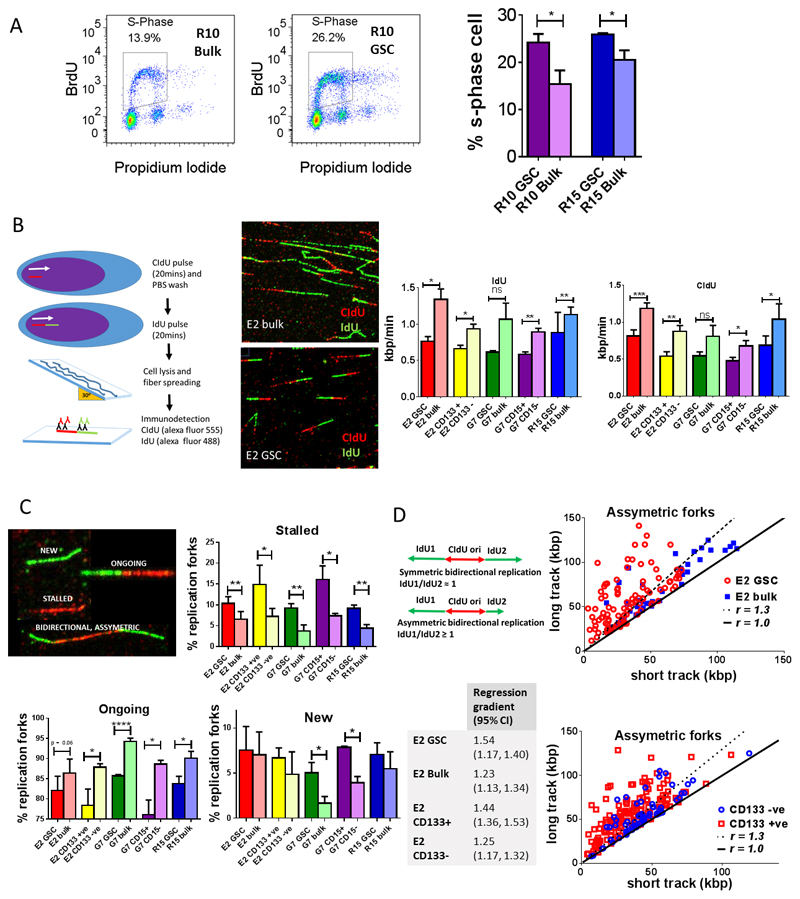
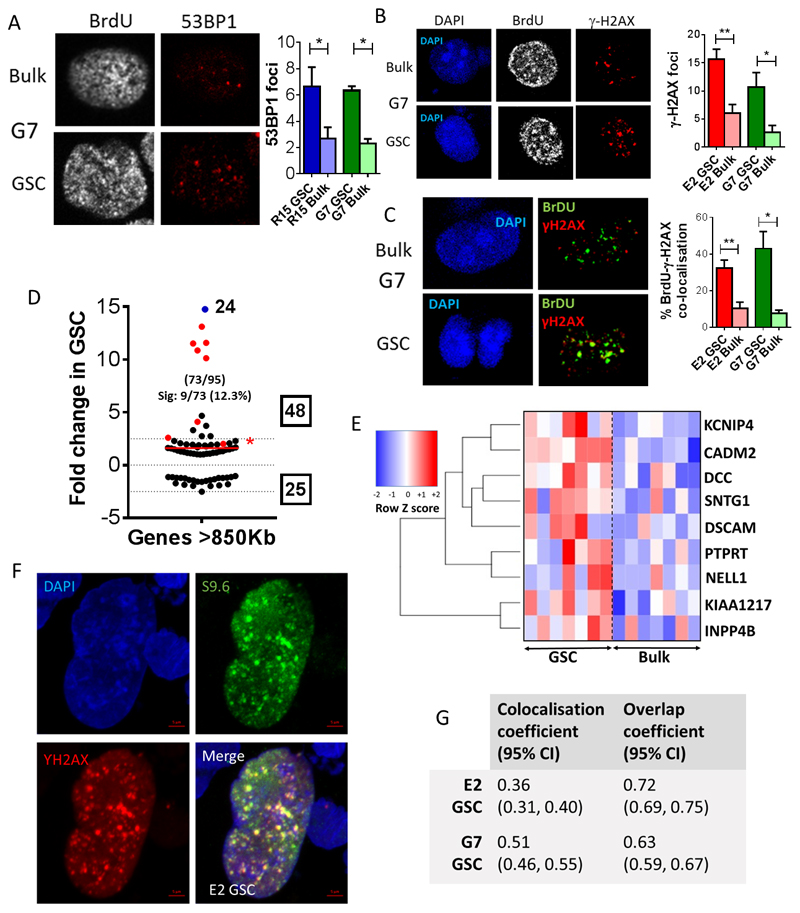
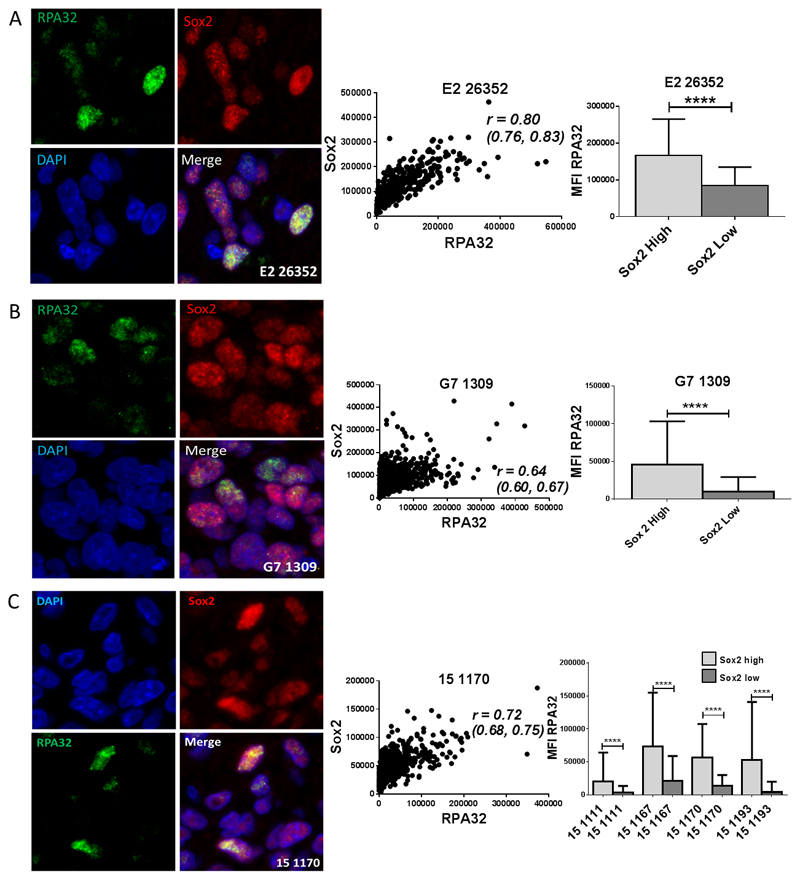
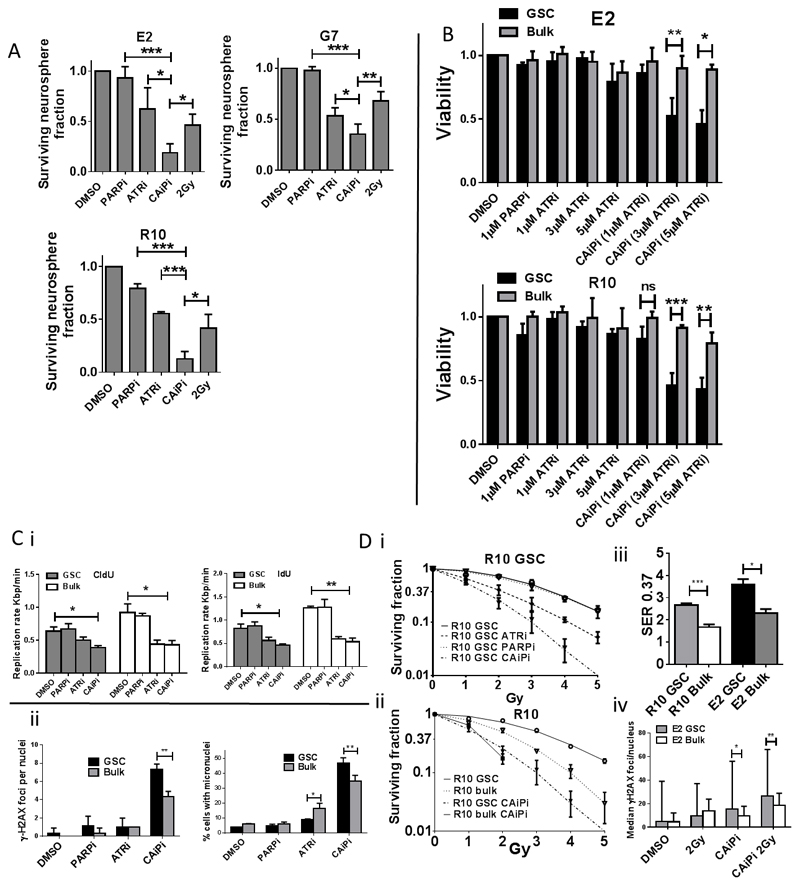
Glioblastoma (GBM) is a lethal primary brain tumor characterized by treatment resistance and inevitable tumor recurrence, both of which are driven by a subpopulation of GBM cancer stem-like cells (GSC) with tumorigenic and self-renewal properties. Despite having broad implications for understanding GSC phenotype, the determinants of upregulated DNA-damage response (DDR) and subsequent radiation resistance in GSC are unknown and represent a significant barrier to developing effective GBM treatments. In this study, we show that constitutive DDR activation and radiation resistance are driven by high levels of DNA replication stress (RS). CD133+ GSC exhibited reduced DNA replication velocity and a higher frequency of stalled replication forks than CD133- non-GSC in vitro; immunofluorescence studies confirmed these observations in a panel of orthotopic xenografts and human GBM specimens. Exposure of non-GSC to low-level exogenous RS generated radiation resistance in vitro, confirming RS as a novel determinant of radiation resistance in tumor cells. GSC exhibited DNA double-strand breaks, which colocalized with "replication factories" and RNA: DNA hybrids. GSC also demonstrated increased expression of long neural genes (>1 Mbp) containing common fragile sites, supporting the hypothesis that replication/transcription collisions are the likely cause of RS in GSC. Targeting RS by combined inhibition of ATR and PARP (CAiPi) provided GSC-specific cytotoxicity and complete abrogation of GSC radiation resistance in vitro These data identify RS as a cancer stem cell-specific target with significant clinical potential.Significance: These findings shed new light on cancer stem cell biology and reveal novel therapeutics with the potential to improve clinical outcomes by overcoming inherent radioresistance in GBM. Cancer Res; 78(17); 5060-71. ©2018 AACR.


Conflict of interest statement

Conflict of interests: The authors declare no potential conflicts of interest

Figures

Figure 1
Figure 1. Radioresistant GSCs demonstrate up regulation of DNA RS response markers, and exogenous RS generates radiation resistance in non-GSCs
A Western blot analysis of RS response and GSC markers in a panel of paired GSC and tumor bulk primary GBM cultures. GAPDH loading control. B Flow cytometry plots showing baseline levels of reactive oxygen species (ROS) via quantification of DCFHDA mean fluorescence intensity (MFI) in GSC and tumor bulk cultures (mean +/- SEM, n=3, unpaired t-test, NS=non-significant), C Western blot analysis of phospho-RPA32 (Ser4/8) expression in a panel of paired GSC and tumor bulk cells following UV mediated activation of RS (10Jm-2). D Immunofluorescence images showing γ-H2AX and RPA32 staining in BrdU positive G7 GSC and tumor bulk cells under basal conditions. Nuclei are counterstained with DAPI. E Quantification of γ-H2AX and RPA32 MFI in E2, G7 and R10 GSC and tumor bulk cells, (mean +/-SEM, n = 3, *p<0.05, **p < 0.01, unpaired t-test). F Clonogenic survival of E2, R10 and G7 tumor bulk cell lines treated with radiation alone (blue line) and following incubation with 0.05µM aphidicolin (red line) for 72 hours prior to irradiation (mean +/-SEM, n = 3 **p<0.01, ****p<0.001 by two way ANOVA). Representative images of colonies formed following 0, 2 and 4 Gy are shown.
Figure 2
Figure 2. Replicating GSCs show altered cell cycle phase progression and enhanced replication stress in vitro
A Representative flow cytometry plots and analysis of S-phase populations in R10 and R15 GSC and tumor bulk cells by quantification of BrdU incorporation under basal conditions (mean +/-SEM, n = 3, * p<0.05, unpaired t-test). B Schematic of DNA fiber assay; cells were incubated sequentially with CIdU (red) then IdU (green) followed by lysis and spreading. Representative immunofluorescent images of DNA fibers obtained from E2 GSC and bulk cells. Bar charts summarize quantification of IdU and CIdU incorporation rates (replication velocities) in GSC and tumor bulk cells in E2, G7 and R15 cell lines and in E2 CD133+ and CD133- populations and G7 CD15+ and CD15- populations, (mean +/-SEM, n=3, ≥ 500 ongoing replication forks analyzed per data point, *p<0.05, unpaired t-test). C Representative immunofluorescent images showing ‘new’, ‘ongoing’, ‘stalled’ and ‘bidirectional’ replication fork structures following sequential pulse labeling with CIdU (red) and IdU (green) in E2 GSC cultures. Bar charts summarize quantification of stalled, ongoing and new replication forks (as a percentage of total number of replication structures identified) in paired GSC and bulk cultures of E2, R15 and G7 cell lines and also in E2 CD133+ and CD133- and G7 CD15+ and CD15- sorted populations. (Mean +/-SEM, unpaired t test, with approx. 1800 replication forks identified and counted for each cell line, n ≥ 3). D Schematic showing symmetric and asymmetric bidirectional DNA replication fork structures observed in DNA fiber assay. Analysis of bidirectional replication fork ratio in E2 GSC and bulk cultures and also in E2 CD133+ and CD133- sorted populations. Each point represents an individual bidirectional replication fork, with longer IdU (green) track plotted on y axis versus shorter IdU track on x axis. Plotted solid black line represents a ratio of ‘1’ (i.e. no asymmetry), whilst plotted dotted black line represents a ratio of ≥ 1.33 (i.e. asymmetry). Table shows gradient of best-fit linear regression lines (95% CI) of long IdU versus short IdU tracks in paired E2 GSC and bulk and in E2 CD133+ and CD133- populations.
Figure 3
Figure 3. GSCs demonstrate increased numbers of γ-H2AX foci, which co-localize with replication factories and RNA: DNA hybrids
A-B Representative immunofluorescence images of G7 GSC and tumor bulk cells showing (A) 53BP1 and (B) γ-H2AX foci in BrdU positive cells under basal conditions, with quantification of (A) 53BP1 and (B) γ-H2AX foci per S-phase nucleus in G7 and E2 GSC and tumor bulk cells (mean +/-SEM, n = 3, *p<0.05, **p<0.01). C Representative images demonstrating co-localization of γ-H2AX foci with BrdU replication factories (BrdU foci) in G7 GSC and tumor bulk cells. Percentages of BrdU positive replication factories co-localizing with γ-H2AX foci are quantified in E2 and G7 GSC and tumor bulk cells (mean +/-SEM, n=3, *p<0.05, **p<0.01, unpaired t-test). D Mean fold change in the expression of genes across 7 GSC cultures compared to the paired tumor bulk cells associated with genes >850kb in length. Numbers of genes identified from the RNA sequencing data and total numbers of genes in the published gene dataset is shown in brackets and total numbers of up-and down regulated genes are indicated in boxes. The numbers and percentages of significantly altered (‘Sig’) genes in each dataset are shown and these genes are highlighted in red. Gene shown in blue was up regulated 24-fold. Mean fold changes across all genes are shown by red lines. Genes >850bp in length are significantly up regulated in GSC compared to paired tumor bulk population across 7 GBM cell lines (one sample t-test, *p<0.05, NS=non-significant). E Heatmap illustrating fold changes in expression of the 9 significantly up regulated genes >850bp across 7 paired cell lines. F Representative image of immunofluorescent staining for RNA: DNA hybrids using S9.6 antibody and γ-H2AX in E2 GSC. G Table of colocalization and overlap coefficients (95% CIs) for γ-H2AX versus S9.6 immunofluorescence in E2 and G7 GSC.
Figure 4
Figure 4. GSCs show enhanced replication stress in murine intracranial orthotopic xenografts and in human GBM tumor samples
A and B Representative images (63x magnification) of immunofluorescent staining for RPA32 and Sox2 in sections from murine orthotopic intracranial xenografts derived from A E2 CD133+ cells and B G7 GSC cultures. Scatter plots showing correlation between Sox2 and RPA32 MFI, with corresponding r values (95% CI). Bar charts show RPA32 MFI quantified in Sox2 low and Sox2 high populations (defined as below and above median Sox2 MFI intensity values respectively; mean +/-SEM, unpaired t test). C Representative images (63x magnification) of immunofluorescent staining for RPA32 and Sox2 in a section from a resected human GBM tumor ‘15 1170.’ Scatter plot showing correlation between Sox2 and RPA32 MFI, with corresponding r value (95% CI). Bar chart shows RPA32 MFI quantified in Sox2 low and Sox2 high populations, (defined as above and below median Sox2 MFI values respectively; mean +/-SEM, unpaired t test) in 4 different resected human GBM specimens.
Figure 5
Figure 5. Inhibition of RS response inhibits GSC neurosphere formation, generates DNA DSBs and abrogates GSC radiation resistance
A Neurosphere formation by E2, G7 and R10 GSCs following 48 hour exposure to PARPi (1μM) or ATRi (5μM) alone, CAiPi or radiation (2Gy). Surviving neurosphere fraction is plotted relative to DMSO control (mean+/-SEM, n=3, *p<0.05, **p<0.01, ***p<0.001, unpaired t-test). B Cell viability of paired E2 and R10 GSC and tumor bulk cultures following 24 hour incubation with PARPi alone (1μM), incremental concentrations of ATRi alone (1, 3 and 5 μM) or CAiPi. (Mean +/-SEM, n=3, ***p<0.001 unpaired t-test). Ci Quantification of CIdU and IdU incorporation rates (replication velocities) in E2 GSC and bulk following 24 hour exposure to PARPi (1μM) or ATRi (5μM) alone or CAiPi as measured by DNA fiber assay (mean +/- SEM, n = 3, unpaired t test. ii Quantification of mean γ-H2AX foci per nuclei and micronuclei formation in E2 GSC and tumor bulk cells following 48 hour exposure to ATRi or PARPi alone or CAiPi relative to DMSO control (mean+/-SEM, n=3, **p<0.01, unpaired t test). Di Clonogenic survival curves derived from R10 GSCs following exposure to DMSO, ATRi or PARPi or CAiPi for 1 hour pre and 24 hours post ionizing radiation (0-5Gy) (mean+/SEM, n = 3). ii Clonogenic survival curve derived from R10 GSC and paired R10 bulk following treatment with DMSO or combined ATRi and PARPi with radiation. iii Quantification of radiation sensitizer enhancement ratios for 0.37 survival following combined ATRi/PARPi in E2 and R10 GSC and bulk (n≥3, mean +/- SEM). iv Quantification of median γ-H2AX foci per nucleus in E2 GSC and bulk cells following exposure to CAiPi or DMSO for 1 hour pre and 24 hours post irradiation with 2Gy or sham irradiation. (median +/- range, n = 1, *p<0.05, **p<0.01, Mann Whitney U test).

Comment in

References

    1. Parsons DW, Jones S, Zhang X, Lin JC, Leary RJ, Angenendt P, et al. An integrated genomic analysis of human glioblastoma multiforme. Science. 2008;321(5897):1807–12. - PMC - PubMed
    1. Ajaz M, Jefferies S, Brazil L, Watts C, Chalmers A. Current and investigational drug strategies for glioblastoma. Clin Oncol (R Coll Radiol) 2014;26(7):419–30. - PubMed
    1. Stupp R, Mason WP, van den Bent MJ, Weller M, Fisher B, Taphoorn MJ, et al. Radiotherapy plus concomitant and adjuvant temozolomide for glioblastoma. N Engl J Med. 2005;352(10):987–96. - PubMed
    1. Bao S, Wu Q, McLendon RE, Hao Y, Shi Q, Hjelmeland AB, et al. Glioma stem cells promote radioresistance by preferential activation of the DNA damage response. Nature. 2006;444(7120):756–60. - PubMed
    1. Chen J, Li Y, Yu TS, McKay RM, Burns DK, Kernie SG, et al. A restricted cell population propagates glioblastoma growth after chemotherapy. Nature. 2012;488(7412):522–6. - PMC - PubMed

Publication types

MeSH terms