. 2018 Aug 8;38(32):7108-7119.
doi: 10.1523/JNEUROSCI.3240-17.2018. Epub 2018 Jul 5.

Synaptopathy in the Aging Cochlea: Characterizing Early-Neural Deficits in Auditory Temporal Envelope Processing

Affiliations

Synaptopathy in the Aging Cochlea: Characterizing Early-Neural Deficits in Auditory Temporal Envelope Processing

Aravindakshan Parthasarathy et al. J Neurosci. .

Abstract

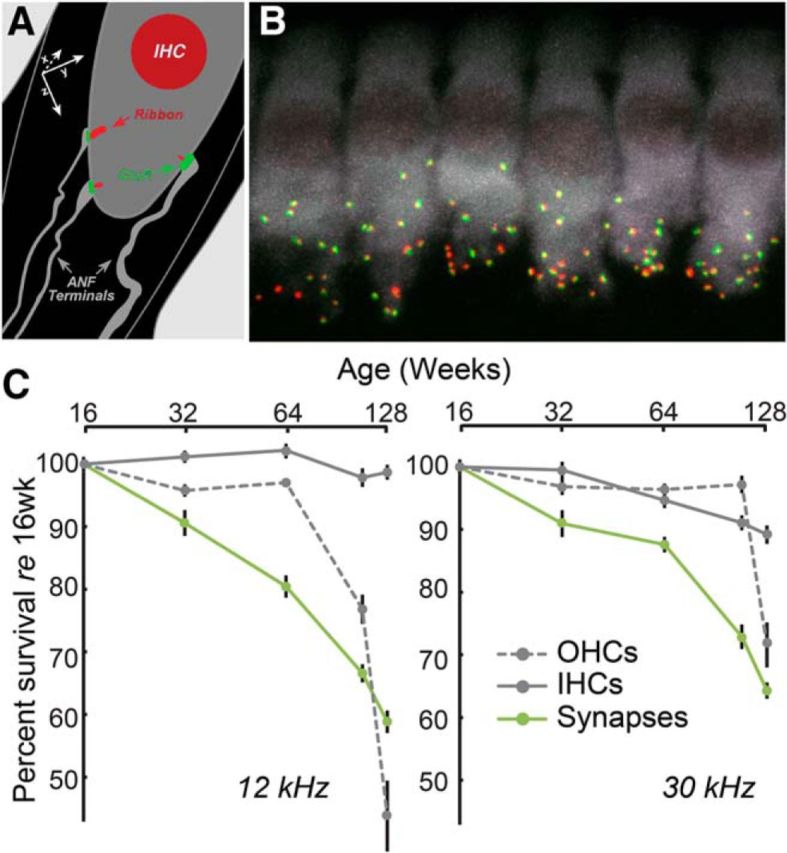
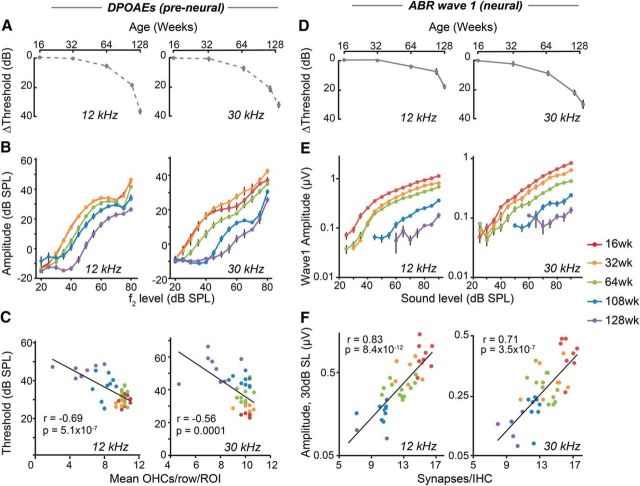
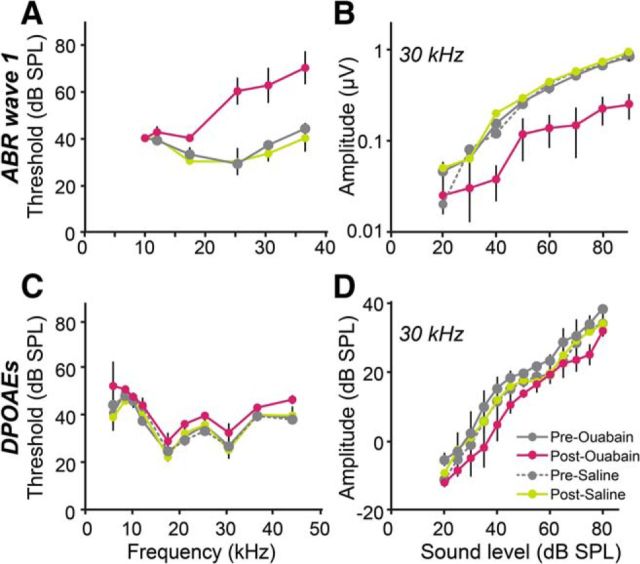
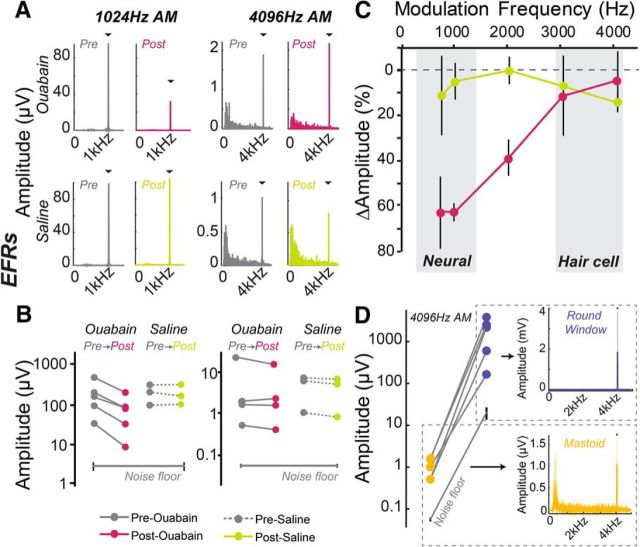
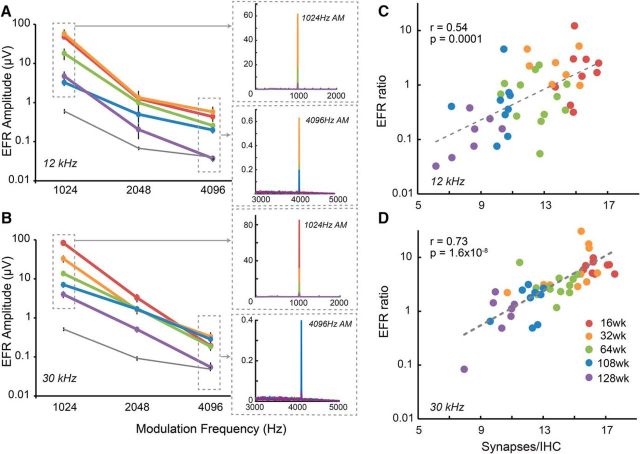
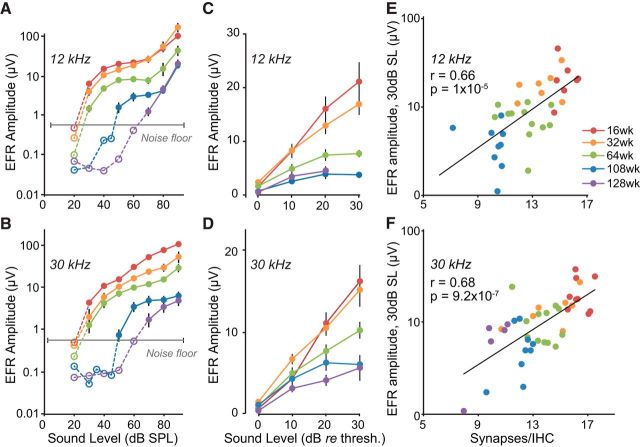
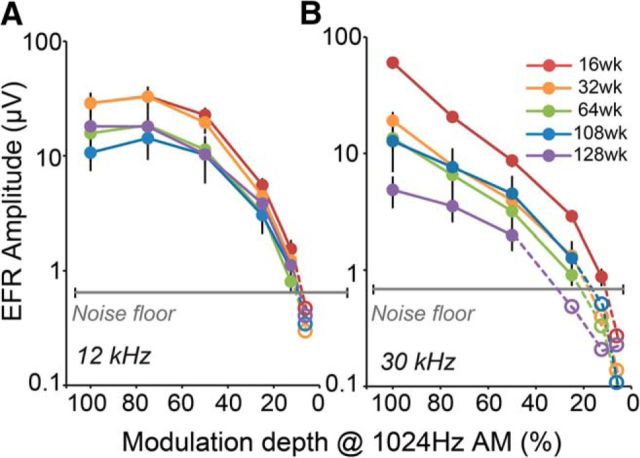
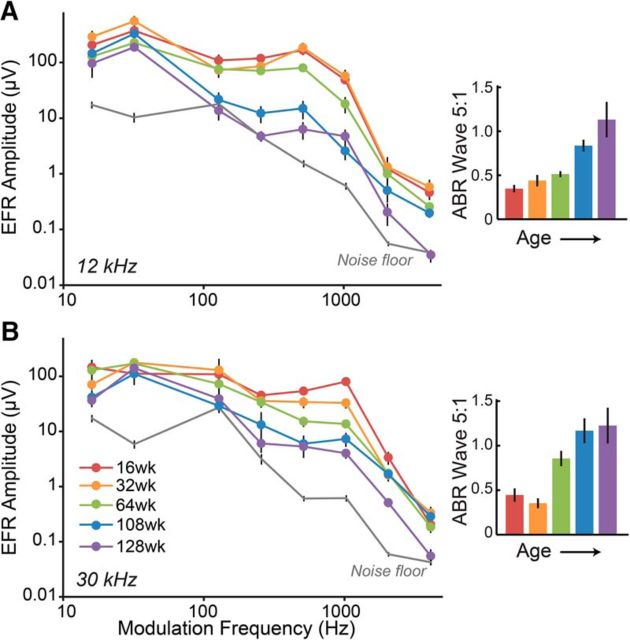
Aging listeners, even in the absence of overt hearing loss measured as changes in hearing thresholds, often experience impairments processing temporally complex sounds such as speech in noise. Recent evidence has shown that normal aging is accompanied by a progressive loss of synapses between inner hair cells and auditory nerve fibers. The role of this cochlear synaptopathy in degraded temporal processing with age is not yet understood. Here, we used population envelope following responses, along with other hair cell- and neural-based measures from an age-graded series of male and female CBA/CaJ mice to study changes in encoding stimulus envelopes. By comparing responses obtained before and after the application of the neurotoxin ouabain to the inner ear, we demonstrate that we can study changes in temporal processing on either side of the cochlear synapse. Results show that deficits in neural coding with age emerge at the earliest neural stages of auditory processing and are correlated with the degree of cochlear synaptopathy. These changes are seen before losses in neural thresholds and particularly affect the suprathreshold processing of sound. Responses obtained from more central sources show smaller differences with age, suggesting compensatory gain. These results show that progressive cochlear synaptopathy is accompanied by deficits in temporal coding at the earliest neural generators and contribute to the suprathreshold sound processing deficits observed with age.SIGNIFICANCE STATEMENT Aging listeners often experience difficulty hearing and understanding speech in noisy conditions. The results described here suggest that age-related loss of cochlear synapses may be a significant contributor to those performance declines. We observed aberrant neural coding of sounds in the early auditory pathway, which was accompanied by and correlated with an age-progressive loss of synapses between the inner hair cells and the auditory nerve. Deficits first appeared before changes in hearing thresholds and were largest at higher sound levels relevant to real world communication. The noninvasive tests described here may be adapted to detect cochlear synaptopathy in the clinical setting.

Keywords: EFR; aging; auditory nerve; compensatory gain; hidden hearing loss; synaptopathy.


Figures

Figure 1.
Figure 1.
Progressive age-related cochlear synaptopathy occurs before hair cell loss. A, Schematic cross-section showing three of the ∼20 auditory nerve fibers (ANFs) making synaptic contact with an IHC. Presynaptic ribbons and postsynaptic receptor patches are also schematized. The x–y–z axis shows the viewing angle for the confocal x–y projections shown for example IHCs in (B), where immunostaining reveals the juxtaposition of presynaptic ribbons (red) and postsynaptic receptor patches (green). C, Mean ± SEM percentage survival of cochlear synapses (green line), IHCs (gray solid line), and OHCs (gray dashed line) relative to 16-week-old animals at two cochlear locations and five age groups: 16 weeks (n = 9), 32 weeks (n = 11), 64 weeks (n = 14), 108 weeks (n = 9), and 128 weeks (n = 8). Ages of individual animals were within 5% of each target age.
Figure 2.
Figure 2.
Synaptopathy is reflected in neural ABR wave 1 amplitudes. AC, Preneural, OHC-based DPOAE measures. A, Mean ± SEM change in DPOAE thresholds relative to 16-week-old animals at two cochlear locations. B, DPOAE growth functions for the different age groups. C, Scatterplots showing the correlation between DPOAE thresholds and mean number of OHCs per row per imaging region of interest for all animals tested. DF, Neural, ABR-based measures. D, Mean ± SEM change in ABR wave 1 thresholds relative to 16-week-old animals at two cochlear locations. E, ABR wave 1 growth functions for the different age groups. F, Scatterplots showing the correlation between ABR wave 1 amplitudes at 30 dB SL and mean number of cochlear synapses for all animals tested. Age ranges and group sizes in all panels similar to Figure 1. The oldest age group (128 weeks) in F had fewer animals that had responses at 30 dB SL due to elevated hearing thresholds.
Figure 3.
Figure 3.
Ouabain differentiates early neural and hair cell-based responses. Shown are mean ± SEM ABR wave 1 thresholds (A) and amplitudes at 30 kHz (B) measured before and after the application of 10 mm ouabain (n = 5) or saline (n = 3) to the round window of the cochlea. Group sizes apply to all panels. C, D, Mean ± SEM DPOAE thresholds and amplitudes at 30 kHz, respectively, for the two groups before and after treatment.
Figure 4.
Figure 4.
Ouabain differentiates EFRs generated from early neural- and hair cell-based sources. A, Grand-averaged magnitude spectra for the EFRs at 1024 and 4096 Hz AM before and after treatment with ouabain or saline. Black triangles indicate location of AM frequency. B, Individual EFR amplitudes at 1024 and 4096 Hz AM before and after treatment with ouabain or saline. C, Mean ± SEM percentage decrease in EFR amplitudes elicited by AM frequencies between 768 and 4096 Hz. D, Comparison of EFRs at 4096 Hz AM recorded using mastoid electrodes and round window electrodes in five animals. Inset shows the grand-averaged magnitude spectrum (bold) with individual spectra shown behind. All EFRs elicited from the 30 kHz cochlear region at 80 dB SPL.
Figure 5.
Figure 5.
Temporal processing deficits occur at the cochlear synapse and are correlated with the degree of synaptopathy. A, B, Mean ± SEM EFR amplitudes at 80 dB SPL elicited to AM frequencies between 1024 and 4096 Hz at 12 kHz and 30 kHz frequency regions. Insets in A and B shows magnitude spectra of EFRs at 1024 and 4096 Hz AM with peaks at the respective modulation frequencies against the surrounding noise floor. C, D, Correlation between synapses/IHC and the EFR ratio calculated as the absolute value of log10(EFR1024)/log10(EFR4096) at the two cochlear frequency regions shown in A and B. Age ranges and group sizes were 16 weeks (n = 9), 32 weeks (n = 11), 64 weeks (n = 12), 108 weeks (n = 9), and 128 weeks (n = 7).
Figure 6.
Figure 6.
The dynamic range for encoding sound level decreases with age. A, B, Mean ± SEM EFR amplitudes at 1024 Hz AM measured as a function of sound level across the various age groups at 12 and 30 kHz frequency regions. Age ranges and group sizes are similar to Figure 1. Dashed lines indicate responses below the noise floor. C, D, Mean ± SEM EFR amplitudes at equal SLs of 0 dB (threshold) to 30 dB at the two cochlear frequency regions shown in A and B. The oldest age group (128 weeks) had fewer animals that had responses at 30 dB SL due to elevated hearing thresholds, with only two animals at 128 weeks reaching 30 dB SL at 12 kHz (data point not shown). E, F, Correlation between EFR amplitudes from C and D at 30 dB SL and the number of remaining synapses/IHC across all the age groups. Age ranges and group sizes are similar to Figure 5.
Figure 7.
Figure 7.
Dynamic range for early neural coding of modulation depth decreases with age. A, B, Mean ± SEM EFR amplitudes at 1024 Hz AM measured as a function of AM depth across the various age groups at 12 and 30 kHz frequency regions. Sound level of presentation was 30 dB SL at all age groups except 128 weeks, where the sound level was fixed at 90 dB SPL. Dashed lines indicate responses below the noise floor. Age ranges and group sizes were 16 weeks (n = 8), 32 weeks (n = 6), 64 weeks (n = 9), 108 weeks (n = 6), and 128 weeks (n = 6).
Figure 8.
Figure 8.
Responses from the central auditory pathway show signs of compensatory gain with age. Mean ± SEM EFR amplitudes at AM frequencies from 16 to 4096 Hz in octave steps across the various age groups at the 12 kHz (A) and 30 kHz (B) frequency regions. Sound level of presentation was 80 dB SPL. Inset shows mean ± SEM ABR wave 5: wave 1 ratios across age. Age ranges and group sizes are similar to Figure 1.

Similar articles

Cited by

References

    1. Batrel C, Huet A, Hasselmann F, Wang J, Desmadryl G, Nouvian R, Puel JL, Bourien J (2017) Mass potentials recorded at the round window enable the detection of low spontaneous rate fibers in gerbil auditory nerve. PLoS One 12:e0169890. 10.1371/journal.pone.0169890 - DOI - PMC - PubMed
    1. Bharadwaj HM, Verhulst S, Shaheen L, Liberman MC, Shinn-Cunningham BG (2014) Cochlear neuropathy and the coding of supra-threshold sound. Front Syst Neurosci 8:26. 10.3389/fnsys.2014.00026 - DOI - PMC - PubMed
    1. Bharadwaj HM, Masud S, Mehraei G, Verhulst S, Shinn-Cunningham BG (2015) Individual differences reveal correlates of hidden hearing deficits. J Neurosci 35:2161–2172. 10.1523/JNEUROSCI.3915-14.2015 - DOI - PMC - PubMed
    1. Bidelman GM. (2015) Multichannel recordings of the human brainstem frequency-following response: scalp topography, source generators, and distinctions from the transient ABR. Hear Res 323:68–80. 10.1016/j.heares.2015.01.011 - DOI - PubMed
    1. Bidelman GM, Lowther JE, Tak SH, Alain C (2017) Mild cognitive impairment is characterized by deficient brainstem and cortical representations of speech. J Neurosci 37:3610–3620. 10.1523/JNEUROSCI.3700-16.2017 - DOI - PMC - PubMed

Publication types

MeSH terms

LinkOut - more resources