

doi: 10.3324/haematol.2017.187070.
Epub 2018 Jul 5.
Idelalisib impairs T-cell-mediated immunity in chronic lymphocytic leukemia
Affiliations
- PMID: 29976737
- PMCID: PMC6269319
- DOI: 10.3324/haematol.2017.187070
Item in Clipboard
Idelalisib impairs T-cell-mediated immunity in chronic lymphocytic leukemia
Haematologica.
2018 Dec.
No abstract available
Figures
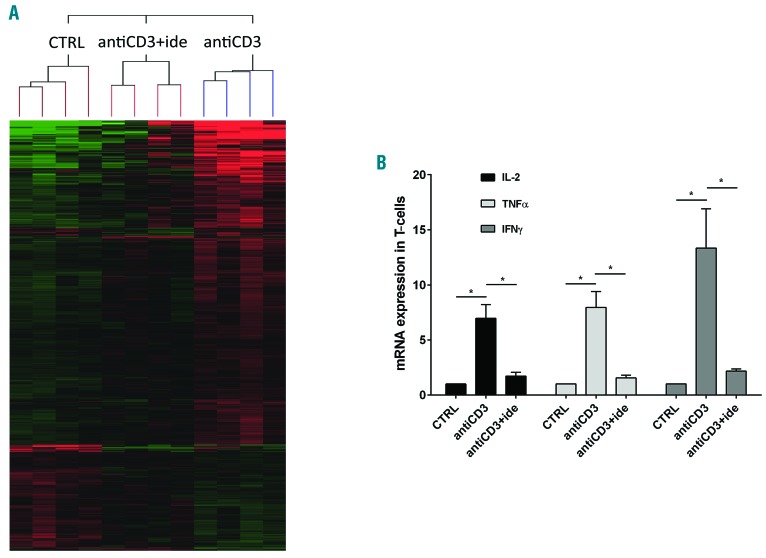
Idelalisib reduces the cytokine expression in activated T cells of chronic lymphocytic leukemia (CLL) patients. (A) Supervised hierarchical clustering of gene expression profiles in RNA samples of T cells purified from 4 CLL patients, each cultured with the three following conditions: i) control (CTRL, no treatment/no stimulation); ii) antiCD3 (stimulation with antiCD3 antibody); iii) antiCD3+ide (5 mM idelalisib pre-treatment followed by antiCD3 stimulation). Shown are genes differentially expressed between the described conditions, compared by Anova test; P≤0.01. Green squares: low levels of transcript; red squares: high levels of transcript; black squares: equal level of transcript. Complete microarray data are deposited in the NCBI Gene Expression Omnibus (GEO, http://www.ncbi.nlm.nih.gov/geo/ ) and are accessible through GEO accession number GSE108224. (B) Expression levels of IL-2, TNFα and IFNγ were measured by real-time PCR in RNA samples of T cells purified from 5 CLL patients and cultured with the same three conditions described in (A). Values are represented by the histograms as mean±Standard Error and normalized to CTRL values, defined as 1. IL-2, TNFα and IFNγ are significantly up-regulated by antiCD3 stimulation but idelalisib strongly abrogates these inductions (*P<0.05, Student t-test).
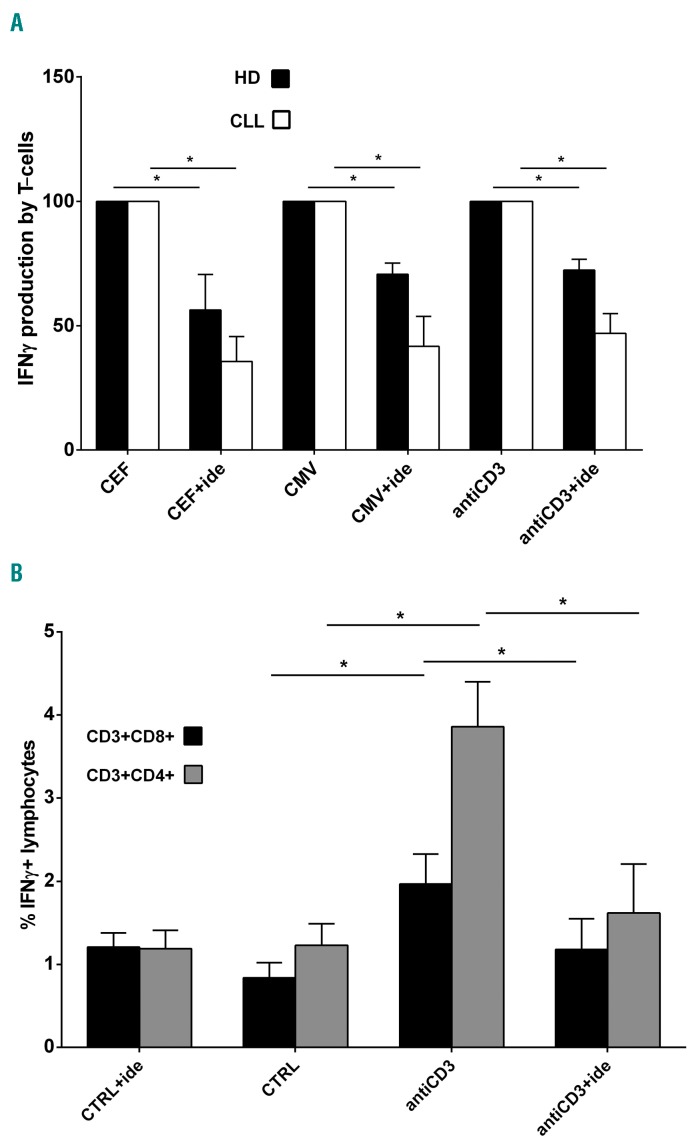
IFNγ release from stimulated T cells is impaired by idelalisib in chronic lymphocytic leukemia (CLL). (A) ELISpots for IFNγ release were performed on T samples obtained from 5 CLL patients and 4 healthy donors (HD), stimulated or not with antiCD3 antibody, cytomegalovirus (CMV) or CEF peptides, in the presence or absence of 5 μM idelalisib. In the graph, the spot number obtained with the drug is indicated as mean percentage±Standard Error (SE) of the spot number observed with the correspondent stimulation, defined as 100%. Black squares: HD; white squares: CLL. Since control (CTRL, no treatment/no stimulation) and CTRL+ide (idelalisib treatment/no stimulation) conditions showed the same IFNγ spot number (usually zero) for all CLL and HD T samples, they have not been included in the graph. The increased production of IFNγ induced in T cells by each stimulation is significantly decreased by idelalisib, both for CLL and HD (*P<0.05, Student t-test). (B) IFNγ cytokine secretion assays (CSA) were performed on T samples collected from 5 CLL patients, pre-treated or not with 5 μM idelalisib and stimulated or not with antiCD3 antibody. We acquired approximately 100,000 events inside the “lymphocytes” gate and the analysis identified the IFNγ+ lymphocytes inside the CD3+CD8+ or CD3+CD4+ gates. In the graph, the mean percentages±SE of CD3+CD8+IFNγ+ and CD3+CD4+IFNγ+ lymphocytes are represented with black squares and with gray squares, respectively. Control (CTRL, no treatment/no stimulation) and CTRL+ide (idelalisib treatment/no stimulation) show substantially the same percentages of CD3+CD8+IFNγ+ and CD3+CD4+IFNγ+ lymphocytes (P=n.s., Student t-test). With antiCD3 stimulation, these percentages become respectively 2.3 and 3.1-fold higher in comparison to CTRL (*P<0.05, Student t-test). The presence of idelalisib under stimulation reduces the percentages of CD3+CD8+IFNγ+ and CD3+CD4+IFNγ+ lymphocytes by 1.7 and 2.4 times, respectively, if compared to antiCD3 stimulation alone (*P<0.05, Student t-test). n.s.: not significant.
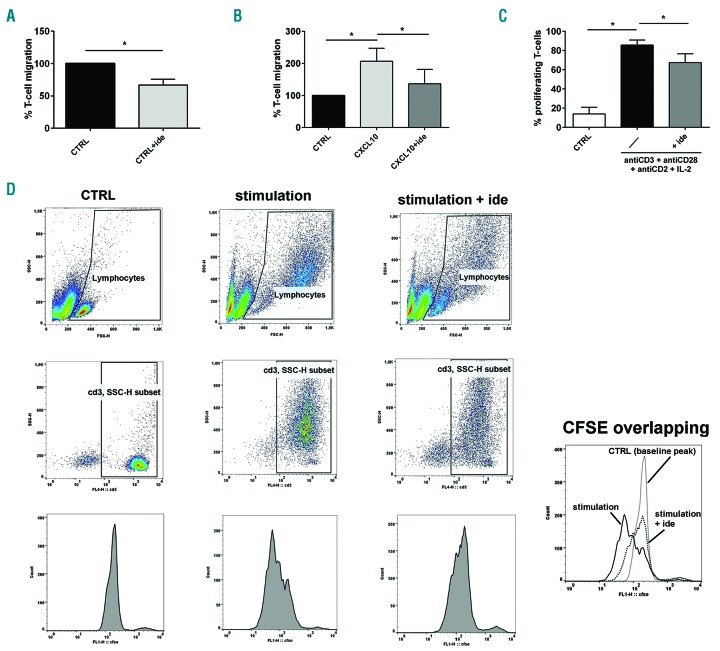
Idelalisib inhibits T-cell migration and proliferation in chronic lymphocytic leukemia (CLL). (A) Migration experiments were performed on T cells purified from 5 CLL patients, in presence or in absence of 5 μM idelalisib [Control (CTRL)+ide and CTRL, respectively]. The histograms represent the mean percentages±Standard Error (SE) of migrated cells normalized to CTRL, defined as 100%. The drug strongly reduced the number of T cells that spontaneously migrated (*P<0.05, Student t-test). (B) T cells purified from 6 CLL patients were stimulated with CXCL10 in the presence or absence of 5 μM idelalisib and tested for their migration. The mean percentage±SE of migrated T cells was normalized to CTRL (no treatment/no stimulation), defined as 100%. The number of migrated cells is increased by CXCL10 stimulation but is significantly decreased by idelalisib (*P<0.05, Student t-test). (C) Proliferation ability was evaluated by flow cytometry by analyzing the CFSE dilution peaks in T cells purified from 3 CLL patients, pre-treated or not with 5 μM idelalisib and stimulated with a mix of antiCD3+antiCD28+antiCD2 antibodies and IL-2. Not treated/non-stimulated cells were used as controls (CTRL). The mean percentages±SE of proliferating T cells are represented by the histograms. The increased T-cell proliferation obtained with stimulation is significantly reduced by the drug (*P<0.05, Student t-test). (D) Strategy example for the flow-cytometry analysis of T-cell proliferation in the three tested conditions: i) CTRL (not treated/non-stimulated cells), ii) stimulation (stimulation with a mix of antiCD3+antiCD28+antiCD2 and IL-2), iii) stimulation+ide (pre-treatment with 5 μM idelalisib followed by stimulation with a mix of antiCD3+antiCD28+antiCD2 and IL-2). We acquired approximately 10,000 events inside the “lymphocytes” gate based on FSC-H and SSC-H features. For the analysis, inside this first gate we drew a “CD3, SSC-H subset” gate, including only CD3+ cells. Inside this last gate, we evaluated the CFSE dilution peaks of proliferating cells, located to the left of the baseline CFSE peak identified based on the CTRL. For each studied case, we drew the same gates for all three conditions. In the single box on the bottom right, the CSFE dilution peaks of T cells are overlapped and compared between the described conditions.
References
Publication types
MeSH terms
Substances
LinkOut - more resources
Full Text Sources
Other Literature Sources
Molecular Biology Databases
