

Lateral plasma membrane compartmentalization links protein function and turnover
- PMID: 29976762
- PMCID: PMC6092676
- DOI: 10.15252/embj.201899473
Lateral plasma membrane compartmentalization links protein function and turnover
Abstract
Biological membranes organize their proteins and lipids into nano- and microscale patterns. In the yeast plasma membrane (PM), constituents segregate into a large number of distinct domains. However, whether and how this intricate patchwork contributes to biological functions at the PM is still poorly understood. Here, we reveal an elaborate interplay between PM compartmentalization, physiological function, and endocytic turnover. Using the methionine permease Mup1 as model system, we demonstrate that this transporter segregates into PM clusters. Clustering requires sphingolipids, the tetraspanner protein Nce102, and signaling through TORC2. Importantly, we show that during substrate transport, a simple conformational change in Mup1 mediates rapid relocation into a unique disperse network at the PM Clustered Mup1 is protected from turnover, whereas relocated Mup1 actively recruits the endocytic machinery thereby initiating its own turnover. Our findings suggest that lateral compartmentalization provides an important regulatory link between function and turnover of PM proteins.
Keywords: amino acid permease; endocytosis; lateral membrane segregation; patchwork membrane; plasma membrane.
© 2018 The Authors.
Figures
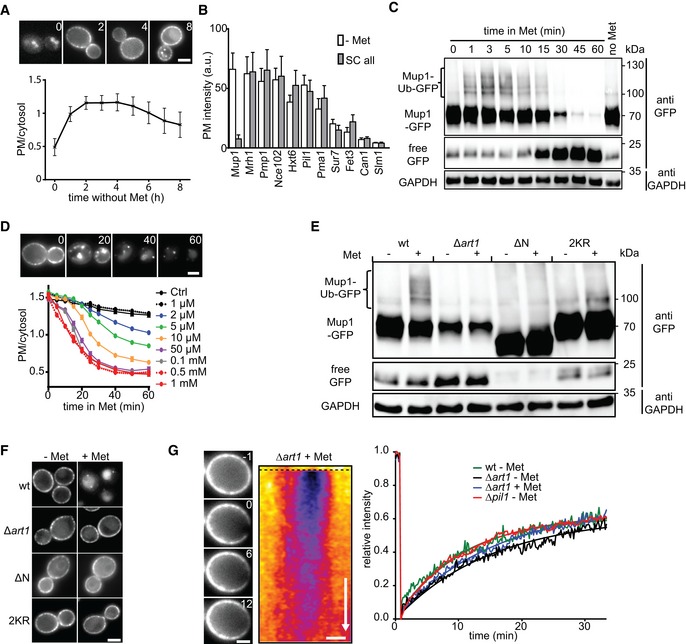
Expression and localization of Mup1‐GFP to the PM upon Met starvation (timestamps in hours). Values are means ± SD, n > 60 cells.
PM expression of various GFP‐fusion proteins in cells grown on complete and Met‐deficient media. Values are means ± SD, n = 20–300 cells.
Western blot showing Mup1 ubiquitination (Ub) and degradation at different time points after addition of Met. Loading control: glyceraldehyde‐3‐phosphate dehydrogenase (GAPDH).
Effect of different Met concentrations on Mup1 internalization kinetics. Values are means ± SEM, n > 50 cells (timestamps in min).
Western blot showing Mup1 ubiquitination (Ub) of the indicated mutants 5 min after Met addition. Loading control as in (C).
Mup1 endocytosis of the mutants used in (E).
FRAP analysis of Mup1‐GFP. Timestamps in min relative to bleaching event. The kymograph was drawn around the cell periphery and shows fluorescence recovery in the bleached area. Recovery curves represent averaged values from n = 3–5 cells. Smooth lines indicate exponential fits. Time arrow: 10 min.
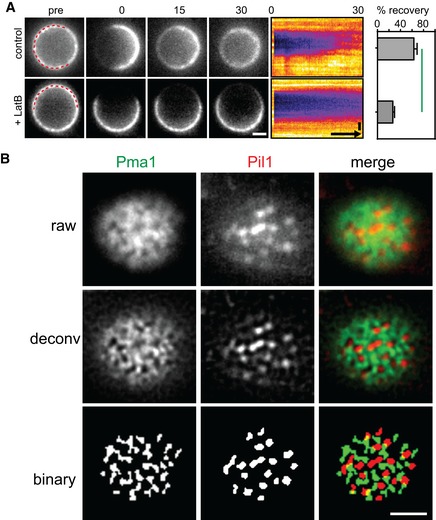
FRAP analysis of Mup1‐GFP in the presence and absence of 100 μM LatB. Times are given in min relative to localized bleaching of fluorescence. The kymograph was drawn around the indicated cell periphery (red dashed lines) and shows fluorescence recovery in the bleached area. Mup1‐GFP fluorescence recovery was determined in the bleached area at t = 30 min. Time arrow represents 10 min. Values are means ± SD, n = 10 cells. The green line indicates significantly different data sets. An overview of the performed statistics can be found in Table EV3.
Representative raw, deconvolved (deconv), and thresholded (binary) TIRFM images generated by an automated MATLAB algorithm to determine the degree of colocalization of GFP and RFP signals (Pearson Mean) and to quantify the fraction of the GFP signal present in the RFP‐labeled structure (GFP overlap).
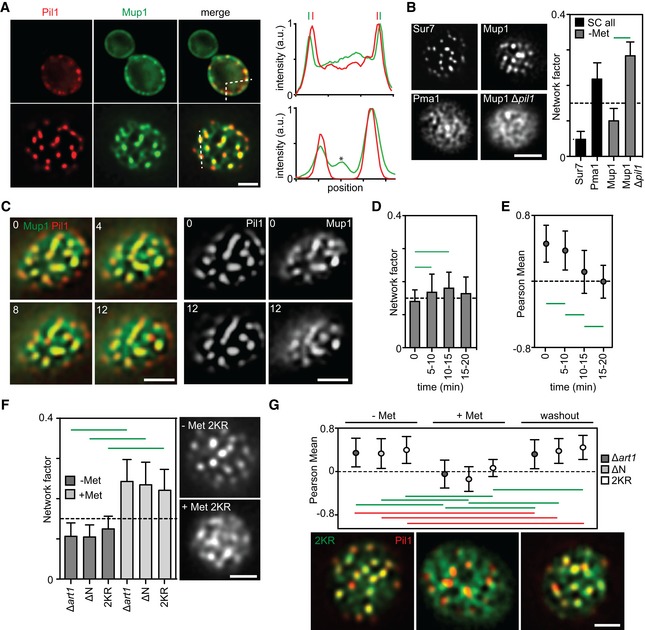
Equatorial and TIRFM images showing Mup1 clustering in the MCC in the absence of its substrate. Intensity profiles correspond to the dotted lines within the merge images and show Mup1 also partitioning outside the Pil1 signal (above), with additional density mapping to a network‐like domain (bottom, asterisk).
Mup1‐GFP intensity distribution (Network factor) indicating network (above dotted line) and patchy (below dotted line) patterns. Sur7 and Pma1 serve as references for patchy and network‐like distributions, respectively. Representative TIRFM images of the different patterns are shown.
Left, two‐color representative TIRF images illustrating Mup1‐GFP exit from the MCC labeled by Pil1‐RFP upon addition of Met. Right, single channel images at the earliest and the latest time points for better visualization (timestamps in min).
Mup1‐GFP distribution upon substrate addition shown by the Network factor.
Mup1‐GFP colocalization with Pil1‐RFP after substrate addition for indicated times.
Mup1‐GFP distribution upon substrate addition in the indicated mutants. Representative TIRFM images for the Mup1‐2KR mutant are shown.
Substrate‐dependent and reversible Mup1 relocation shown by quantification of its colocalization with Pil1‐RFP in the indicated mutants. Representative two‐color TIRFM images are shown for the Mup1‐2KR mutant.
- A
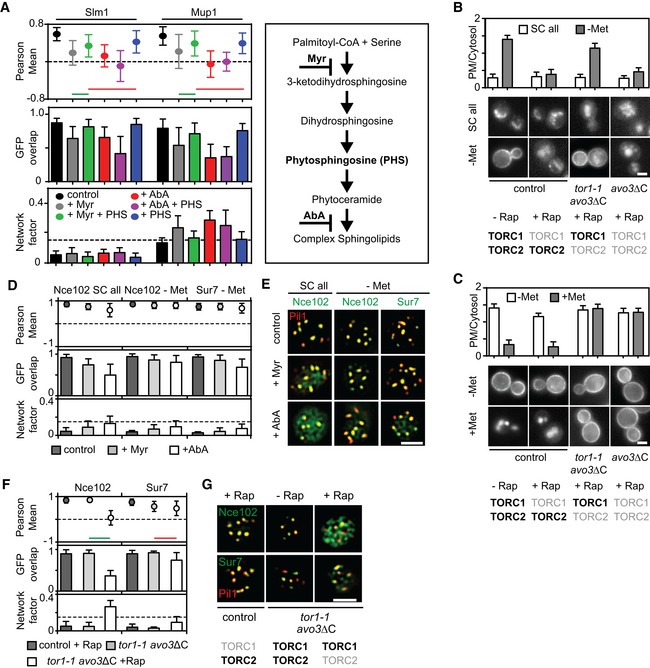
Myriocin—but not aureobasidin A—induced Slm1 and Mup1 MCC exit is reversed upon treatment with phytosphingosine (PHS). Pil1‐RFP was used to determine the degree of concentration within the MCC.
- B, C
Requirements of TORC1 and TORC2 for the delivery of Mup1‐GFP to the PM upon methionine starvation (B) and for Mup1 endocytosis upon addition of methionine (C). In control cells, only TORC1 is rapamycin (Rap) sensitive, in the avo3ΔC mutant, both TORC1 and TORC2 are sensitive to rapamycin, and in the tor1‐1/avo3ΔC mutant, only TORC2 is rapamycin‐sensitive. Representative equatorial images are shown.
- D
Influence of sphingolipid stress on the lateral segregation of the tetraspanners Nce102 and Sur7 under Met starvation. Pil1‐RFP was used to determine the degree of concentration within the MCC.
- E
Representative two‐color TIRFM images from the experiments summarized in (D).
- F
Nce102 leaves the MCC upon TORC2 inhibition.
- G
Representative two‐color TIRFM images from the experiments summarized in (F).
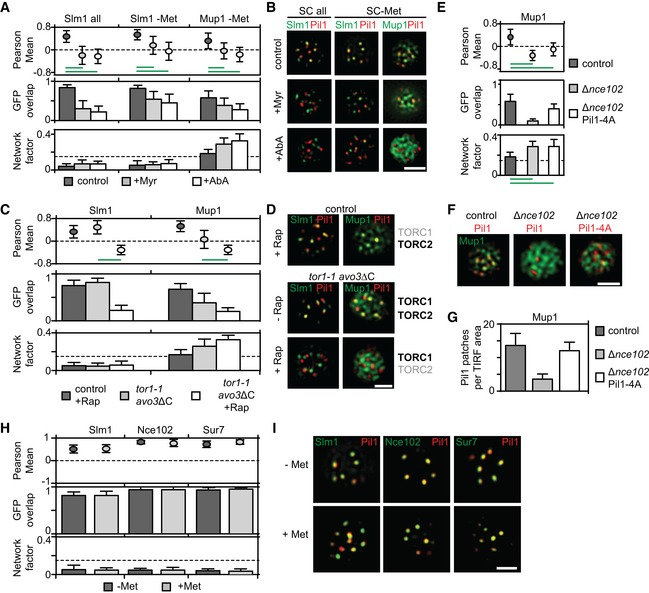
Effect of sphingolipid stress on relocation of Slm1 and on Mup1 clustering in the absence of Met. Colocalization with Pil1‐RFP (Pearson Mean), GFP overlap (fraction of the GFP signal found within the structure marked by Pil1‐RFP), and Network factor are given. Myriocin (Myr) blocks the first step in sphingolipid synthesis, while aureobasidin A (AbA) blocks the formation of complex sphingolipids.
Representative two‐color TIRFM images from the experiments summarized in (A).
Degrees of Mup1 clustering in the MCC in the indicated strains and upon TORC1/2 inhibition with rapamycin (Rap). The tor1‐1 mutant makes TORC1 rapamycin‐insensitive, while the avo3ΔC mutant renders TORC2 rapamycin‐sensitive.
Representative two‐color TIRFM images from the experiments summarized in (C). Light gray labels indicate inactive TOR complexes; bold labels indicate active TOR complexes.
Nce102 is required for Mup1 clustering into the MCC.
Representative two‐color TIRFM images of the Nce102‐dependent clustering of Mup1‐GFP in the PM from the experiments summarized in (E).
Nce102‐dependent eisosome stability shown as number of Pil1‐RFP or Pil1‐4A‐RFP patches per area.
Lateral segregation of Slm1, Nce102, and Sur7 before and after Met addition.
Representative two‐color TIRFM images from the experiments summarized in (H).
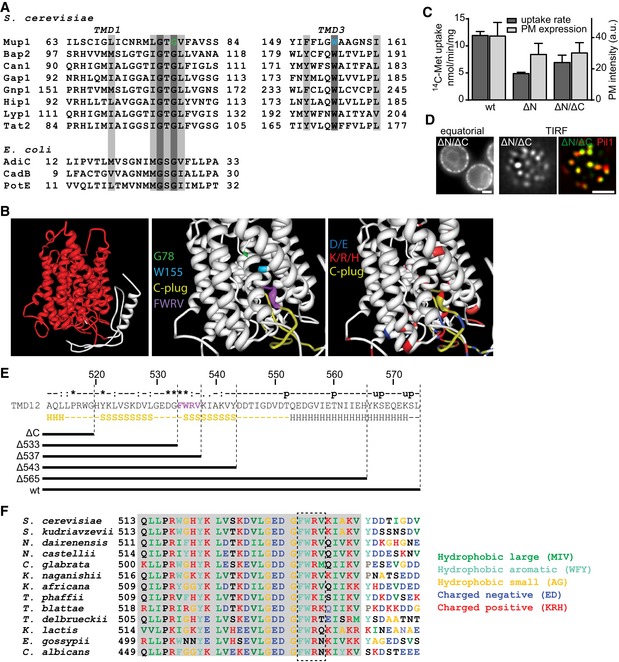
Sequence alignments of predicted TMD1 and TMD3 of Mup1 with those of other yeast and Escherichia coli transporters. Conserved residues (dark gray), conservative replacements (light gray), and selected Mup1 mutations (G78 and W155) are highlighted.
Structural organization of Mup1 as predicted by the Phyre2 software. High (red) and low (white) confidence predictions are highlighted (left panel). Mutations affecting Met transport (green and light blue), the C‐terminal “plug” oriented toward the substrate‐binding pocket (yellow), the conserved C‐terminal motif required for Mup1 localization and function (purple), as well as negatively (dark blue) and positively (red) charged residues around the binding pocket and the “C‐plug” are indicated (middle and right panels).
14C‐methionine uptake rates and PM expression of truncations and GFP‐fused Mup1 mutants. Values are means ± SD, n = 2 experiments (uptake) and n > 70 cells (PM expression).
Representative equatorial and TIRFM images of Mup1ΔN/ΔC‐GFP in the absence of Met, showing its delivery to the PM and partitioning into the MCC (colocalization with Pil1‐RFP). Scale bars: 2 μm.
Sequence of the Mup1 C‐terminal region. Degrees of conservation among Mup1 homologues (from ClustalW) calculated from various other fungi as shown in (F) (u: predicted ubiquitination site, p: predicted phosphorylation site) are indicated above the sequence, with secondary structure predictions (H: alpha helix, S: beta sheet) below it. The predicted “C‐plug” is indicated in yellow. The different C‐terminal truncations analyzed are shown.
Sequence alignment of the Mup1 C‐terminal segment (513–550) with homologues from various other fungi. Gray shading indicates conserved region.
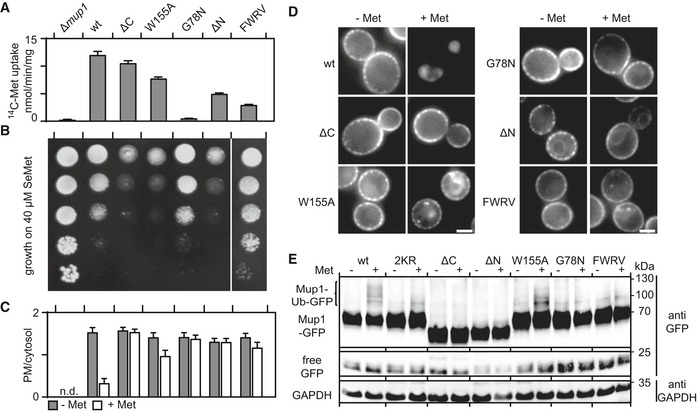
- A, B
Comparisons of the functional activities of different Mup1 mutants based on direct quantification of 14C‐Met uptake (A) and growth sensitivity to the toxic Met analog selenomethionine (SeMet, B). Growth assay is shown from top to bottom as a fivefold dilution series. White separator line indicates border to a lane that was removed from the original plate image.
- C, D
Endocytic internalization of the different Mup1 mutants fused to GFP. Ratios of PM to cytosolic fluorescence intensities (C) and representative images at equatorial planes (D) are shown.
- D
Western blot showing ubiquitination (Ub) of the indicated Mup1 mutants grown in the absence (−) and presence of Met (+, 5 min after addition). Loading control as in Fig 1C. Mutants utilized: wt, wild‐type Mup1; ΔC, deletion of the C‐terminal segment to aa519; W155A and G78N, point mutants; ΔN, deletion of the N‐terminal segment to aa52; FWRV, mutation of aa534–537 to alanines; 2KR, Mup1 with N‐terminal mutations K27R and K28R. All strains refer to Mup1 variants fused to C‐terminal GFP.
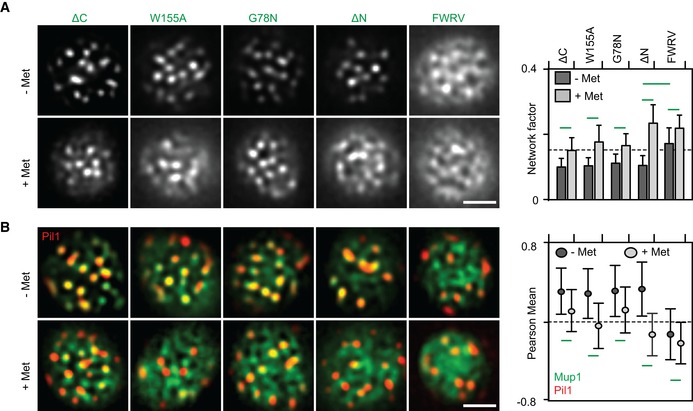
- A, B
Lateral PM segregation is shown in representative TIRFM images and quantified in terms of the Network factor (A) or the degree of colocalization with Pil1‐RFP (B). Mutants utilized as in Fig 4. All strains refer to Mup1 variants fused to C‐terminal GFP. Values are means ± SD, n = 50–250 cells. Green lines indicate significantly different data sets. An overview of the performed statistics can be found in Table EV3. Scale bars: 2 μm. All measured values are listed in Table EV1.
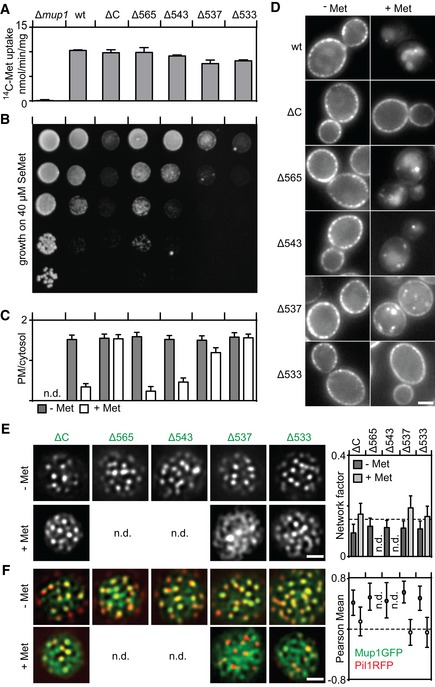
- A, B
Function of different Mup1 mutants as measured by direct quantification of 14C‐Met uptake (A) and growth sensitivity to the toxic Met analog selenomethionine (SeMet, B). Growth assay is shown from top to bottom as a fivefold dilution series.
- C, D
Endocytic internalization of different Mup1 mutants. Ratios of PM to cytosolic fluorescence intensities (C) and representative images at equatorial planes (D) are shown.
- E, F
Lateral PM segregation shown in representative TIRFM images and quantification of the Network factor (E) or the colocalization with Pil1‐RFP (F). Mutants utilized: wt (wild‐type Mup1), ΔC (deletion of C terminus after aa519), W155A and G78N (respective point mutants), Δ565/543/537/533 (deletion of C terminus beyond the indicated position). All strains refer to Mup1 variants fused to C‐terminal GFP.
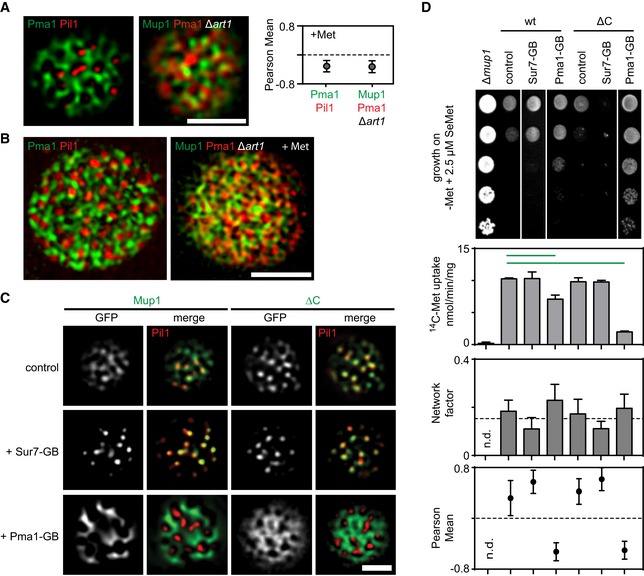
Representative two‐color TIRFM images showing the spatial separation between the MCC (shown as Pil1‐RFP) and the MCP (shown as Pma1‐GFP), and the distribution of Mup1 outside the MCC together with the MCP marker Pma1‐RFP in the absence of ubiquitination and upon Met addition. The graph shows the quantification of colocalization (Person Mean) for the indicated protein combinations.
Representative 3D‐SIM images showing the distribution of the indicated protein pairs in (A).
TIRFM images showing Mup1 and ΔC artificially recruited to different PM domains using the GFP trap system. GB, GFP‐binding nanobody. Pil1‐RFP was used to illustrate the degree of relocation out of the MCC.
Effects of forced relocation on SeMet sensitivity, rate of Met uptake, and the distribution of the respective Mup1‐GFP variant (Mup1/ΔC) in the PM (n.d., not determined). Growth assay is shown from top to bottom as a fivefold dilution series. White separator line indicates border to lanes that were removed from the original plate image. Note that the used concentration of SeMet (no added Met) was not sufficient to induce endocytosis of Mup1.
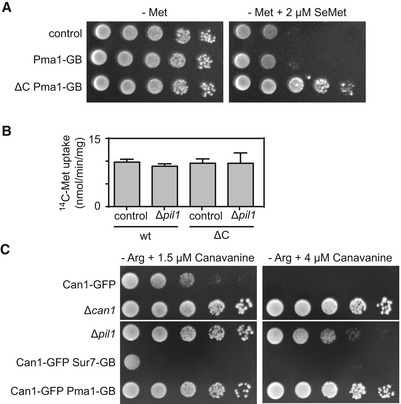
Growth assay of indicated mutants in the absence of methionine and in the absence or presence of 2 μm selenomethionine (SeMet).
14C‐methionine uptake rate measured for Mup1 and ΔC in the wt and the Δpil1 background. Values are means ± SD, n = 2–4 experiments. All values are listed in Table EV1.
Growth assay of indicated mutants in the absence of arginine (−Arg) and the presence of indicated concentrations of the toxic arginine analog canavanine. Growth assays are shown from left to right as a fivefold dilution series. White separator lines indicate borders to lanes that were removed from the original plate images.
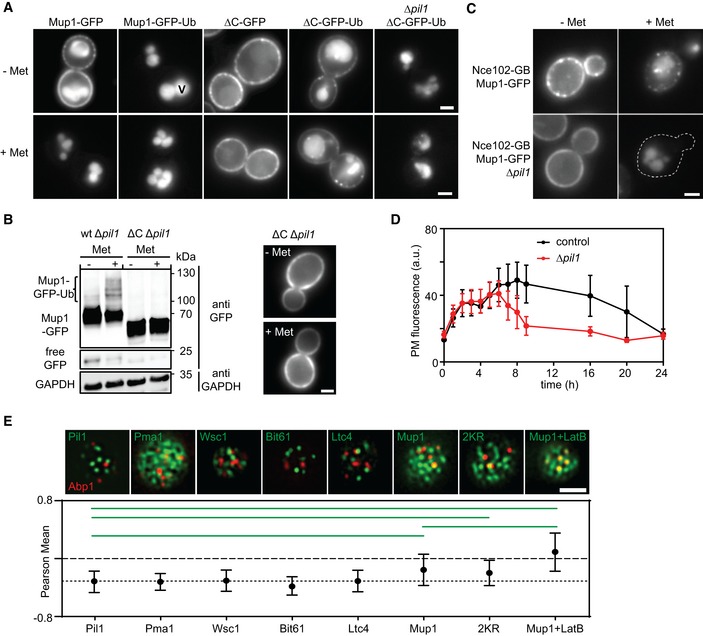
Influence of the in‐frame fusion of an ubiquitin (Ub) moiety to Mup1 and ΔC on PM localization and turnover. V = vacuole.
Western blot showing Mup1 and ΔC ubiquitination in Δpil1. Samples were prepared 5 min after addition of Met. Loading control as in Fig 1C. Representative images of indicated conditions are shown to illustrate defect in endocytosis of ΔC.
Artificial anchoring of Mup1 to Nce102 in the presence or absence (Δpil1) of MCC and Met, respectively.
Mup1 internalization during long‐term growth in the absence of Met.
Degree of colocalization of endocytic events (shown by the late endocytic marker Abp1‐RFP) with various PM domains (GFP fusions). Representative two‐color TIRFM images of the indicated protein pairs are shown. Pil1 represents eisosomes, Pma1 the MCP, Wsc1 the MCW (membrane compartment occupied by Wsc1), Bit61 the MCT, and Ltc4 the MCL (membrane compartment of Ltc3/4). Cells were grown in Sc‐Met and imaging performed after addition of 100 μM Met. LatB was used at a concentration of 100 μM to stabilize endocytic sites. The dotted line is used as a guide to the eye.
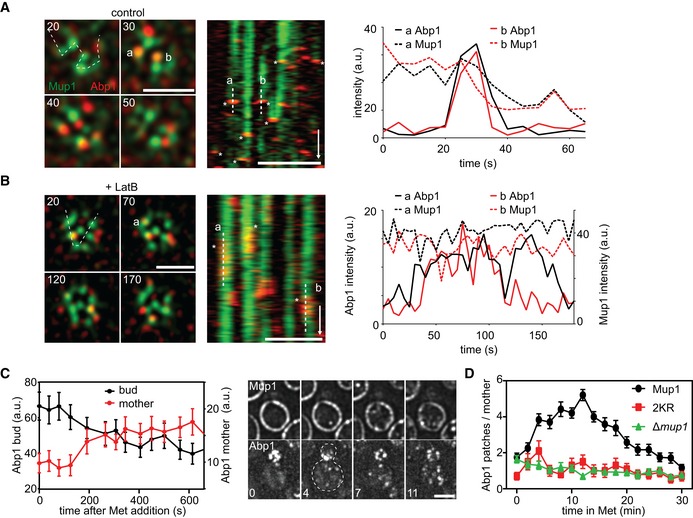
Correlation of endocytic patch localization (marked by Abp1‐RFP) with Mup1 distribution. Kymographs (along the dotted line in the indicated cells) show localization patterns starting 10–15 min after Met addition. Representative line scans illustrate coordinated assembly and removal of endocytic patches from the indicated traces in the kymographs (marked “a” and “b”). Timestamps are given in s, time arrow: 100 s.
Similar to the experiment in (A), except for the presence of 100 μM LatB. Note the longer lifetime of endocytic patches and the fact that there is no change in the fluorescence of Mup1‐GFP upon disassembly of Abp1‐RFP. Timestamps are given in s, time arrow: 100 s.
Changes in the relative intensity of the Abp1‐RFP signals in the bud (black) and the mother cell (red) following the addition of Met. Representative images of Abp1‐RFP and Mup1‐GFP of a polarized cell are shown. Timestamps are given in min.
Number of Abp1‐RFP patches in the mother cell during Met addition in the indicated strains. Growing cells with small buds and highly polarized Abp1 were individually selected, and the amount of Abp1 patches in the mother cell manually quantified.
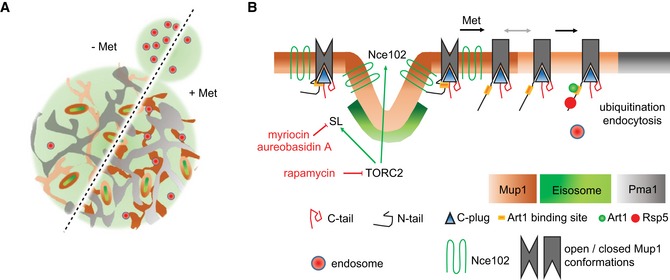
Lateral organization of the yeast PM indicating relevant domains occupied by the indicated proteins. Upon addition of its substrate (+ Met), Mup1 relocates from the MCC (brown area around eisosomes) into a network‐like domain (light or dark brown), which is distinct from that marked by Pma1 (gray). Endocytosis in polarized cells is usually focused in the bud region but becomes depolarized upon addition of methionine.
During substrate transport Mup1 undergoes a conformational change (indicated by the different gray shapes) that facilitates exposure of the N‐terminal ubiquitination sites and exit from the MCC (gray arrow). Ubiquitination and domain relocation both require an intact C‐plug (blue triangle). Exposure of the N terminus permits binding of Art1 (green circle) and subsequent recruitment of the ubiquitin ligase Rsp5 (red circle). Once modified, Ub‐Mup1 recruits the endocytic machinery (red circle with blue rim) and becomes internalized. The legend describes all indicated domains and proteins. Green arrows indicate activation, and red lines with bars indicate inhibition.
Comment in
-
Functional patchworking at the plasma membrane.EMBO J. 2018 Aug 15;37(16):e100144. doi: 10.15252/embj.2018100144. Epub 2018 Jul 30. EMBO J. 2018. PMID: 30061314 Free PMC article.
References
-
- Aguilar PS, Frohlich F, Rehman M, Shales M, Ulitsky I, Olivera‐Couto A, Braberg H, Shamir R, Walter P, Mann M, Ejsing CS, Krogan NJ, Walther TC (2010) A plasma‐membrane E‐MAP reveals links of the eisosome with sphingolipid metabolism and endosomal trafficking. Nat Struct Mol Biol 17: 901–908 - PMC - PubMed
-
- Berchtold D, Piccolis M, Chiaruttini N, Riezman I, Riezman H, Roux A, Walther TC, Loewith R (2012) Plasma membrane stress induces relocalization of Slm proteins and activation of TORC2 to promote sphingolipid synthesis. Nat Cell Biol 14: 542–547 - PubMed
-
- Brach T, Specht T, Kaksonen M (2011) Reassessment of the role of plasma membrane domains in the regulation of vesicular traffic in yeast. J Cell Sci 124: 328–337 - PubMed
Publication types
MeSH terms
Substances
LinkOut - more resources
Full Text Sources
Other Literature Sources
Molecular Biology Databases
