. 2018 Jul 5;9(1):2620.
doi: 10.1038/s41467-018-05038-2.

Feeders facilitate telomere maintenance and chromosomal stability of embryonic stem cells

Affiliations

Feeders facilitate telomere maintenance and chromosomal stability of embryonic stem cells

Renpeng Guo et al. Nat Commun. .

Abstract

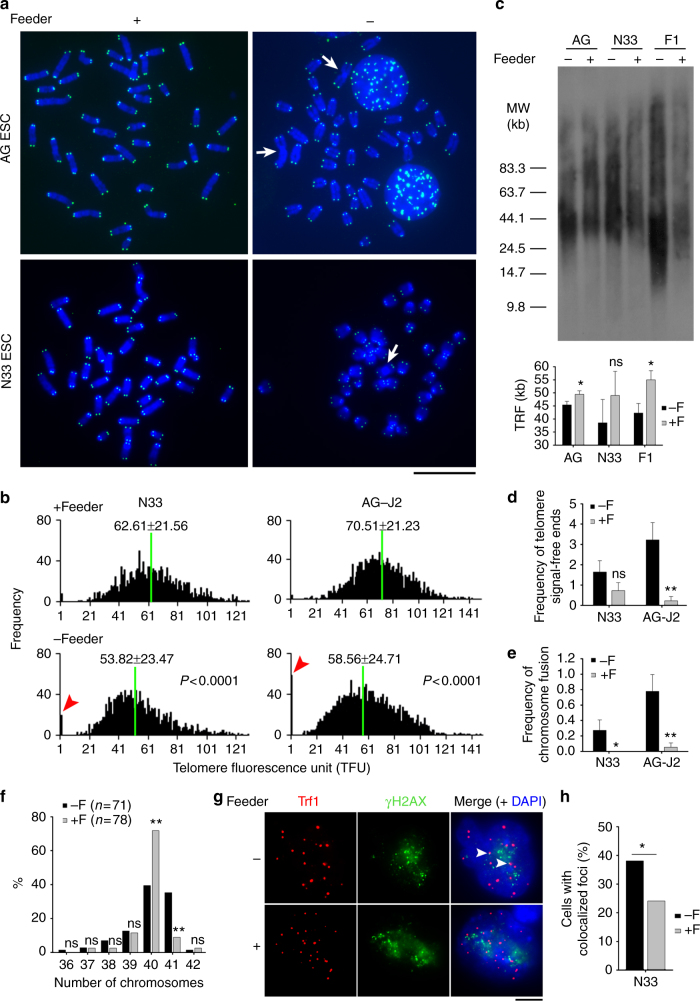
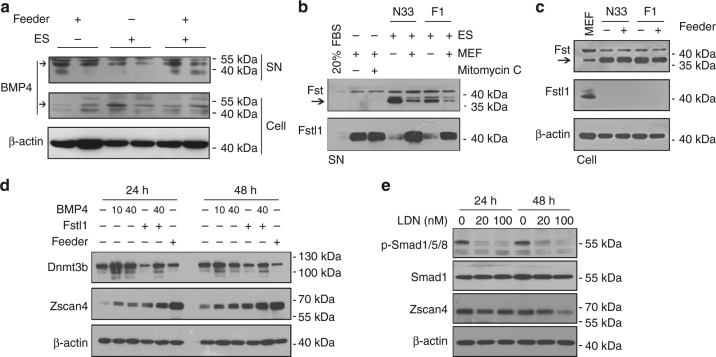
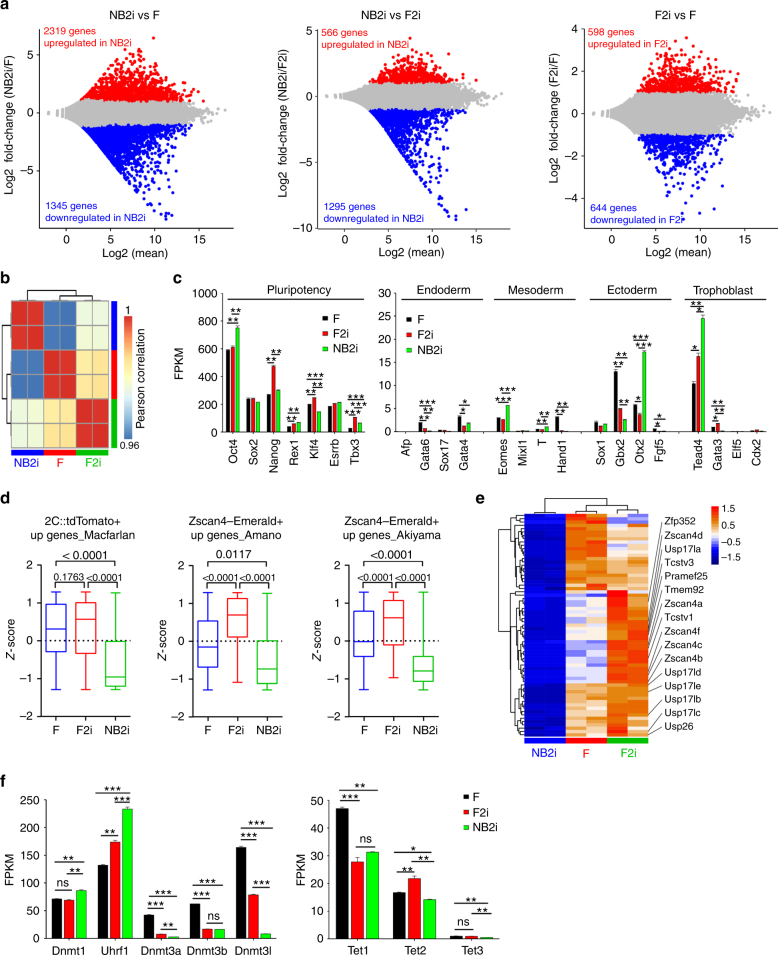
Feeder cells like mouse embryonic fibroblasts (MEFs) have been widely applied for culture of pluripotent stem cells, but their roles remain elusive. Noticeably, ESCs cultured on the feeders display transcriptional heterogeneity. We investigated roles of feeder cells by examining the telomere maintenance. Here we show that telomere is longer in mESCs cultured with than without the feeders. mESC cultures without MEF feeders exhibit telomere loss, chromosomal fusion, and aneuploidy with increasing passages. Notably, feeders facilitate heterogeneous transcription of 2-cell genes including Zscan4 and telomere elongation. Moreover, feeders produce Fstl1 that together with BMP4 periodically activate Zscan4. Interestingly, Zscan4 is repressed in mESCs cultured in 2i (inhibitors of Mek and Gsk3β signaling) media, associated with shorter telomeres and increased chromosome instability. These data suggest the important role of feeders in maintaining telomeres for long-term stable self-renewal and developmental pluripotency of mESCs.


Conflict of interest statement

The authors declare no competing interests.

Figures

Fig. 1
Fig. 1
Feeders maintain telomeres of ESCs. a Representative telomere Q-FISH images of N33 and AG-J2 ESCs cultured on gelatin or feeder. blue, chromosomes stained by DAPI; green dots, telomeres; white arrows indicate chromosome fusion. Scale bar, 10 μm. b Histogram shows distribution of relative telomere length displayed as TFU by Q-FISH analysis. Green line indicates medium telomere length. Mean ± s.d. of telomere length is shown above each panel. Heavy black bars on Y-axis show the frequency of telomere signal-free ends. Telomere length was measured at passage 8 for N33 ESCs and passage 20 for AG-J2 ESCs under feeder or feeder-free conditions. P values were calculated by Wilcoxon–Mann–Whitney rank sum test. c Telomere length distribution shown as TRF by Southern blot analysis of N33 ESCs at passage 10, F1 ESCs at passage 21 and AG ESCs at passage 5 cultured with or without feeders. d Frequency of telomere signal-free ends indicative of shortest telomere per metaphase. e Frequency of chromosome fusion per metaphase. Mean ± s.e.m. f Distribution of chromosome numbers in ESCs cultured with or without feeders for 8–10 passages. n = number of spread analyzed. g Immunofluorescence images of Trf1 (red) and γH2AX (green). Colocalized foci are indicated by arrowheads. Scale bar, 5 μm. h Percentage of ESCs with colocalized foci of Trf1 and γH2AX. n = 100 nuclei counted from the images captured in g. *P < 0.05, **P < 0.01, ns not significant (P > 0.05). Student’s t-test for ce, and χ2 test for f and h
Fig. 2
Fig. 2
Feeders increase Zscan4 expression and T-SCE in ESCs. a Morphology of F1 ESCs cultured in feeder or feeder-free conditions under bright field (BF) with phase-contrast optics and immunofluorescence of pluripotency-associated markers Oct4, Nanog, and SSEA1. Scale bar, 100 μm. b Expression by qPCR analysis of Oct4, Sox2, and Nanog in F1 ESCs cultured without (−F) or with feeders (+F). c Expression of telomerase-related genes Tert, Terc, and c-Myc in −F and +F ESCs. d Telomerase activity measured by TRAP assay. Lysis buffer served as negative control. e Expression by qPCR of genes for telomere recombination, Dmc1, Rad50, Spo11, and 2C genes, Zscan4, Tcstv1, and Tcstv3. f Immunofluorescence co-staining of Oct4 and Zscan4 shows Zscan4-positive cells mutually exclusive of Oct4. Scale bar, 20 μm. g Relative Zscan4 fluorescence intensity estimated by ImageJ and percentage of Zscan4+ cells (number of ESCs counted). h Flow cytometry quadrantal diagram indicates percentage and mean fluorescence intensity of Zscan4+ cells in ESCs. i Western blot analysis of Zscan4 in −F and +F ESCs. j Representative CO-FISH images showing T-SCE (indicated by white arrows) in −F and +F ESCs. Red arrow, chromosome fusion. Scale bar, 10 μm. k Frequency of T-SCE (total T-SCE/total chromosomes) and percentage of ESCs with T-SCE foci ≥10 in −F and +F ESCs. ck N33 ESCs. Mean ± s.e.m. from three independent experiments. *P < 0.05, **P < 0.01, ***P < 0.001, ns not significant (P > 0.05). χ2 test for g (right) and k, and Student’s t-test for b, c, e, g (left). −F without feeders, +F with feeders
Fig. 3
Fig. 3
Knockdown of Zscan4 leads to telomere shortening and overexpression of Zscan4 elongates telomeres. a Colony morphology of control and Zscan4 knockdown (KD) J1 ESCs cultured on feeders, Scale bar, 50 μm. b Depletion of Zscan4 validated by qPCR and western blot after stable Zscan4 KD for 12 passages. Mean ± s.e.m. ***P < 0.001. Student’s t-test. c Representative telomere Q-FISH images of control and Zscan4 KD ESCs. Blue, chromosomes stained by DAPI; green dots, telomeres. Scale bar, 10 μm. d Histogram shows distribution of relative telomere length displayed as TFU by Q-FISH analysis. Green line indicates medium telomere length. Mean ± s.d. of telomere length is shown above each panel. P1, compared with Mock KD-1, P2, compared with Mock KD-2. Wilcoxon–Mann–Whitney rank sum test. e Telomere length distribution shown as TRF by Southern blot analysis. f Representative telomere Q-FISH images of control and Zscan4 overexpression (OE) J1 ESCs cultured without feeders. Scale bar, 10 μm. g Histogram shows distribution of relative telomere length displayed as TFU by Q-FISH analysis. Wilcoxon–Mann–Whitney rank sum test. h Telomere length distribution shown as TRF by Southern blot analysis of control and Zscan4 OE ESCs at two indicated passages (P11 and P14)
Fig. 4
Fig. 4
Transcriptome and signal pathways by RNA-seq analysis. a Heatmap illustrating differentially expressed genes (DEGs) between N33 ESCs cultured without (−F) and with feeders (+F). Two biological replicates were analyzed per group. Genes with ≥2-fold expression changes, Padj < 0.05 were chosen for heatmap. b Expression levels (FPKMs) of pluripotency and lineage marker genes in −F and +F ESCs. c Z-scores of several gene lists: upregulated genes in 2C::tdTomato+ ESCs from Macfarlan et al., Zscan4-Emerald + ESCs from Amano et al., or in Zscan4-Emerald + ESCs from Akiyama et al.. d Heatmap shows expression of representative 2C genes in −F and +F ESCs. e Expression levels (FPKMs) of multiple genes involved in DNA (de)methylation. f The enriched KEGG pathways of DEGs between −F and +F ESCs. g Expression levels (FPKMs) of BMP-Smad targeting Id genes. *P < 0.05, **P < 0.01, ***P < 0.001, ns not significant (P > 0.05). Student’s t-test
Fig. 5
Fig. 5
BMP4 and Fstl1 secreted by feeders increase Zscan4 expression. a Western blot analysis of BMP4 in cell extracts (Cell) and in the medium (supernatant, SN) under indicated conditions. b Western blot analysis of secreted Fst and Fstl1 by MEF (with or without mitomycin C treatment), ESCs and ESCs + MEF. The band of Fst is indicated by arrow. c Western blot analysis of global protein levels of Fst and Fstl1 in MEFs and ESCs. d Western blot analysis of Zscan4 and Dnmt3b protein levels after treatment with BMP4 or/and Fstl1. BMP4, 10 ng/ml and 40 ng/ml as indicated; Fstl1, 100 ng/ml. e Western blot analysis of pSmad1/5/8 and Zscan4 protein level following treatment with BMP signaling inhibitor LDN-193189 for 24 and 48 h at the indicated concentrations. β-actin served as loading control
Fig. 6
Fig. 6
2i repress Zscan4 and SSEA1. a Morphology under bright field with phase-contrast optics of N33 and F1 ESCs cultured in serum + feeder + LIF (feeder) or N2B27 + 2i + LIF (2i) conditions. Scale bar, 100 μm. b Immunofluorescence of pluripotency-associated markers Oct4, Nanog and SSEA1 in N33 ESCs (five passages). Scale bar, 10 μm. c Zscan4 protein levels by western blot (three passages). d Immunofluorescence showing co-staining of Oct4 and Zscan4 in N33 ESCs. Scale bar, 10 μm. e Percentage of Zscan4+ cells in ~1500 ESCs counted. f Flow cytometry quadrantal diagram indicating proportion of Zscan4+ cells in a ESC population. g Representative CO-FISH images showing T-SCE (indicated by white arrows) in feeder- and 2i- ESCs. Scale bar, 10 μm. h Frequency of T-SCE (total T-SCE/total chromosomes) and percentage of ESCs with T-SCE foci ≥ 10. i Expression of telomerase-related genes Tert, Terc, and c-Myc in feeder- and 2i- ESCs. j Telomerase activity measured by TRAP assay. Lysis buffer served as negative control. **P < 0.01, ***P < 0.001, ns not significant (P > 0.05). Student’s t-test for i, and χ2 test for e and h
Fig. 7
Fig. 7
Global gene expression profile in ESCs cultured with feeders and/or 2i. a Pairwise comparisons (Padj < 0.05, ≥2-fold expression levels) of ESCs cultured in N2B27 + 2i (NB2i) vs serum + feeder (F), NB2i vs serum + feeder (F2i) and F2i vs F to reveal non-redundant, significant changes in gene expression. Red dots represent significantly upregulated genes, blue dots downregulated genes, and gray dots represent genes that are not significantly changed. b The Pearson’s correlation coefficient to estimate the relationships between samples at the whole transcriptome level. c Expression levels (FPKMs) of pluripotency and lineage marker genes in ESCs under three culture conditions. d Z-scores of several lists of 2C genes. Lists used here are based on those of Fig. 4c. e Heatmap showing expression of representative 2C genes. f Expression levels (FPKMs) of multiple genes involved in DNA (de)methylation in ESCs under three culture conditions. *P < 0.05, **P < 0.01, ***P < 0.001, ns not significant (P > 0.05). ANOVA with Fisher’s protected least-significant difference (PLSD) was used for the statistical analysis
Fig. 8
Fig. 8
2i fail to maintain telomeres in ESC culture without feeders. a Representative telomere Q-FISH images of OG4 ESCs cultured under three culture conditions. Blue, chromosomes stained by DAPI; green dots, telomeres. Red arrowhead indicates chromosome fusion. Scale bar, 10 μm. b Histogram displaying distribution of relative telomere length shown as TFU. Green line indicates medium telomere length. Mean ± s.d. of telomere length is shown above each panel. At P16, P < 0.0001 (serum + F vs serum + F + 2i; serum + F + 2i vs N2B27 + 2i; serum + F vs N2B27 + 2i). Wilcoxon–Mann–Whitney rank sum test. c, d Frequency of telomere signal-free ends (c) and chromosomal fusion (d). ns not significant (P > 0.05), ANOVA with PLSD was used for the statistical analysis. e Distribution of chromosome numbers in ESCs cultured under three conditions. n = 30 spread counted for each group. ns not significant (P > 0.05). χ2 test. f Pup (black coat) born from OG4 ESCs cultured in N2B27 + 2i/L condition for four passages by TEC assay. g Comparison of expression levels of Dnmt3b and Zscan4, telomere lengths and developmental pluripotency of ESCs cultured under the three culture conditions (all added with LIF). GT germline transmission, TEC tetraploid embryo complementation, ↑ increased, ↓ decreased, ↑↓ vary in different cell lines, √ achieved, a, Huang et al.,; b, Ying et al.; c, Chen et al.

References

    1. Evans MJ, Kaufman MH. Establishment in culture of pluripotential cells from mouse embryos. Nature. 1981;292:154–156. doi: 10.1038/292154a0. - DOI - PubMed
    1. Eggan K, et al. Male and female mice derived from the same embryonic stem cell clone by tetraploid embryo complementation. Nat. Biotechnol. 2002;20:455–459. doi: 10.1038/nbt0502-455. - DOI - PubMed
    1. Nagy A, Rossant J, Nagy R, Abramow-Newerly W, Roder JC. Derivation of completely cell culture-derived mice from early-passage embryonic stem cells. Proc. Natl Acad. Sci. USA. 1993;90:8424–8428. doi: 10.1073/pnas.90.18.8424. - DOI - PMC - PubMed
    1. Jaenisch R, Young R. Stem cells, the molecular circuitry of pluripotency and nuclear reprogramming. Cell. 2008;132:567–582. doi: 10.1016/j.cell.2008.01.015. - DOI - PMC - PubMed
    1. Thomson JA, et al. Embryonic stem cell lines derived from human blastocysts. Science. 1998;282:1145–1147. doi: 10.1126/science.282.5391.1145. - DOI - PubMed

Publication types

MeSH terms