. 2018 Jul 5;8(1):10224.
doi: 10.1038/s41598-018-28503-w.

Modeling erythrocyte electrodeformation in response to amplitude modulated electric waveforms

Affiliations

Modeling erythrocyte electrodeformation in response to amplitude modulated electric waveforms

Yuhao Qiang et al. Sci Rep. .

Abstract

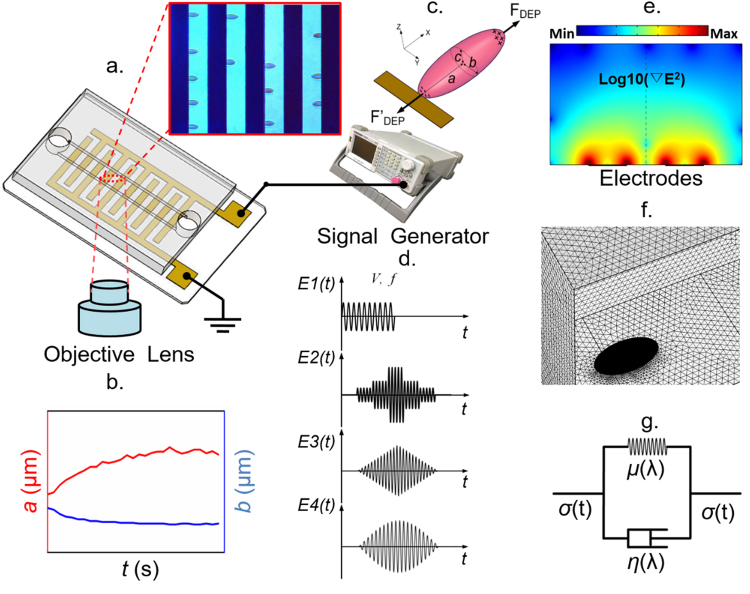
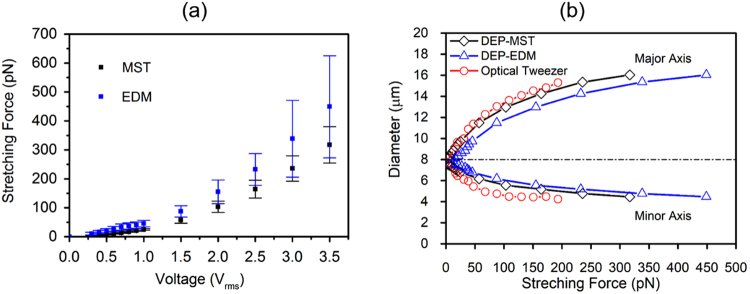
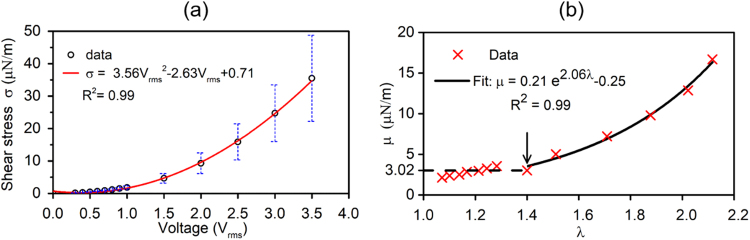
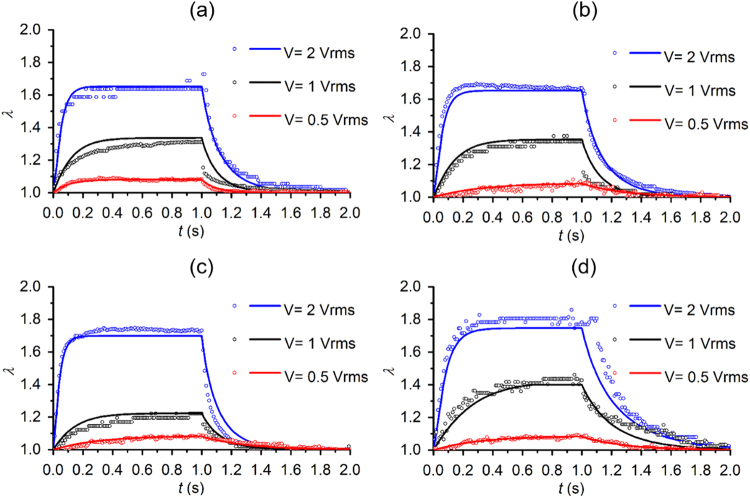
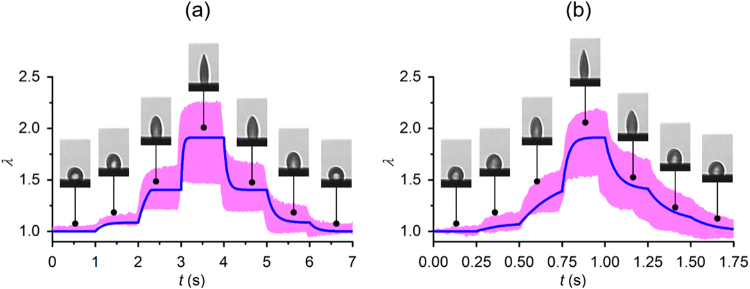
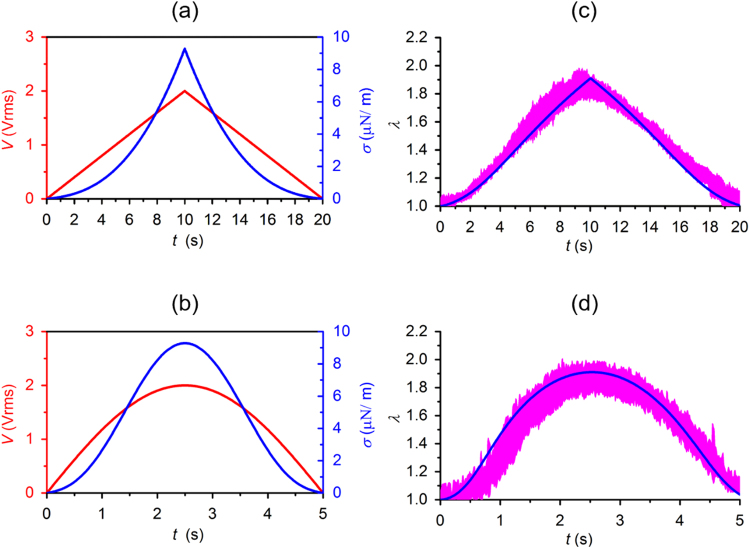
We present a comprehensive theoretical-experimental framework for quantitative, high-throughput study of cell biomechanics. An improved electrodeformation method has been developed by combing dielectrophoresis and amplitude shift keying, a form of amplitude modulation. This method offers a potential to fully control the magnitude and rate of deformation in cell membranes. In healthy human red blood cells, nonlinear viscoelasticity of cell membranes is obtained through variable amplitude load testing. A mathematical model to predict cellular deformations is validated using the experimental results of healthy human red blood cells subjected to various types of loading. These results demonstrate new capabilities of the electrodeformation technique and the validated mathematical model to explore the effects of different loading configurations on the cellular mechanical behavior. This gives it more advantages over existing methods and can be further developed to study the effects of strain rate and loading waveform on the mechanical properties of biological cells in health and disease.


Conflict of interest statement

The authors declare no competing interests.

Figures

Figure 1
Figure 1
Modeling and experimental framework for biomechanical analysis of live cells using amplitude-modulated DEP in microfluidics. (a) Schematic of the microfluidic device with inset of microscopic view of cellular deformation. Dark strips represent the interdigitated electrode array. (b) Major and minor axes of ellipse fitting of a deformed cell extracted from microscopic images. (c) Schematic of uniaxial stretching of single RBC by positive DEP force. (d) Representative ASK-modulated waveforms for various DEP loading profiles. (e) Surface plot of the gradient of field strength square in the microfluidic device. (f) Finite element model of cellular electrodeformation by COMSOL Multiphysics. (g) Kelvin-Voigt solid model of cell deformation.
Figure 2
Figure 2
(a) Mean values of the DEP stretching force as a function of excitation voltage, calculated by MST and EDM methods. (b) Variations of the major and minor axes of RBCs against stretching force obtained by DEP technique, calibrated by MST and EDM methods, as compared to optical tweezers technique.
Figure 3
Figure 3
(a) Mean values of shear stress and a best fit function of applied voltage levels. (b) Mean values of membrane shear modulus and best fit functions for nonlinear elastic moduli: for small deformations (λ < 1.4), membrane shear modulus, µ = 3.02 µN/m; for large deformations (λ > 1.4), μ = 0.21 × exp(2.06 × λ) − 0.25.
Figure 4
Figure 4
Quantitative comparisons of the theoretical calculations (solid lines) and the experimental observations (open circles) of cell deformation upon electric excitation profile E1 in 4 representative RBCs (ad). Excitation voltages 2 Vrms, 1 Vrms, and 0.5 Vrms are represented by blue, black, and red colors, respectively.
Figure 5
Figure 5
Quantitative comparisons of the theoretical predictions and the experimental observations (n = 10) of cellular deformations in response to a stepwise electric excitation E2. (a) Duration of each step is 1 s. (b) Duration of each step is 0.25 s. Insets show cell deformations of a representative RBC measured at specific times. The blue lines represent the theoretical calculation. Pink band represent the cell deformation profiles from 10 measurements.
Figure 6
Figure 6
Quantitative comparisons of the theoretical predictions and the experimental observations (n = 10) of cellular deformations in response to: (a) a triangular waveform excitation E3 (red curve) and the consequent shear stress (blue curve); and (b) a sinusoidal waveform excitation E4 (red curve) and the consequent shear stress (blue curve). (c,d) Theoretical predictions of cellular deformations (blue curve) and the experimental observations (n = 10, pink band).

Similar articles

Cited by

References

    1. Salehyar, S. & Zhu, Q. Effects of stiffness and volume on the transit time of an erythrocyte through a slit. Biomechanics and modeling in mechanobiology, 1–11 (2017). - PubMed
    1. Skalak R, Branemark P. Deformation of red blood cells in capillaries. Science. 1969;164:717–719. doi: 10.1126/science.164.3880.717. - DOI - PubMed
    1. Riva CE, Grunwald JE, Sinclair SH, Petrig B. Blood velocity and volumetric flow rate in human retinal vessels. Investigative ophthalmology & visual science. 1985;26:1124–1132. - PubMed
    1. Li X, et al. Patient-specific blood rheology in sickle-cell anaemia. Interface Focus. 2016;6:20150065. doi: 10.1098/rsfs.2015.0065. - DOI - PMC - PubMed
    1. Pivkin, I. V. et al. Biomechanics of red blood cells in human spleen and consequences for physiology and disease. Proceedings of the National Academy of Sciences, 201606751 (2016). - PMC - PubMed

Publication types