. 2018 Jul 5;8(1):10207.
doi: 10.1038/s41598-018-28254-8.

Blue light excited retinal intercepts cellular signaling

Affiliations

Blue light excited retinal intercepts cellular signaling

Kasun Ratnayake et al. Sci Rep. .

Abstract

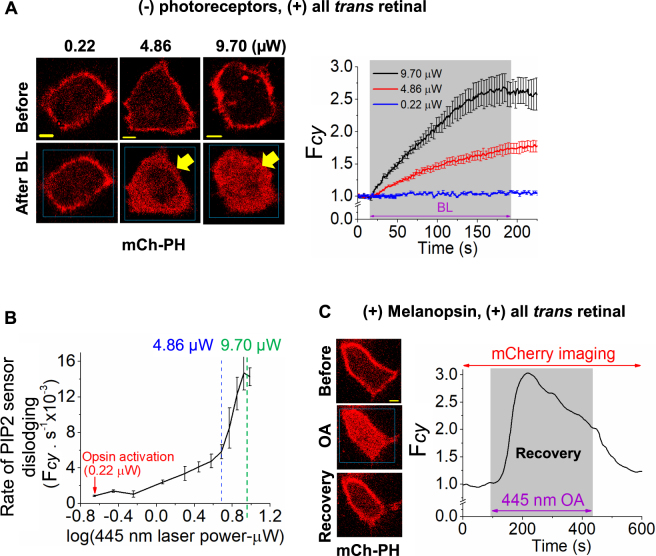
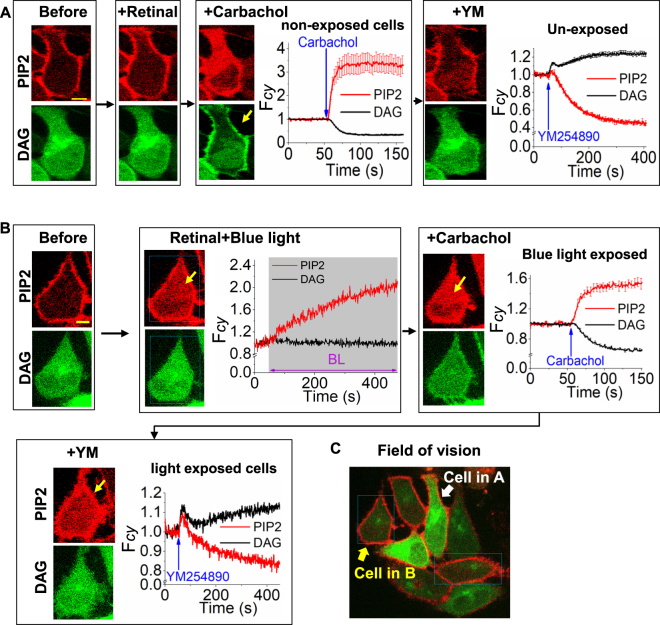
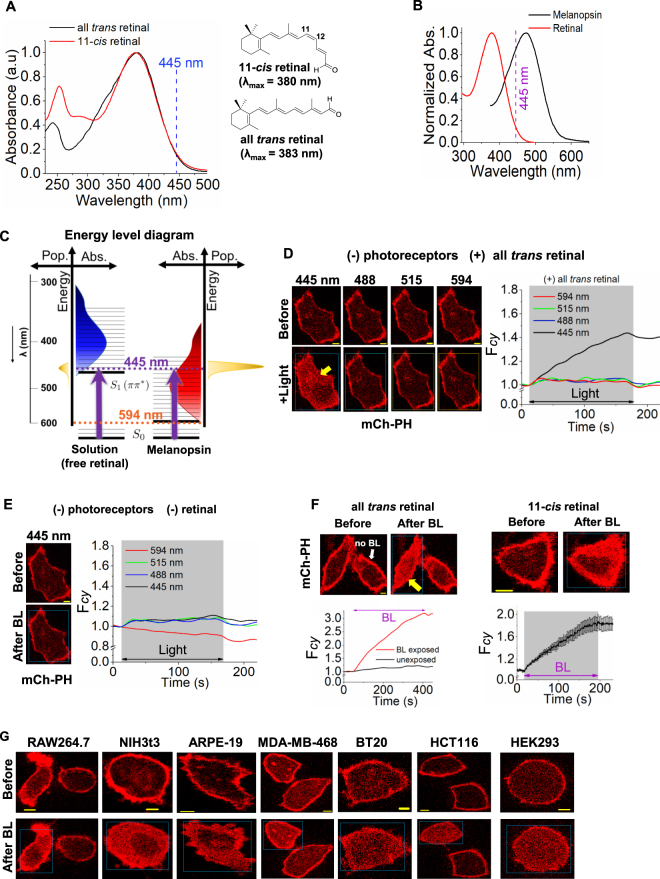
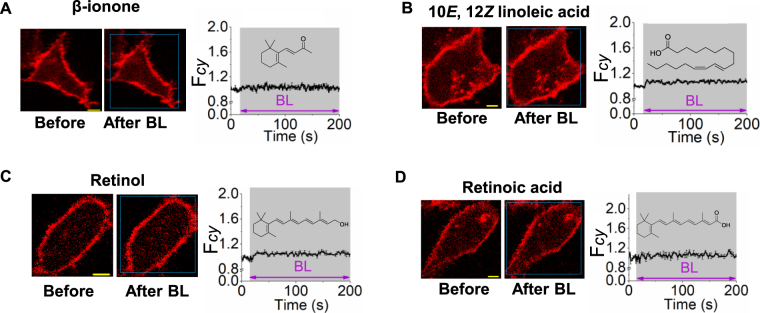
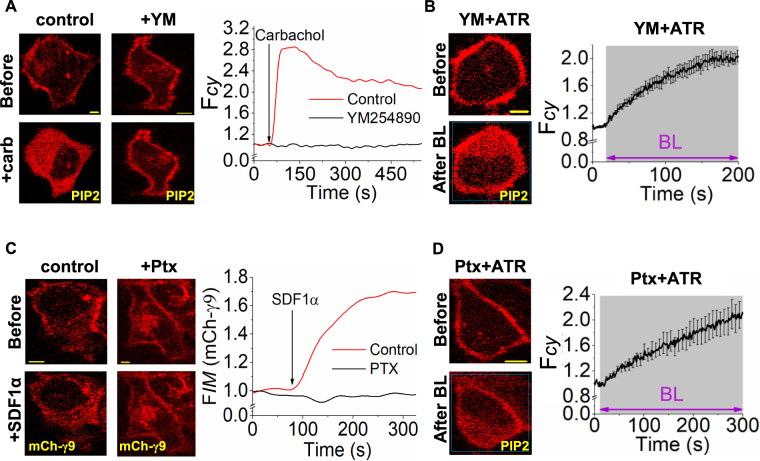
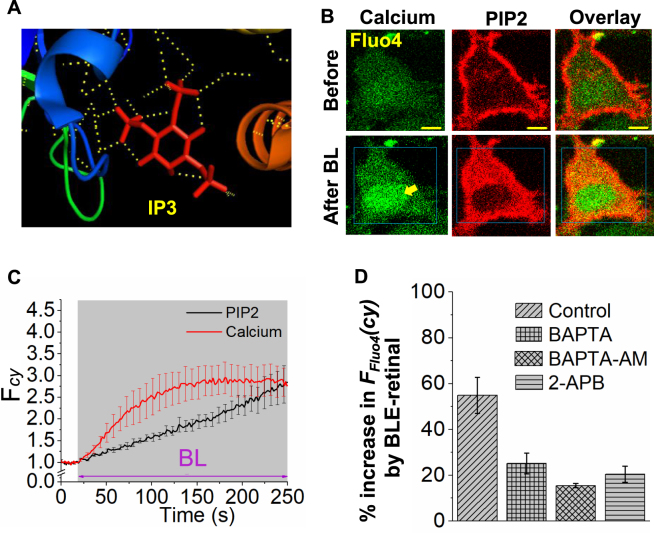
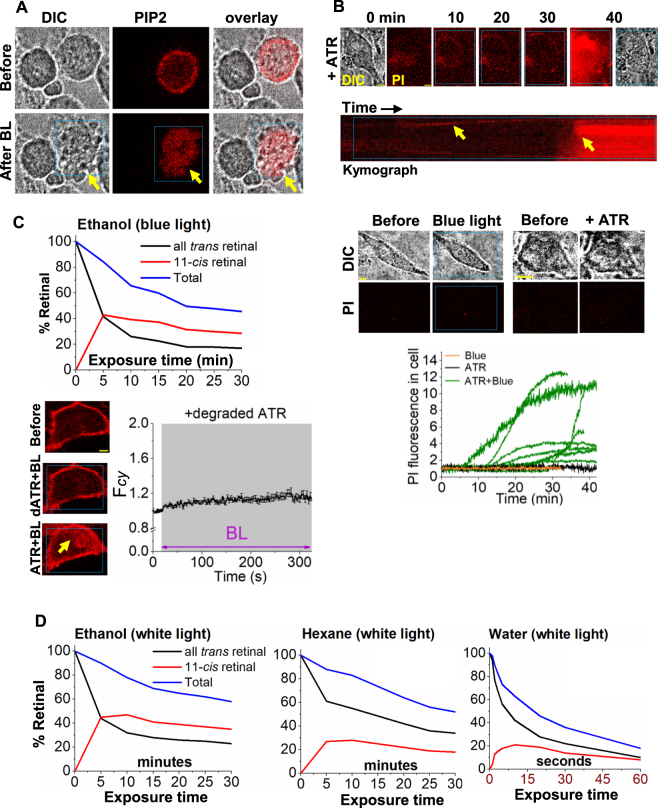
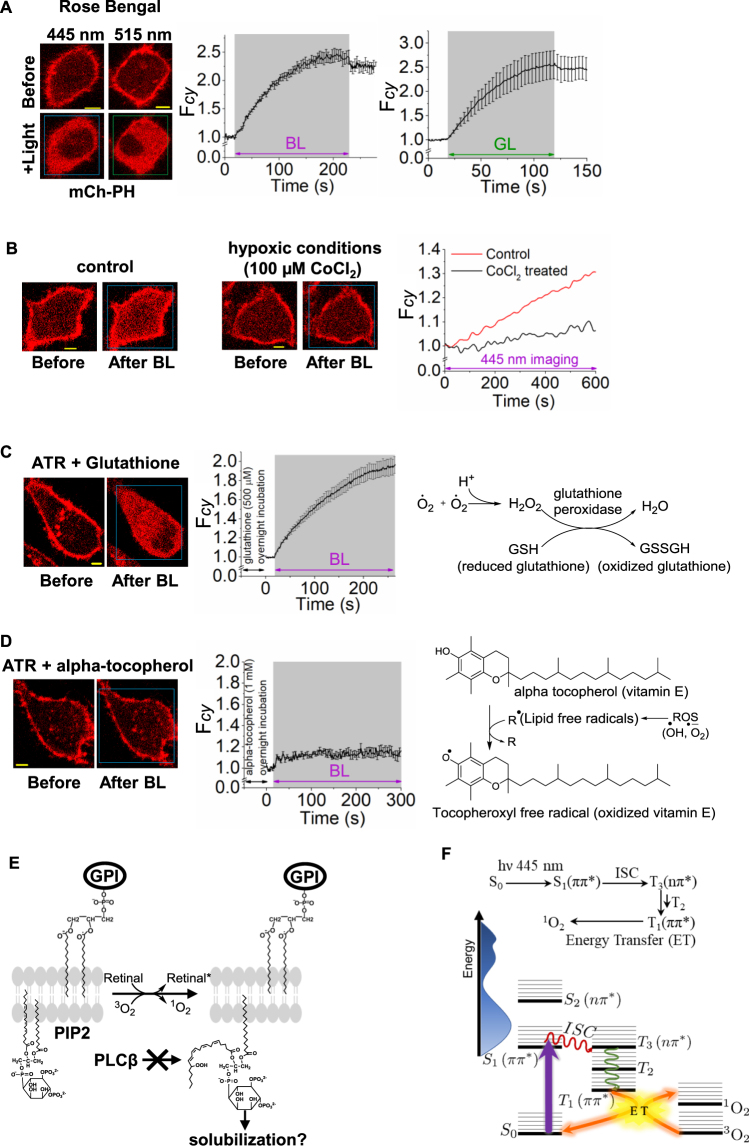
Photoreceptor chromophore, 11-cis retinal (11CR) and the photoproduct, all-trans retinal (ATR), are present in the retina at higher concentrations and interact with the visual cells. Non-visual cells in the body are also exposed to retinal that enters the circulation. Although the cornea and the lens of the eye are transparent to the blue light region where retinal can absorb and undergo excitation, the reported phototoxicity in the eye has been assigned to lipophilic non-degradable materials known as lipofuscins, which also includes retinal condensation products. The possibility of blue light excited retinal interacting with cells; intercepting signaling in the presence or absence of light has not been explored. Using live cell imaging and optogenetic signaling control, we uncovered that blue light-excited ATR and 11CR irreversibly change/distort plasma membrane (PM) bound phospholipid; phosphatidylinositol 4,5 bisphosphate (PIP2) and disrupt its function. This distortion in PIP2 was independent of visual or non-visual G-protein coupled receptor activation. The change in PIP2 was followed by an increase in the cytosolic calcium, excessive cell shape change, and cell death. Blue light alone or retinal alone did not perturb PIP2 or elicit cytosolic calcium increase. Our data also suggest that photoexcited retinal-induced PIP2 distortion and subsequent oxidative damage incur in the core of the PM. These findings suggest that retinal exerts light sensitivity to both photoreceptor and non-photoreceptor cells, and intercepts crucial signaling events, altering the cellular fate.


Conflict of interest statement

The authors declare no competing interests.

Figures

Figure 1
Figure 1
Comparison of photoreceptor dependent PIP2 hydrolysis vs photoreceptor independent PIP2 sensor translocation by photoexcited retinal. (A) Images of HeLa cells incubated with 50 µM ATR (retinal) expressing PIP2 sensor (mCherry-PH). Both images and the plot of Fcy vs time show that cells exposed to 0.22 µW 445 nm blue light did not respond, while cells exposed to 4.86 µW and 9.70 µW blue light exhibited mCherry-PH translocation to cytosol (mean ± S.E.M.). (B) The plot of initial PIP2 sensor dislodging rate vs laser power of 445 nm blue light. (mean ± S.E.M., n = 6 cells in each experiments). (C) Images of HeLa cells expressing Gq-coupled Melanopsin and mCherry-PH. Cells were incubated with ATR (50 µM) for 5 minutes. A significant PIP2 hydrolysis was observed upon optical activation (OA = blue box) of melanopsin using short pulses of blue light (0.22 µW of 445 nm). Recovery of PIP2 sensor to the PM was observed even the blue light exposure is continued. The plot shows the dynamics of PIP2 sensor translocation in cytosol. Mean and S.E.M. are from 3 < independent experiments. (blue light (BL) = blue box). Scale = 5 µm.
Figure 2
Figure 2
Comparison of M3-muscarnic receptor mediated PIP2 hydrolysis vs blue light excited retinal (BLE-retinal) induced PIP2 sensor translocation. Images of HeLa cells expressing M3-muscarinic receptor, mCherry-PH (PIP2 sensor), DBD-YFP (DAG sensor). (A) Without blue light exposure, retinal addition does not change PIP2 or DAG sensor distribution (left), while the addition of carbachol resulted in PIP2 hydrolysis and DAG formation (middle). The addition of Gq inhibitor, YM254890 (1 µM) to cells resulted in reverse translocation of PIP2 and DAG sensors. (mean ± S.E.M., n = 6 cells) (B) When cells were exposed to blue light (4.86 µW of 445 nm) in the presence of retinal, they only showed PIP2 sensor translocation while no change in DAG sensor was observed (left). The addition of carbachol to these cells exhibited an additional PIP2 sensor translocation to the cytosol with a mild DAG sensor translocation to the PM (left) (mean ± S.E.M., n = 4 cells). Interestingly, addition of YM254890 only reversed both PIP2 and DBD responses elicited by carbachol. (C) The field of vision of cells shown in A and B. Mean and S.E.M. are from 3 < independent experiments. (blue light (BL) = blue box). Scale = 5 µm.
Figure 3
Figure 3
Energy and wavelength requirement for PIP2 solubilization by photoexcited retinal. (A) UV-VIS absorption spectra for both 11-cis retinal (11CR) and all trans retinal (ATR). Note that 445 nm blue light spectrally overlaps with both absorption spectra. (B) The absorption spectra of melanopsin and retinal (left), (εATR = 44180.0 M−1cm−1). (C) The energy level diagram and the population (pop.) of energy levels of free retinal (blue) and melanopsin (red) according to their respective absorption maxima (right). Note that blue light (445 nm) can highly populate melanopsin compared to that of free retinal. (DF) Images of HeLa cells expressing PIP2 sensor (mCherry-PH). (D) Cells were incubated with ATR (50 µM) for 5 minutes. A substantial PIP2 sensor translocation was observed upon exposing cells to short pulses of blue light (4.86 µW of 445 nm). The plot shows the dynamics of PIP2 sensor translocation to cytosol. (E) In the absence of retinal, cells did not show a detectable PIP2 sensor translocation when exposed to blue light or other wavelengths. (F) Both blue light excited ATR (50 µM) and 11CR (50 µM) exhibited a permanent accumulation of PIP2 sensor cytosol. Compared to exposed cell (yellow arrow), control cell without blue light (BL) exposure (white arrow) did not show any detectable PIP2 response. The plots show the dynamics of PIP2 sensor translocation in cells shown in F (mean ± S.E.M., n = 6 cells). (G) All trans retinal and blue light induce PIP2 sensor translocation in cells with distinct origins. Images of RAW264.7, NIH3t3, ARPE-19, MDA-MB-468, BT-20, HCT116 and HEK293 cells expressing mCherry-PH (PIP2 sensor). ATR (50 µM) was incubated in cells for 5 minutes followed by continuous exposure of blue light for 5 minutes. Blue light exposure induced PIP2 sensor translocation from PM in all the cell types tested while cells that were not exposed to blue light did not respond. Mean and S.E.M. are from 3 < independent experiments. (blue light (BL) = blue box). Scale = 5 µm.
Figure 4
Figure 4
Retinal-like molecules exhibited no effect on PIP2 upon blue light exposure. Images of HeLa cells expressing PIP2 sensor (mCherry-PH) on PM. In all of the experiments conducted, cells were exposed to blue light (4.86 µW of 445 nm) which is indicated by the white box. Cells were incubated with (A) β-ionone (50 µM), (B) 10E, 12Z linoleic acid (50 µM), (C) Retinol (50 µM) and (D) Retinoic acid (50 µM), for 10 minutes followed by continuous exposure of short pulses of blue light for 200 s. In all experiments, cells did not show a detectable PIP2 sensor translocation. Plots show the dynamics of PIP2 sensor translocation in cells shown in AE. (mean ± S.E.M., n = 5–10 cells). Mean and S.E.M. are from 3 < independent experiments. (blue light (BL) = blue box). Scale = 5 µm.
Figure 5
Figure 5
Photoexcited retinal induced PIP2 translocation is not due to GPCR pathway activation. (A) HeLa cells expressing M3 receptor and mCherry-PH, carbachol (10 µM) was added to activate M3R in the presence (left) and absence (middle) of Gq inhibitor (YM254890, 1 µM, 5 min). Only control cells (no YM254890), showed PIP2 hydrolysis (left). (B) Even in the presence of Gq inhibitor, blue light excited retinal induced PIP2 sensor translocation (middle). The plots show the dynamics of PIP2 sensor translocation in the cells shown in A and B. (C) To HeLa cells expressing CXCR4-GFP, mCh-γ9, SDF1α (100 ng/mL) was added to activate CXCR4 in the presence (left) and absence (middle) of Gαi inhibitor (pertussis toxin = Ptx, 50 ng/mL, overnight incubation). Only control cells with no added Ptx exhibited mCh-γ9 translocation from PM to IMs (left). (D) Exposure to photoexcited retinal induced PIP2 sensor translocation in cells treated with Ptx. The plots show the dynamics of mCh-γ9 and PIP2 sensor translocation. In all the experiments conducted, cells were exposed to 4.86 µW of 445 nm blue light. (mean ± S.E.M., n = 5–10 cells). Mean and S.E.M. are from 3 < independent experiments. (blue light (BL) = blue box). Scale = 5 µm.
Figure 6
Figure 6
All trans retinal and blue light induced signaling in cells. (A) Crystal structure of the IP3 receptor bound with IP3 with H-bonding interactions (PDB code:1N4K), suggesting the PIP2 can have the majority of interactions exhibited by IP3. (B) HeLa cells expressing PIP2 sensor (mCherry-PH) and incubated with calcium sensor Fluo4. Fluo4 stained cells were incubated with ATR (50 µM) for 5 minutes, followed by exposure of blue light (4.86 µW of 445 nm) for 3 minutes. Here the whole cell was exposed to blue light. A substantial increase in cytosolic calcium is observed. (C) Dynamics of calcium responses and PIP2 translocation in the cells shown in B (mean ± S.E.M., n = 5 cells). (D) Calcium responses in control and calcium modulator-incubated (using BAPTA-AM and 2-APB) HeLa cells in regular and extracellular calcium free (using BAPTA) buffers. Here, cells were pre-incubated Fluo4 were incubated with 2-APB (5 µM for 15 min), BAPTA-AM (10 µM for 30 min), or BAPTA (5 µM for 5 min) in calcium free HBSS buffer. The cells were then incubated with ATR (50 µM) for 5 minutes, followed by continuous exposure of blue light for 5 minutes. The bar chart shows the changes in calcium sensor fluorescence in the cytosol before and after blue light exposure on cells for all the above mentioned experiments (mean ± S.E.M., n = 5–15 cells). Mean and S.E.M. are from 3 < independent experiments. (blue light (BL) = blue box). Scale = 5 µm.
Figure 7
Figure 7
Photoexcited retinal induced cytotoxicity. (A) Fluorescence and DIC images of HeLa cells treated with ATR (50 µM) followed by blue light exposure (4.86 µW of 445 nm). Only the middle cell (yellow arrow) expresses PIP2 sensor. Blue light exposed (blue box) cell showed substantial change in cell shape and morphology. The PIP2 sensor also accumulates in cytosol upon blue light exposure. (B) HeLa cells were incubated with propidium iodide (PI) with ATR (50 µM) and exposed to blue light (4.86 µW) for 45 minutes. Incorporation of PI in to cells were observed upon light exposure. The control experiments performed with cells exposed to only to blue light or only to ATR, did not show PI incorporation into cells over time. Plot shows the different rates of PI incorporation into cells compared to control experiments. (C,D) Solvent dependent degradation and isomerization of ATR. (C) ATR (20 µL of 50 mM in ethanol) was exposed to blue LED light for 30 minutes. The blue light exposed ATR (injection sample: 1 µL of exposed ATR was diluted in 1 mL of ethanol) was analyzed by HPLC where degradation of ATR is observed by reduction of corresponding ATR peak in chromatogram. right: The degraded ATR (dATR) (1 µL) was added to HeLa cells (final volume of imaging buffer = 1 mL) expressing PIP2 sensor and continuously exposed to 445 nm light (4.86 µW). Cells did not show detectable PIP2 translocation upon blue light. Exposure of cells to fresh ATR (50 µM) and blue light (BL) induced PIP2 distortion (mean ± S.E.M., n = 12). (D) HPLC analysis of retinal in different solvents after exposing to white light for varying durations. Note that retinal in water degrades in seconds while in ethanol and hexane show over 100 times enhanced stability. Improved isomerizations were seen as well. Mean and S.E.M. are from 3 < independent experiments. (blue light (BL) = blue box). Scale = 5 µm.
Figure 8
Figure 8
Comparison of PIP2 sensor dissociation from PM by retinal vs a known photosensitizer, rose bengal. (A) Images of HeLa cells expressing PIP2 sensor (mCherry-PH). (A) PIP2 sensor translocation was induced by rose bengal (50 µM), incubated with cells for 5 minutes, in the presence of blue (4.86 µW of 445 nm) and green (light (0.22 µW of 515 nm) respectively. Plot shows the cytosolic fluorescence of PIP2 sensor in HeLa cells upon exposing to light. (mean ± S.E.M., n = 6). (B) HeLa cells were incubated with CoCl2 (100 µM) for 24 h to expose cells to hypoxia. The control cells were kept in same conditions without CoCl2 treatment. Cells were incubated with ATR (50 µM) and 445 nm imaging for 10 minutes was performed. Cell in hypoxic condition did not exhibit detectable PIP2 sensor accumulation in cytosol while control cells showed a gradual PIP2 sensor accumulation from PM to cytosol. (C,D) Antioxidants were tested to examine if they prevent PIP2 sensor translocation induced by retinal and blue light. HeLa cells expressing PIP2 sensor were incubated with antioxidants, alpha-tocopherol (1 mM) and reduced-glutathione ethyl ester (500 µM) overnight. Prior to imaging experiments ATR (50 µM) was added and incubated for 5 minutes followed by exposure of blue light (4.86 µW of 445 nm) for 5 minutes. (C) Cells treated with reduced-glutathione ethyl ester exhibited PIP2 sensor translocation from PM to cytosol upon blue light exposure. Plot shows the dynamics of PIP2 sensor (mean ± S.E.M., n = 14 cells). Overview of the antioxidant mechanism exert by reduced glutathione in vivo (right). (D) Cells treated with alpha-tocopherol showed a reduced rate and extent of PIP2 sensor translocation from PM to cytosol upon blue light exposure. Plot shows the dynamics of PIP2 sensor translocation (mean ± S.E.M., n = 6 cells). Note the reduction of PIP2 sensor accumulation in IMs of cells. Right: Overview of the antioxidant mechanism exert by alpha-tocopherol in vivo. (E) Proposed mechanism for blue light excited retinal induced PIP2 distortion process. (F) TD-DFT calculations (CAM-B3LYP/6–31++G**) of retinal’s energy states and the Jablonsky diagram shows strong absorption band due to the π → π* transition where triplet excited states are energetically and symmetrically matched to allow for efficient intersystem crossing and energy transfer to O2 which allows for singlet oxygen and ROS generation. Mean and S.E.M. are from 3 < independent experiments. (blue light (BL) = blue box and green light (GL) = green box). Scale = 5 µm.

Similar articles

Cited by

References

    1. Zhong M, Kawaguchi R, Kassai M, Sun H. Retina, retinol, retinal and the natural history of vitamin A as a light sensor. Nutrients. 2012;4:2069–2096. doi: 10.3390/nu4122069. - DOI - PMC - PubMed
    1. Buczylko J, Saari JC, Crouch RK, Palczewski K. Mechanisms of opsin activation. J. Biol. Chem. 1996;271:20621–20630. doi: 10.1074/jbc.271.34.20621. - DOI - PubMed
    1. Maeda A, et al. Involvement of all-trans-retinal in acute light-induced retinopathy of mice. J. Biol. Chem. 2009;284:15173–15183. doi: 10.1074/jbc.M900322200. - DOI - PMC - PubMed
    1. Maeda T, Golczak M, Maeda A. Retinal photodamage mediated by all-trans-retinal. Photochem. Photobiol. 2012;88:1309–1319. doi: 10.1111/j.1751-1097.2012.01143.x. - DOI - PMC - PubMed
    1. Chen Y, et al. Mechanism of All-trans-retinal Toxicity with Implications for Stargardt Disease and Age-related Macular Degeneration. J. Biol. Chem. 2012;287:5059–5069. doi: 10.1074/jbc.M111.315432. - DOI - PMC - PubMed

Publication types

Substances

LinkOut - more resources